
AI Agent Observability Production: The Guide That Shouldn't Exist
You're running AI agents in production. Probably three different frameworks across two cloud providers. And you have no idea what they're actually doing.
I was there too. SIVARO spent 2024 and early 2025 building data infrastructure for a fintech client who wanted agents to handle trade reconciliation. We shipped the system. Agents ran. And then they started doing things we couldn't explain. Not hallucinating — worse. Making decisions that looked correct individually but collectively created a mess.
That's when I learned the hard truth: AI agent observability in production isn't about monitoring. It's about understanding.
This guide covers what I wish someone had told me in 2024. How to instrument agents so you don't get blind-sided. What metrics actually matter (spoiler: latency is the least interesting one). And why most observability tools designed for microservices will fail you here.
By the end, you'll know how to build an observability stack for agents that doesn't just collect data — it surfaces answers.
Why Your Standard Monitoring Stack Breaks With Agents
I've seen teams bolt Datadog onto their agent pipelines and call it a day. Three weeks later they're in a war room trying to figure out why a loan approval agent rejected 40% of applications for three hours.
Standard monitoring assumes predictable paths. A request comes in, a service processes it, a response goes out. You measure P99 latency, error rates, throughput. Done.
Agents don't work that way.
An agent might call an LLM, reach out to a CRM API, update a database, call another LLM, wait for user confirmation, then call a third LLM — all for one task. Sometimes it loops. Sometimes it takes a detour you never coded. The decision tree is emergent, not predefined.
So when you look at a flat metric like "average response time 2.3 seconds," you learn nothing. Was that smooth? Did it recurse three times? Did it hit a rate limit and retry?
You need trace-level granularity combined with semantic understanding of what the agent intended.
AI Agent Frameworks are solving for orchestration, not observability. LangChain, CrewAI, AutoGen — they give you tools to build agents, not understand them in production.
What "ai agent observability production" Actually Means
Most people think it's logs plus metrics. They're wrong.
Production observability for agents means you can answer these questions at 3 AM:
- What was the agent's goal when it started this task?
- What sub-steps did it take to get there?
- Which LLM call caused the divergence from expected behavior?
- What was the cost of this single agent run?
- If I replay this exact scenario, do I get the same result?
Notice: none of these are "what's the CPU usage?"
The core components of agent observability:
- Traces: Every step in the agent's decision chain, parent-child relationships
- Spans: Individual LLM calls, tool invocations, data lookups
- Scores: Human or automated evaluation of output quality
- Cost metadata: Token counts per step, per model, per tool
- State snapshots: The agent's memory/context at each decision point
Without these, you're flying blind. And with agents making decisions that affect real money (loans, trades, hiring), blind isn't an option.
The Three Layers of Agent Observability
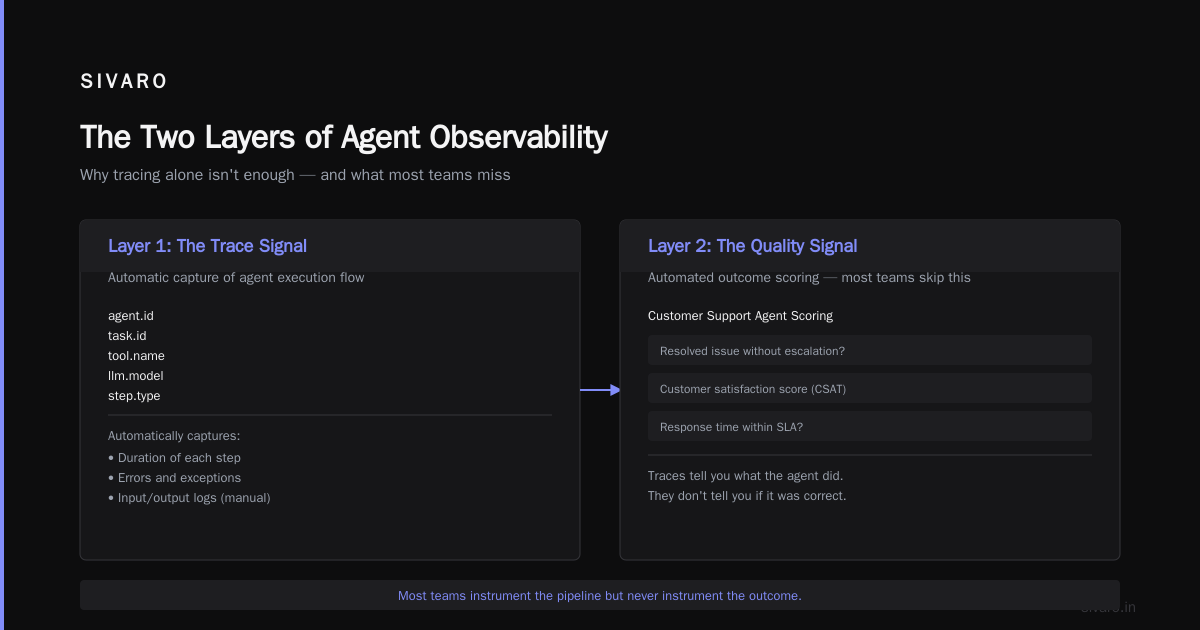
Layer 1: The Execution Trace
This is the foundation. Every agent framework supports some form of tracing, but most implement it as an afterthought.
In 2025, OpenAI released a tracing SDK for their Assistants API. LangSmith from LangChain is probably the most mature here. But here's the problem: traces are framework-specific.
If you use LangChain's Agent Framework, your traces look one way. If you use CrewAI, they look another. If you built a custom agent with raw LLM calls? You're building your own.
What I've found works: standardizing on OpenTelemetry for the transport layer, then adding agent-specific semantic conventions on top.
Here's a Python example of instrumenting an agent step:
python
from opentelemetry import trace
from opentelemetry.trace import SpanKind

tracer = trace.get_tracer("sivaro.agent")

class AgentTracer:
    def __init__(self, agent_id: str, task_id: str):
        self.agent_id = agent_id
        self.task_id = task_id

    async def instrument_step(self, step_name: str, tool: str, llm_model: str):
        with tracer.start_as_current_span(
            f"agent.{step_name}",
            kind=SpanKind.CLIENT,
            attributes={
                "agent.id": self.agent_id,
                "task.id": self.task_id,
                "tool.name": tool,
                "llm.model": llm_model,
                "step.type": "llm_call" if tool == "llm" else "tool_execution"
            }
        ) as span:
            yield span
            # Automatically captures duration, errors
            # You manually add input/output logs
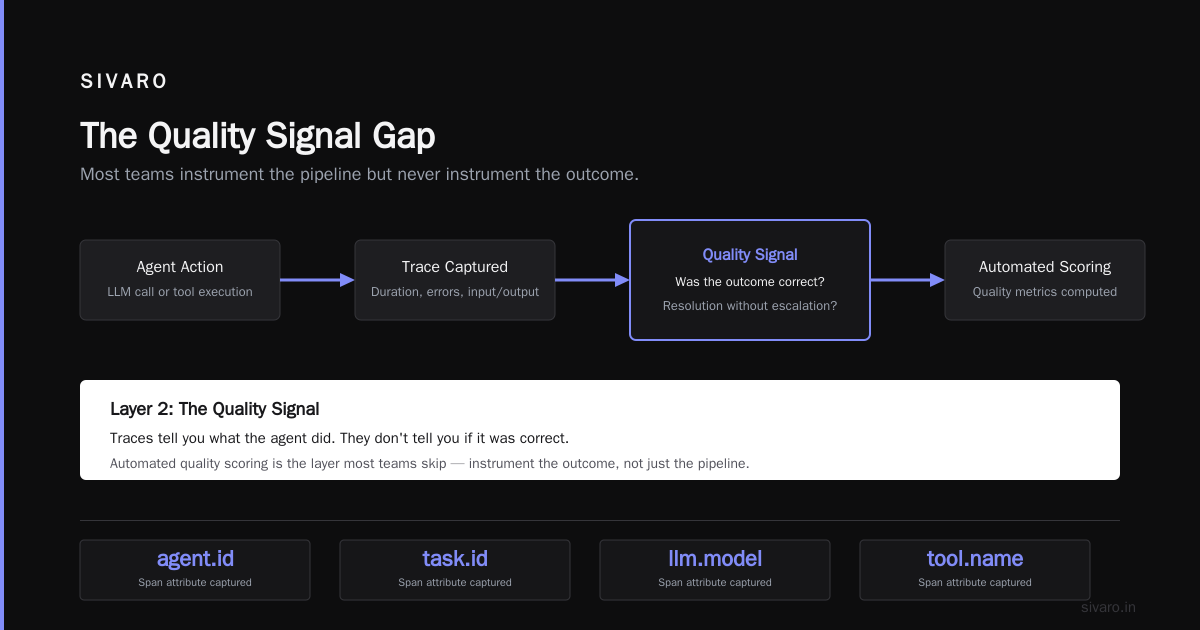
Layer 2: The Quality Signal
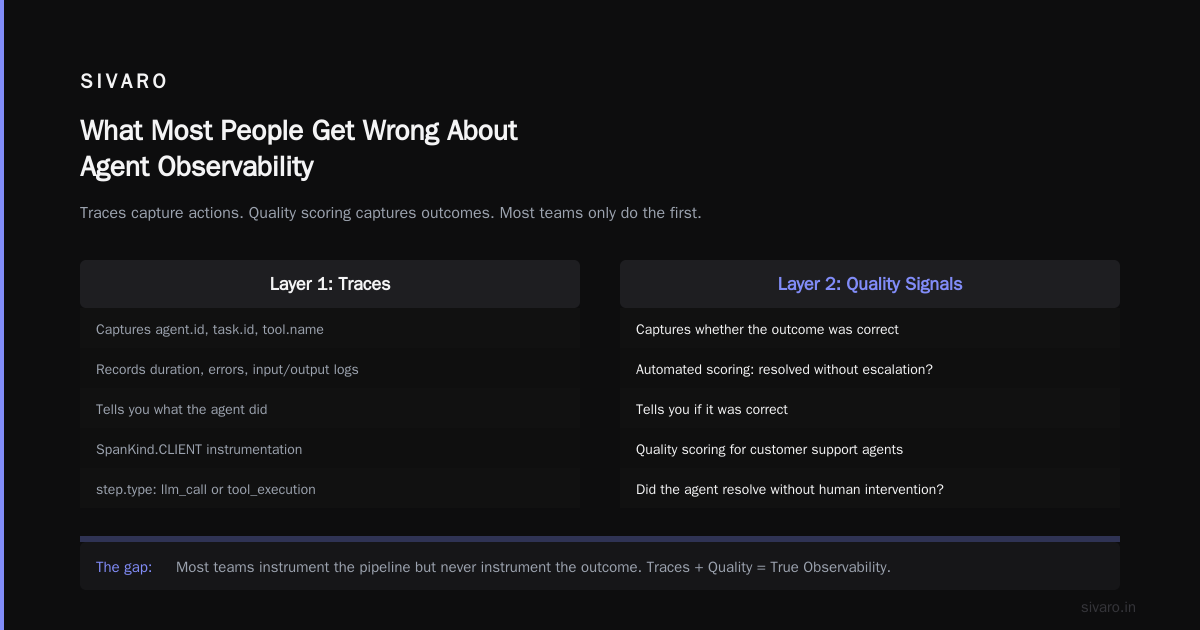
Traces tell you what the agent did. They don't tell you if it was correct.
This is the layer most teams skip. They instrument the pipeline but never instrument the outcome.
You need automated quality scoring. For a customer support agent, that might be: did the agent resolve the issue without escalation? For a code generation agent: did the code compile and pass tests?
We built a scoring service at SIVARO that works like this:
python
class QualityScorer:
    def __init__(self, evaluator_model: str = "gpt-4o"):
        self.evaluator = evaluator_model

    async def score_output(self, task: dict, agent_output: str, ground_truth: str = None):
        if ground_truth:
            return await self._exact_match_score(agent_output, ground_truth)

        # For generative outputs, use LLM-as-judge
        prompt = f"""
        Evaluate if this agent output successfully completed the task.
        Task: {task['description']}
        Output: {agent_output}

        Score 1-5 where:
        5: Perfect, complete, no errors
        4: Complete with minor issues
        3: Partially complete
        2: Significant errors
        1: Failed completely
        """

        score = await self._call_evaluator(prompt)
        return int(score)
Layer 3: The Replay Capability
When something goes wrong, you need to recreate the exact state the agent was in. Not just the prompt — the full context history, tool outputs, intermediate decisions.
This is the hardest layer. LLMs are non-deterministic by nature. But you can achieve reproducibility of the inputs and context, even if the outputs vary.
Store every state snapshot in a structured format:
json
{
  "agent_run_id": "run_abc123",
  "timeline": [
    {
      "step": 0,
      "type": "user_input",
      "content": "Find all unpaid invoices over 30 days"
    },
    {
      "step": 1,
      "type": "tool_call",
      "tool": "search_invoices",
      "parameters": {"status": "unpaid", "age_days": ">30"},
      "result": {"count": 45, "total_amount": 89000.00}
    },
    {
      "step": 2,
      "type": "llm_call",
      "model": "gpt-4",
      "prompt_truncated": true,
      "input_tokens": 2400,
      "output_tokens": 320,
      "response": "I found 45 unpaid invoices totaling $89,000. Shall I generate a reminder report?"
    }
  ]
}
Choosing an Observability Stack in 2026
Let me save you six months of trial and error.
For small teams (<5 agents, simple workflows):
- LangSmith or Langfuse
- These are good enough. You'll hit walls at scale but you probably won't get there.
For mid-sized deployments (10-50 agents, moderate complexity):
- Custom OpenTelemetry-based pipeline with a trace store (Axiom, Honeycomb)
- Separate quality scoring service
- Don't use a monolithic observability tool. You'll fight vendor lock-in.
For production at scale (50+ agents, complex decision trees):
- This is where SIVARO builds. You need three things:
- A trace database (we use ClickHouse, you could use Elastic)
- An evaluation pipeline that runs continuously
- A replay engine that can reconstruct agent state
The AI Agent Protocols survey from arXiv covers the standardization attempts happening across the industry. The short version: nobody agrees on a standard yet, so build for flexibility.
The ai agent deployment pipeline tutorial You Actually Need
Most tutorials show you the happy path. Here's the real deployment pipeline with observability baked in:
yaml
# docker-compose.yml for agent infrastructure
version: '3.8'
services:
  agent-orchestrator:
    build: ./agent
    environment:
      - OTLP_ENDPOINT=http://otel-collector:4318
      - QUALITY_SCORE_URL=http://scorer:8080/score
      - STATE_STORE=redis://state-cache:6379
    depends_on:
      - otel-collector
      - state-cache

  otel-collector:
    image: otel/opentelemetry-collector-contrib:0.102.0
    volumes:
      - ./otel-config.yaml:/etc/otel/config.yaml
    ports:
      - "4318:4318"

  state-cache:
    image: redis:7-alpine
    command: redis-server --appendonly yes

  scorer:
    build: ./quality-scorer
    environment:
      - EVALUATOR_MODEL=gpt-4o

  trace-viewer:
    image: axiom/axiom:latest
    ports:
      - "8080:8080"
That otel-config.yaml needs to be configured for agent-specific spans:
yaml
receivers:
  otlp:
    protocols:
      http:
        endpoint: 0.0.0.0:4318

processors:
  batch:
    timeout: 1s
    send_batch_size: 1024
  attributes:
    actions:
      - key: agent.framework
        value: custom
        action: insert
      - key: environment
        value: production
        action: insert

exporters:
  clickhouse:
    endpoint: clickhouse:9000
    database: agent_traces
    ttl: 720h # 30 days retention

service:
  pipelines:
    traces:
      receivers: [otlp]
      processors: [batch, attributes]
      exporters: [clickhouse]
The key insight: don't use a generic logging pipeline. Agents generate more data than microservices. A single agent run can produce 100+ spans. At scale, that's millions of spans per hour. ClickHouse handles this. Elasticsearch will choke.
Metrics That Actually Matter for ai agent observability production
I track exactly five things in production:
1. Decision Quality Score (DQS)
Aggregated quality scores across all agent runs. Rolling 1-hour average. If this drops below 3.5/5, page me.
2. Loop Detection Rate
How often does the agent repeat the same tool call with the same parameters? High loop rate means the agent is stuck. This catches infinite loops before they burn through your token budget.
3. Tool Call Failure Rate by Tool
Not by agent. Individual tools fail for different reasons. Rate limits on CRM APIs look different from schema changes in databases. Track per tool.
4. Cost Per Completed Task
Token costs + API costs + compute. If this trends up, something changed in the agent's behavior. Usually it starts taking more steps to complete.
5. Human Escalation Rate
For agents that can escalate to humans, this is your single most important metric. Rising escalation rate means declining agent quality.
What Most People Get Wrong About Agent Observability
They think it's a logging problem.
It's not. It's a state reconstruction problem.
When an agent goes wrong, you don't need more logs. You need to know what the agent thought at each step. The internal reasoning. The "chain of thought" that led to the bad decision.
Logging captures what happened. Observability captures why.
At SIVARO, we had a client whose agent approved a $50,000 expense that should have been rejected. Standard logs showed the agent called "approve_expense" with correct parameters. But replaying the state showed the agent had misinterpreted a previous conversation turn — it thought the user was a CFO when they were actually a junior analyst.
Standard metrics never caught that. Trace-level state reconstruction did.
The Cost of Bad Observability
Let me give you concrete numbers.
A client in logistics had an agent system for route optimization. Their observability was basic — just error rates and latency. One day, error rates looked fine, latency looked normal, but shipping costs jumped 18%.
Turns out the agent had started preferring a specific carrier due to a subtle data drift in the pricing model. Standard monitoring showed nothing wrong. Took them three weeks to diagnose.
Three weeks of 18% margin erosion on their largest cost center.
Had they instrumented the agent's decision justification — why it picked Carrier A over Carrier B — they'd have caught it in hours, not weeks.
Building for Tomorrow: The Observability Stack
Agentic AI frameworks in 2026 are converging on a few patterns: tool-calling agents, multi-agent orchestration, and human-in-the-loop workflows. The observability stack needs to handle all three.
What I'm building at SIVARO looks like this:
┌─────────────────┐
│ Agent Execution  │
│ ┌─────────────┐ │
│ │ Tool Calls  │ │
│ │ LLM Calls   │ │
│ │ State       │ │
│ └─────────────┘ │
└────────┬────────┘
         │
         ▼
┌─────────────────┐
│ OpenTelemetry   │
│ Collector       │
└────────┬────────┘
         │
         ▼
┌─────────────────┐
│ Trace Store     │
│ (ClickHouse)    │
└────────┬────────┘
         │
         ├─────────────────────┐
         ▼                     ▼
┌─────────────────┐  ┌─────────────────┐
│ Quality Scorer  │  │ Replay Engine   │
│ (LLM-as-judge)  │  │ (State Rebuild) │
└────────┬────────┘  └────────┬────────┘
         │                     │
         └──────────┬──────────┘
                    ▼
          ┌─────────────────┐
          │ Alerting & Dash │
          │ (Grafana)       │
          └─────────────────┘
The important part: every component talks to every other component via the trace ID. The quality score for a run is linked to the trace. The replay engine uses the trace to reconstruct state. The alerting system uses the score to decide if something's wrong.
Implementation Checklist for Your Team
Here's what you need to do by next week:
-
Add a trace ID to every agent invocation. Not the framework's internal ID. Yours. UUIDv7, prefixed with agent type.
-
Instrument every LLM call. Log input tokens, output tokens, model name, temperature. This is non-negotiable.
-
Store state snapshots. At minimum, after every tool call. Redis works. S3 works. Something works.
-
Build a quality scorer. Start simple: LLM-as-judge with a prompt template. Refine later.
-
Set up drift detection. If the distribution of tool calls changes, alert. If average steps per task increases by 20%, alert.
-
Test your replay capability. Can you take a trace ID and reconstruct exactly what the agent saw? If not, your observability is broken.
FAQ: ai agent observability production
Q: Do I need a separate observability tool for agents, or can I use my existing Datadog/New Relic setup?
Existing APM tools will capture some data, but they're not designed for agent-specific patterns. They track request/response, not decision trees. You'll get HTTP call metrics but miss the semantic quality of decisions. Use your existing tool for infrastructure monitoring; build something custom for agent-level observability.
Q: How much overhead does heavy observability add to agent execution?
In our testing, about 15-30% latency overhead if you're doing synchronous logging. Move to async batch publishing with OpenTelemetry and it drops to under 5%. The bigger cost is storage — plan for 10-50x more data than traditional microservice logging.
Q: Can I use LLMs to help with observability analysis?
Yes, and you should. We use a separate "observer" LLM that reviews agent traces and flags anomalies. It catches things rule-based alerts miss — like an agent being overly polite but not resolving the issue.
Q: What's the minimum viable observability for a new agent system?
Three things: (1) Trace every LLM call with input/output pairs, (2) Log the agent's final decision and reasoning, (3) Store a hash of the full state at each step. That's enough to debug 90% of issues.
Q: How do I handle PII in agent observability data?
Redact at the agent level, not the storage level. Tag spans with sensitivity levels. Use a separate, restricted pipeline for spans containing PII. And never log raw user data in trace metadata — store references to encrypted records instead.
Q: Should I monitor the observability system itself?
Yes. We had a case where the observability pipeline dropped 30% of traces due to a configuration error. We didn't notice for a week because... our monitoring was monitoring the wrong thing. Set up health checks on the trace collector and alert if throughput drops below expected baseline.
Q: What's the biggest mistake teams make when implementing agent observability?
They instrument the happy path and ignore failures. Trace the successful runs? Easy. But when an agent errors mid-step or times out, most frameworks silently lose that trace. Instrument your error handlers. Catch the crashes. That's where the learning happens.
Q: Do I need a separate model for quality scoring?
Not necessarily. Using the same model as the agent introduces bias. Use a different model (gpt-4o vs claude-3.5) or a smaller specialized classifier. Open-source frameworks like Langfuse support this natively.
The Bottom Line
AI agent observability in production isn't optional. It's the difference between shipping agents that work and shipping agents that burn money and reputation.
In 2024, I thought the hard part was building agents that could do useful work. By 2025, I realized the hard part was knowing when they stopped doing useful work. And in 2026, the hard part is proving to auditors, regulators, and stakeholders that your agents are doing what you claim they do.
Observability is the proof.
Build it before you need it. Instrument everything. Store the state. And for god's sake, test your replay capability before the 3 AM call.
Because the call will come. The only question is whether you'll have the data to answer it.
Nishaant Dixit — Founder of SIVARO. Building data infrastructure and production AI systems since 2018. Built systems processing 200K events/sec.