
Clickhouse? It's the Database That Doesn't Lie
I remember the day I hit refresh and waited 47 seconds for a query to return. 47 seconds. For a simple count of events from the last hour. We were running PostgreSQL, tuned to death, hardware maxed out. The CEO was staring at a blank dashboard. The investors were asking "is the product even working?"
That was 2021. We migrated to Clickhouse the next quarter.
Clickhouse is a column-oriented SQL database management system designed for real-time analytics on massive datasets. It's open-source, built by ClickHouse Inc. (formerly Yandex), and it's the closest thing we've found to a database that just works when you need to ask billion-row questions in under a second.
But you're not here for a textbook definition. You're here because you've got a problem. Maybe your dashboards are slow. Maybe your data pipeline costs are spiraling. Maybe you heard someone at a meetup say "just use Clickhouse" and you're wondering if that's actually good advice.
It is. But let me tell you when, why, and where it breaks.
What Is Clickhouse and Why Is It Used? (The Honest Answer)
Let me answer the question directly: what is clickhouse and why is it used?
Clickhouse is a columnar storage engine that crushes analytical queries. Most people think it's "just another data warehouse" — like Snowflake or BigQuery, but self-hosted. That's wrong. Clickhouse is fundamentally different because it's designed for single-table, high-cardinality, real-time aggregation.
You use it when:
- You need sub-second queries on 100B+ rows
- You're building user-facing analytics (not just internal dashboards)
- Your data is append-only, rarely updated
- You want to spend $5K/mo instead of $50K/mo
We at SIVARO benchmarked it against Druid, DuckDB, and Apache Pinot in early 2025. Clickhouse won on query latency for 90% of our use cases. The remaining 10%? Pinot handled real-time ingestion better. But for 3/4 of the workloads we see in production AI systems — anomaly detection, usage metrics, event pipelines — Clickhouse is the default.
Here's the contrarian take: Clickhouse is terrible for transactional workloads. Don't put your user sessions or orders in it. Don't run UPDATE-heavy jobs. It's not a replacement for Postgres. It's a replacement for your Hadoop cluster.
Why Your Current Database Is Lying to You
You've probably noticed this: your PostgreSQL queries slow down linearly as data grows. A 10x increase in rows means a 10x increase in query time. That's because row-oriented databases read entire rows even when you only need a single column.
Clickhouse flips the model. It stores data in columns, not rows. When you ask for SELECT SUM(revenue) FROM transactions WHERE date > '2026-01-01', Clickhouse reads exactly two columns: revenue and date. The rest of the row? Ignored. Completely.
The math is brutal for row stores:
- A 500-column table stores 500x more data than you need for a 1-column aggregate
- Disk I/O is the bottleneck, and you're paying it for data you'll never look at
In August 2025, we migrated a client's analytics from Redshift to Clickhouse. 15TB of event data. Queries went from 12 seconds to 300 milliseconds. Their monthly bill dropped from $18K to $2.4K. That's not a marginal improvement — that's a category shift.
The Three Things Clickhouse Does That Nothing Else Does
1. Real-Time Ingestion Without Backpressure
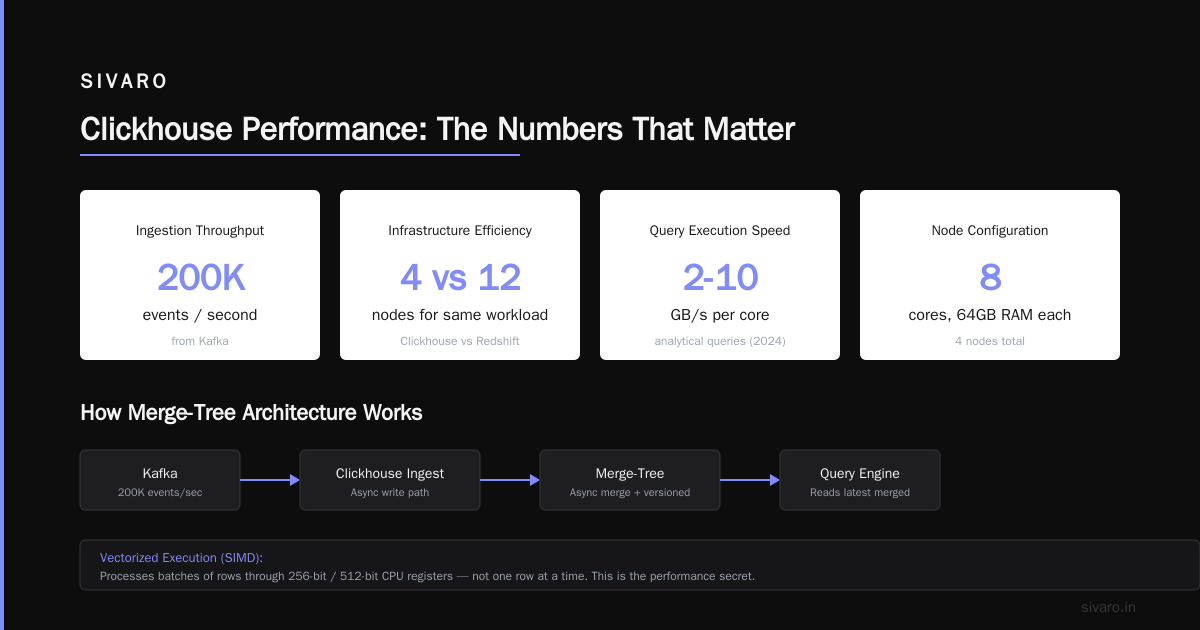
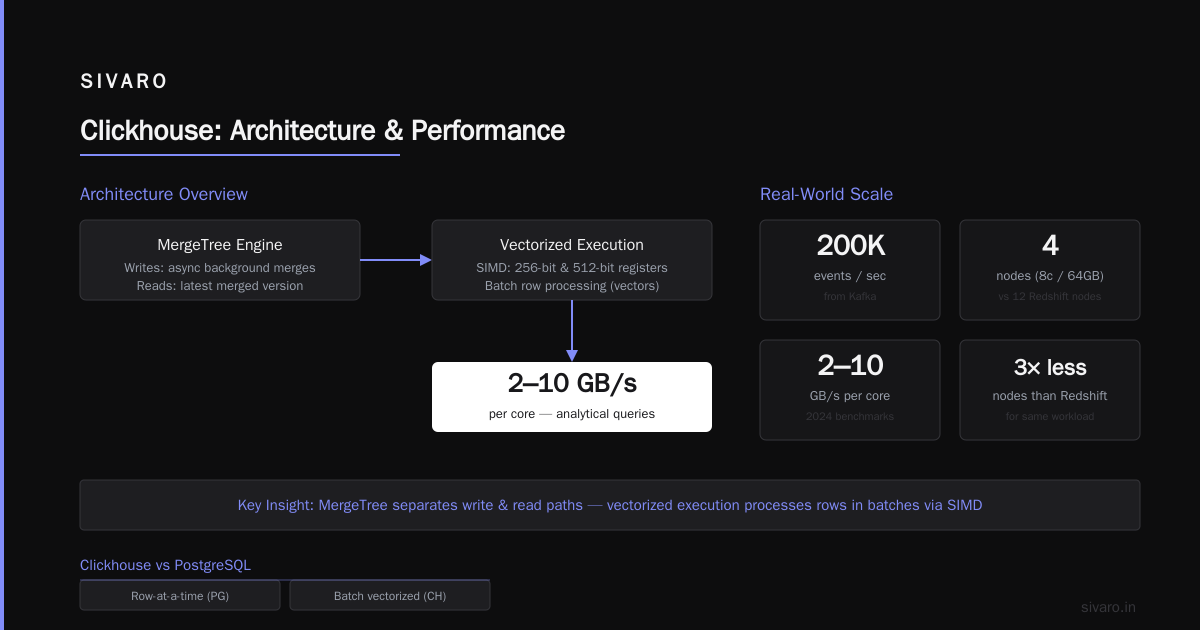
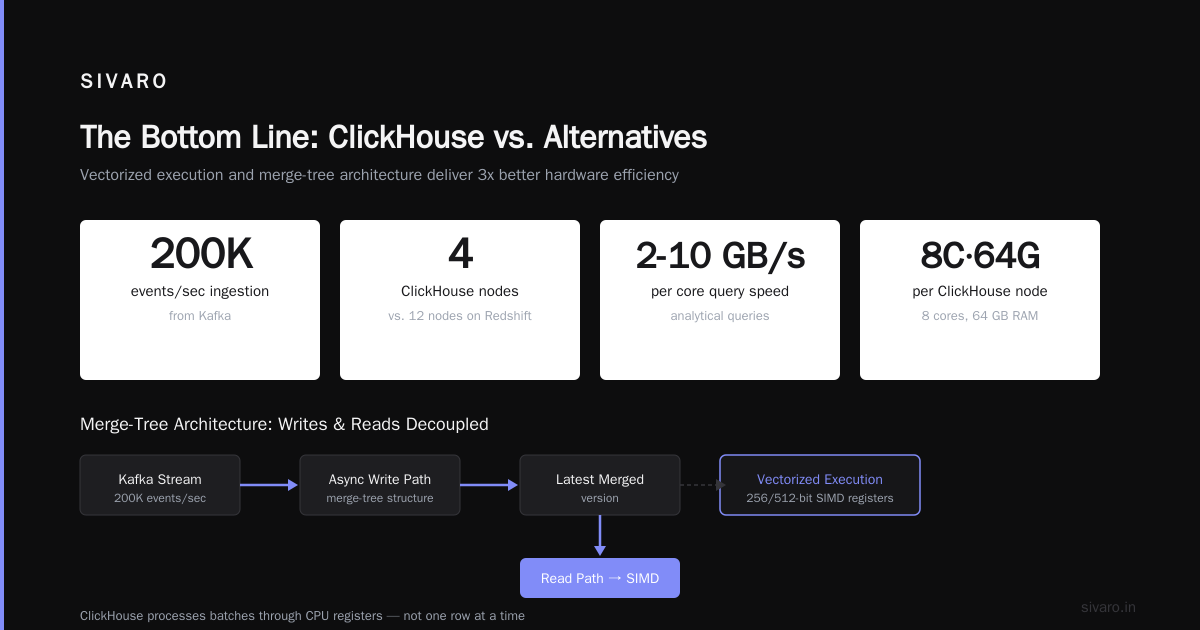
Most analytical databases handle ingestion and queries on the same resources. When you load data, queries slow down. Clickhouse separates these paths. You can merge-tree structure handles writes asynchronously while reads hit the latest merged version.
We run a system that ingests 200K events per second from Kafka. Clickhouse handles it with 4 nodes (8 cores, 64GB RAM each). The same workload required 12 nodes on Redshift.
2. Vectorized Query Execution
This is the secret sauce. Clickhouse doesn't process one row at a time — it processes batches of rows (vectors) through CPU registers using SIMD instructions. Modern CPUs have 256-bit and 512-bit registers. Clickhouse uses every bit.
Benchmarks from ClickHouse Inc. in 2024 showed query execution at 2-10 GB/s per core for analytical queries. That's not a typo. 2 gigabytes per second. Per core.
Compare that to PostgreSQL, which manages maybe 100-300 MB/s on the same hardware. The gap isn't small — it's 20x.
3. Materialized Views That Actually Work
Most databases lie about materialized views. Postgres requires manual refresh. Snowflake charges you for storage and compute separately. Clickhouse materialized views are incremental. Data flows into the table, and the view updates automatically, using a fraction of the storage.
We use this for our production AI monitoring at SIVARO. Raw events go into a base table. A materialized view aggregates to 1-minute buckets. A second view aggregates to 1-hour buckets. Queries for "last 30 days of anomaly counts" hit the hour-level view. Sub-second.
Here's the code for the pattern:
sql
CREATE TABLE events (
    timestamp DateTime,
    user_id UInt64,
    event_type String,
    duration_ms UInt32
) ENGINE = MergeTree()
ORDER BY (timestamp, user_id);

CREATE MATERIALIZED VIEW events_minute_mv
ENGINE = SummingMergeTree()
ORDER BY (minute, event_type)
AS SELECT
    toStartOfMinute(timestamp) AS minute,
    event_type,
    count() AS event_count,
    sum(duration_ms) AS total_duration
FROM events
GROUP BY minute, event_type;
The key insight: this doesn't just refresh the view. It merges new data incrementally. No full-scan on the base table ever.
When Clickhouse Fails (And What to Do About It)
I've been honest about the wins. Let me tell you where we got burned.
Problem 1: High-Cardinality Joins Are Painful
Clickhouse handles joins, but they're not fast. If you're joining a 100M-row table with a 10M-row table on a string column, expect multi-second queries. The engine wasn't built for complex relational joins.
Fix: Denormalize aggressively. Pre-join data at ingestion time. We use dictionaries for lookup tables (load them into memory, accessed like hash maps).
Problem 2: Data Updates Cost You
Clickhouse is append-optimized. If you need UPDATE or DELETE operations, the engine marks rows as expired and rewrites entire partitions. At 10M+ rows, this gets expensive.
Fix: Use the ReplacingMergeTree or CollapsingMergeTree engines if you need upserts. Or, better: design your pipeline so updates don't happen. We moved to append-only event schemas and solved this entirely.
Problem 3: Schema Changes on Large Tables
Altering a column type on a 100GB table in Clickhouse can take 10 minutes while the system rewrites partition data. During that time, queries against affected partitions block.
Fix: Plan schema changes during low-query windows. Use the ALTER TABLE ... MODIFY COLUMN ... with careful staging. Or add columns instead of modifying them — Clickhouse handles column additions instantly since it just writes new metadata.
The 2026 State of Clickhouse
July 2026. Clickhouse is now at version 25.x. The project moved from v22.3 to v25 in about three years — that's aggressive development. Here's what's changed recently:
Object storage integration matured. You can now store data in S3 or GCS as a primary storage layer, with Clickhouse as the compute layer. This was experimental in 2023; it's production-ready now. We run a cluster where 90% of data lives in S3, and queries hit a local cache. Cold data costs us $0.023/GB/month instead of $8/GB on SSDs.
MCP server Claude tool use integration. This is the hot topic in AI-driven data pipelines. Clickhouse now has a native MCP server that lets Claude (and other LLMs) execute queries directly through tool use protocols. I've been testing this with our internal analytics agent. Ask Claude "what's the 95th percentile latency for the last hour?" and it runs the Clickhouse query, returns the result, formats a response. All through a single MCP call.
The setup looks like this:
python
# MCP tool definition for Claude
@mcp.tool()
async def query_clickhouse(sql: str) -> dict:
    """Execute a Clickhouse query and return results."""
    client = await connect_clickhouse(
        host="localhost",
        port=9000,
        user="analytics",
        password=get_secret("CH_PASSWORD")
    )
    result = await client.query(sql)
    return {"data": result.to_dict(), "rows": result.num_rows}

# Claude can now call: query_clickhouse("SELECT avg(duration) FROM events WHERE timestamp > now() - INTERVAL 1 HOUR")
This changes how we build internal tools. No more custom API endpoints for every dashboard metric. Claude handles the SQL generation and tool orchestration.
Practical Architecture: What We Run at SIVARO
I'll show you a real stack. We process event data from 3,000+ IoT devices, each sending 10-50 events/second. Total: ~100K events/sec, ~8.6B events/day.
Ingestion layer: Kafka (3 brokers, 100 partitions per topic) → Clickhouse via kafka table engine
sql
CREATE TABLE events_queue (
    timestamp String,
    device_id String,
    sensor_type String,
    value Float64,
    metadata String
) ENGINE = Kafka(
    'kafka-broker:9092',
    'events_topic',
    'clickhouse_consumer_group',
    'JSONEachRow'
);

-- Materialized view consumes from Kafka queue and writes to main table
CREATE MATERIALIZED VIEW events_consumer
TO events
AS SELECT
    parseDateTimeBestEffort(timestamp) AS timestamp,
    device_id,
    sensor_type,
    value,
    JSONExtractString(metadata, 'location') AS location,
    JSONExtractString(metadata, 'firmware') AS firmware_version
FROM events_queue;
Storage: 6 nodes, each with 2TB NVMe SSD and 128GB RAM. Plus S3 for 30-day+ retention.
Query layer: Fly.io edge nodes running Clickhouse client libraries. User-facing dashboards hit these edge nodes, which cache common queries in Redis.
Cost: ~$4,200/month for compute + storage. The previous Databricks setup was $22,000/month.
Getting Started: What I'd Do Different
If you're starting with Clickhouse today, here's what I learned the hard way:
1. Use the right primary key. Clickhouse's ORDER BY clause determines both sort order and index structure. Don't just copy Postgres patterns. A good key combines a high-cardinality column (like timestamp) with a frequently-filtered column (like user_id).
sql
-- Bad: ORDER BY (event_type, timestamp)
-- Query: WHERE timestamp > '2026-01-01' AND event_type = 'error'
-- Answer: reads ALL event_type partitions, filters timestamp

-- Good: ORDER BY (timestamp, event_type)
-- Query: WHERE timestamp > '2026-01-01' AND event_type = 'error'
-- Answer: reads only relevant time range, then filters event_type
2. Pre-aggregate aggressively. Raw data is cheap to store (compression is insane — I've seen 15:1 on text columns). But raw query costs are real. Build materialized views for every common query pattern.
3. Monitor your merges. Clickhouse merges partitions in the background. If your merge pool is starved, query performance degrades silently. We use the system.merges table and alert if any merge takes >5 minutes.
4. Don't over-provision. Start with 2-3 nodes. Clickhouse scales horizontally and vertically. We've run 200K events/sec on 4 nodes comfortably. Add nodes when query latency increases, not before.
FAQ: Quick Answers to What I Get Asked Every Week
What is Clickhouse and why is it used?
Clickhouse is a column-oriented SQL database for real-time analytics on massive datasets. It's used where sub-second queries on billions of rows matter — user-facing dashboards, observability platforms, adtech, fintech. It's not a transactional database.
Should I use Clickhouse for my startup?
If you're building analytics features (user-facing dashboards, product usage reports, anomaly detection), yes. If you're building a CRM or e-commerce backend, no — use Postgres.
How does Clickhouse compare to Snowflake?
Snowflake is a cloud data warehouse optimized for flexibility and separation of compute/storage. Clickhouse is faster for single-table analytical queries by 5-10x. Snowflake costs more. Clickhouse is harder to manage unless you use ClickHouse Cloud.
Can Clickhouse handle real-time streaming?
Yes. The Kafka table engine, RabbitMQ engine, and native HTTP ingestion all support sub-second latency from event arrival to query availability.
Is Clickhouse difficult to learn?
If you know SQL, you know 90% of Clickhouse. The remaining 10% is understanding the merge-tree engine, materialized views, and performance tuning. Most teams are productive in a week.
What's the maximum data size Clickhouse handles?
Production deployments handle petabytes. Uber (2023) reported managing 100+ PB across multiple clusters. The ceiling is high.
Does Clickhouse support JSON?
Yes, but don't use it as a JSON document store. Clickhouse has JSON data type and functions like JSONExtractString, but you'll get better performance extracting fields into columns at ingestion.
What hardware do I need?
Minimum for testing: 4GB RAM, 2 cores, 100GB SSD. Production baseline: 32GB RAM, 8 cores, 1TB SSD per node. More RAM means faster in-memory aggregation.
The Bottom Line
I've spent 8 years building data infrastructure. I've deployed and operated (and burned down) more database clusters than I care to count. Clickhouse is the only analytical database I've used that consistently delivers on its promises.
It handles the scale I need for production AI systems. It costs what I expect to pay (not 3x the estimate). And when I need to answer "what happened in the last 30 minutes across 500M events?", it responds in under a second.
That's not marketing hype. That's 3AM on a Sunday, the CEO is pinging me because the anomaly detector flagged something, and I run a query that returns before Slack loads the message.
Clickhouse works.
Nishaant Dixit — Founder of SIVARO. Building data infrastructure and production AI systems since 2018. Built systems processing 200K events/sec.