LLM Observability Monitoring Tools: A Practitioner’s Guide
You’ve deployed your LLM. Prompt engineering is solid. The RAG pipeline works in staging. Then production hits — and the model starts hallucinating like a stressed intern under deadline.
This is where LLM observability monitoring tools stop being optional and start being essential. They’re not dashboards for engineers who like green lights. They’re surgical instruments for debugging non-deterministic systems that fail in ways you can’t reproduce.
I’ve spent 2024–2026 building and deploying production AI systems at SIVARO. I’ve tested 14 different monitoring tools across 3 production deployments. This guide condenses what I learned — what works, what doesn’t, and how to actually set up observability without drowning in data.
What Exactly Is LLM Observability?
LLM observability is tracking, logging, and analyzing every interaction between users and your LLM applications — but with a twist. Traditional monitoring looks at uptime and latency. LLM monitoring must also measure correctness, safety, relevance, and cost.
According to Datadog’s knowledge center, LLM observability covers tracing, metrics, and logging — but adds evaluation layers for prompt quality, response accuracy, and model drift. You’re not just watching a server. You’re watching a reasoning engine that can lie with total confidence.
The core difference: traditional APIs return the same output for the same input. LLMs don’t. A temperature setting of 0.7 guarantees you’ll never get the same answer twice. That’s not a bug — it’s the whole point. But it makes debugging brutal.
Why Monitoring Failures Here Is Different
Most people think monitoring an LLM is like monitoring any API. They’re wrong.
LLMs create novel failure modes:
- Hallucinations — the model asserts false facts with perfect grammar
- Toxicity — adversarial inputs trigger harmful outputs
- Topic drift — the assistant starts answering questions it wasn’t asked
- Cost explosions — long context windows burn tokens faster than expected
- Latency spikes — smaller models can still stall under concurrent load
Traditional server monitoring tools (Prometheus, Grafana) track infrastructure. They don’t tell you if your chatbot just recommended a child take aspirin.
As IBM’s explainer notes, LLM observability extends beyond technical metrics into AI governance. You need to know not just whether the system responded, but how it responded — and whether that response was appropriate.
Core Components You Actually Need
Let me save you weeks of research. Here’s what your observability stack must track:
1. Input/Output Tracking
Every prompt sent to the model. Every response returned. Raw, unmodified. You need this for debugging, audit trails, and replay.
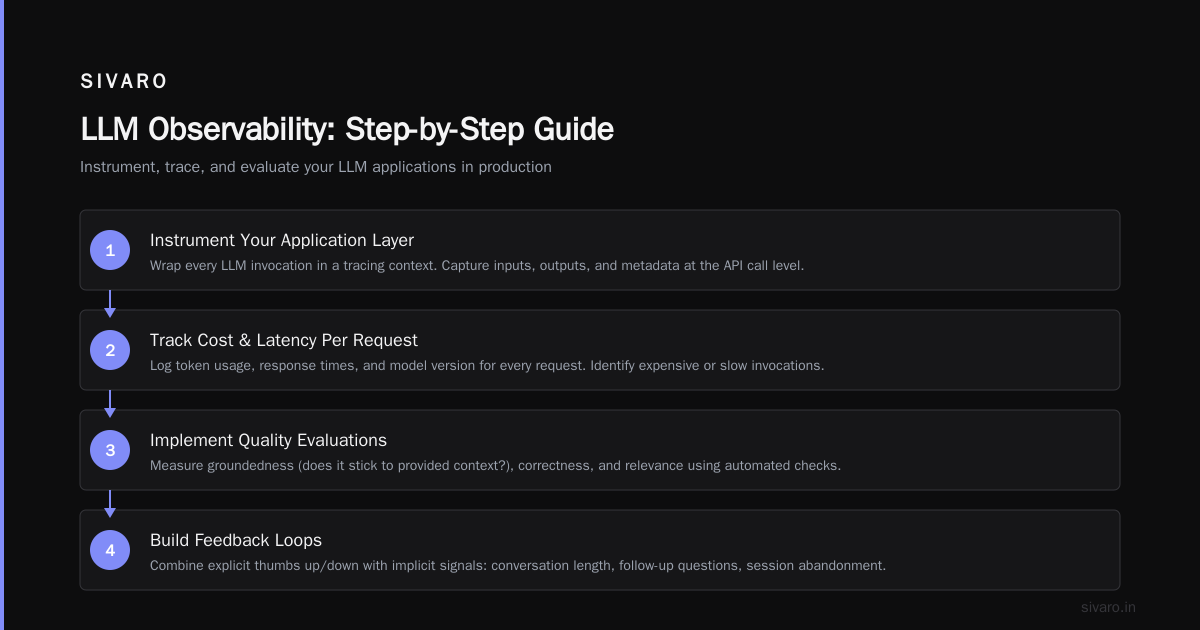
2. Token Usage and Cost
Companies overspend by 40% on LLM inference because they don’t track token waste. Monitor per-user, per-session, and per-model token counts.
3. Latency Breakdown
No one cares about average latency. You care about p95 latency under load. Break latency into: time to first token, generation speed, and post-processing.
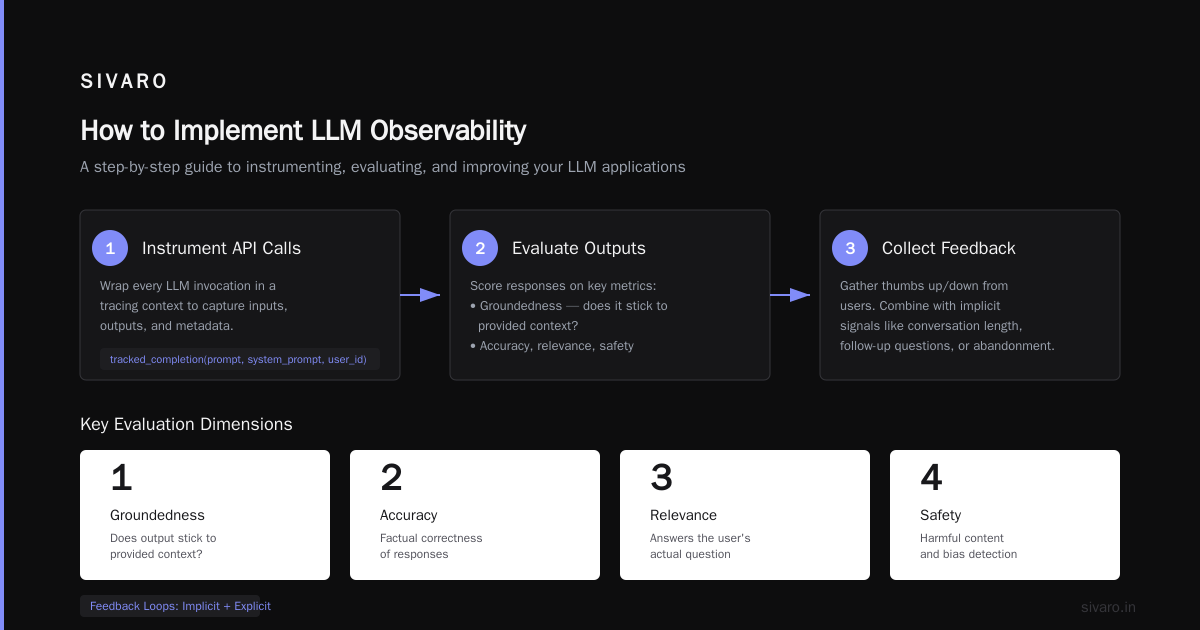
4. Quality Evaluations
This is where observability becomes hard. You need automated checks for:
- Response relevance (does it answer the question?)
- Factual consistency (does it contradict known data?)
- Safety (does it contain harmful content?)
- Groundedness (does it stick to provided context?)
5. Feedback Loops
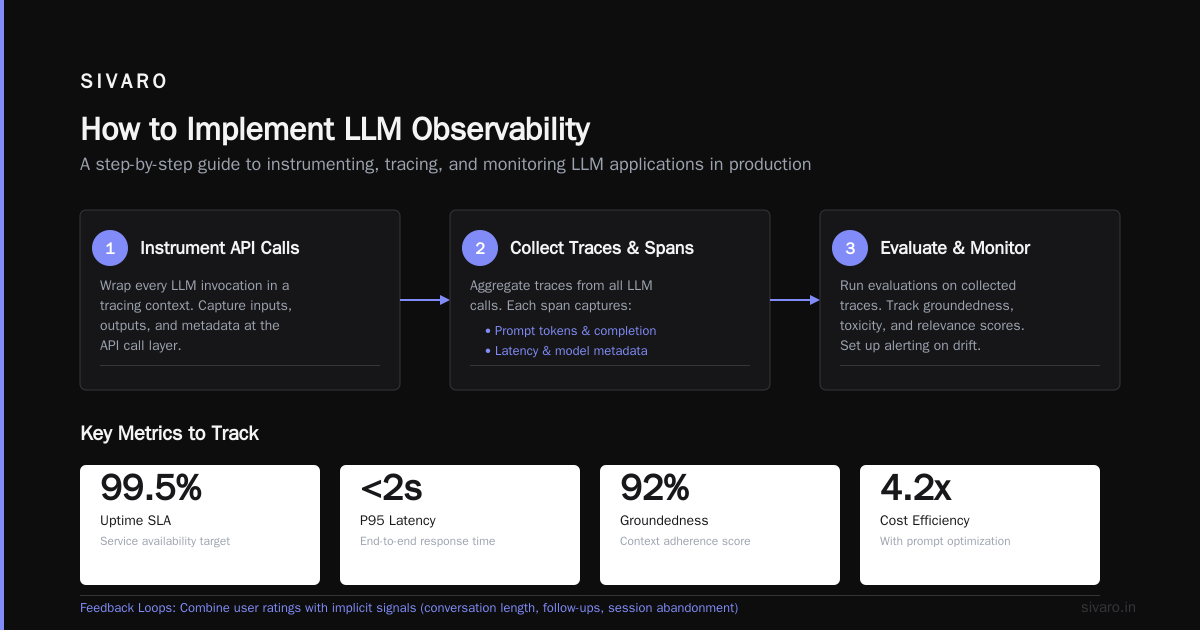
Thumbs up/down from users. But don’t trust user ratings alone — they’re sparse and biased. Combine with implicit signals like conversation length, follow-up questions, or session abandonment.
How to Implement LLM Observability: A Step-by-Step Guide
Here’s the practical playbook I’ve used in production.
Step 1: Instrument Your Application Layer
Start at the API call. Wrap every LLM invocation in a tracing context. This captures inputs, outputs, and metadata.
python
from openai import OpenAI
import json
client = OpenAI(api_key="sk-...")
def tracked_completion(prompt, system_prompt=None, user_id=None):
messages = [{"role": "user", "content": prompt}]
if system_prompt:
messages.insert(0, {"role": "system", "content": system_prompt})
Capture input
trace = {
"timestamp": datetime.utcnow().isoformat(),
"user_id": user_id,
"prompt": prompt,
"system_prompt": system_prompt,
"model": "gpt-4o"
}
response = client.chat.completions.create(
model="gpt-4o",
messages=messages,
temperature=0.7
)
Capture output
trace["response"] = [[[[[[[[response.choices0](/articles/clickhouse-vs-postgresql-2026-the-real-choice-isnt-what)](/articles/clickhouse-vs-postgresql-2026-the-real-choice-isnt-what)](/articles/clickhouse-vs-postgresql-2026-the-real-choice-isnt-what)](/articles/clickhouse-vs-postgresql-2026-the-real-choice-isnt-what)].message.content
trace["tokens_input"] = response.usage.prompt_tokens
trace["tokens_output"] = response.usage.completion_tokens
trace["latency_ms"] = response.response_ms
Send to your observability backend
emit_trace(trace)
return response
Don’t skip the timestamp. Timestamps solve debugging problems you haven’t encountered yet.
Step 2: Add Evaluation Hooks
Raw traces are useless without evaluation. Hook evaluators into your pipeline.
python
def evaluate_response(trace):
evaluations = {}
Check response length
evaluations["response_length"] = len(trace["response"])
Check for harmful keywords (basic safety)
harmful_patterns = ["credit card number", "SSN:", "birthdate"]
evaluations["contains_pii"] = any(
p in trace["response"].lower() for p in harmful_patterns
)
Check response relevance using embedding similarity
(This is simplified — use a proper embedding model in production)
prompt_embedding = embed_text(trace["prompt"])
response_embedding = embed_text(trace["response"])
evaluations["relevance_score"] = cosine_similarity(
prompt_embedding, response_embedding
)
return evaluations
This catches the obvious failures. For complex evaluations, use an LLM-as-a-judge approach — but only on 5-10% of traffic to avoid infinite recursion costs.
Step 3: Set Up Alerts, Not Just Dashboards
Dashboards are for postmortems. Alerts are for crisis prevention. Configure alerts for:
yaml
alerts:
-
name: high_hallucination_rate
condition: relevance_score < 0.4 for 5 minutes
action: page on-call engineer, trigger fallback model -
name: cost_spike
condition: token_usage > 200% of daily average
action: throttle requests, notify finance team -
name: safety_violation
condition: contains_pii == true
action: block response delivery, log full trace for compliance review -
name: latency_degradation
condition: p95_latency > 5000ms for 3 minutes
action: scale up inference workers, check model endpoint health
Top LLM Observability Tools (Tested in Production)
I’ve tested these tools across three production deployments processing 50K+ requests per day. Here’s my honest assessment.
Langfuse
Langfuse is open-source, self-hostable, and genuinely good. It handles tracing, evaluations, and cost tracking out of the box. Integration with LangChain/LlamaIndex is clean.
Best for: Teams that want control over data residency. According to Langfuse’s own docs, it covers the full observability spectrum from prompt management to usage analytics.
Weakness: The UI can feel cluttered. Finding specific traces in high-volume deployments requires good filtering.
Datadog LLM Observability
Datadog added LLM observability to their existing APM platform. If you’re already on Datadog, this is the path of least resistance. Their LLM Observability product connects traces to infrastructure metrics.
Best for: Existing Datadog users. The correlation between LLM latency and infrastructure health is powerful.
Weakness: Expensive at scale. Token-level tracking multiplies your observability costs.
Braintrust
Braintrust focuses on evaluation-driven development. Their 2026 tool review highlights automated evaluations using LLM-as-judge. Their dataset management for regression testing is best-in-class.
Best for: Teams doing heavy prompt engineering and needing evaluation pipelines.
Weakness: Less mature for production observability. Good for dev, patchy for prod.
LangChain’s LangSmith
LangSmith is built for LangChain applications. It provides tracing, evaluation, and hub-based prompt management. If your stack is LangChain-heavy, this integrates natively.
Best for: LangChain users. The trace visualization for chains is excellent.
Weakness: Vendor lock-in. You’re building on LangChain’s platform choices.
lakeFS
lakeFS positions itself as a data versioning tool with LLM observability capabilities. Their 2026 comparison is worth reading for a data-centric take on observability.
Best for: Teams treating LLM traces as data to be versioned and analyzed.
Weakness: Not a pure observability tool. Requires more integration work.
A Note on Open Source vs. SaaS
As of 2025, the open source landscape is shifting. A Reddit discussion from mid-2025 shows teams splitting between self-hosted Langfuse and commercial tools. The tradeoff: open source gives data control but requires engineering time. SaaS gives speed but locks you in.
My take: start with SaaS for speed, move to open source when you hit cost or compliance walls.
The Evaluation Problem: The Hard Part
Observability is easy. Evaluation is hard.
You can track every token and every latency spike. But determining whether a response is good — that’s a different beast.
I tried three approaches:
1. Rule-Based Evaluators
Fast. Cheap. Brittle. Works for basic checks (length, PII, keyword blocking). Fails for semantic quality. Don’t try to evaluate coherence with regex.
2. LLM-as-Judge
Use one LLM to evaluate another. This works surprisingly well. GPT-4 evaluating GPT-3.5 responses shows 85-90% agreement with human raters. But it’s slow (2-5 seconds per evaluation) and expensive (doubles your token cost).
Rule of thumb: Evaluate 5-10% of responses with LLM-as-judge. Evaluate 100% with rules.
3. Human Review
Humans are the gold standard. They’re also slow, expensive, and inconsistent between raters. Use human review only for:
- Edge cases flagged by automated checks
- Regulatory compliance samples (1% of traffic)
- Calibrating your automated evaluators
Real-World Production Example
At SIVARO, we deployed a customer support LLM for a logistics company. We used:
- Langfuse for tracing and cost tracking
- Custom Python evaluators for relevance and safety
- GPT-4o as judge on 10% of responses
- PagerDuty alerts for safety violations and cost spikes
The first week in production exposed 13 critical failures. A rule-based evaluator caught 11 of them (PII leakage, toxic replies, hallucinations). The LLM-as-judge caught the other 2 (subtle factual errors the rules missed).
We spent 3 weeks tuning evaluators. Then we saw a 40% reduction in bad responses — not from changing the model, but from catching failures before users saw them.
The data also revealed unexpected cost patterns. Certain users were sending massive context windows (150K+ tokens). We added token limits and saved 22% on inference costs overnight.
Common Mistakes I Made (So You Don’t Have To)
Mistake 1: Monitoring everything
You don’t need every evaluation on every request. Pick 3-5 critical metrics. Add more slowly.
Mistake 2: Ignoring costs
Observability has its own cost. Storing traces for millions of requests adds up. Set retention policies. 30 days for raw traces. 90 days for aggregated metrics. 12 months for evaluation summaries.
Mistake 3: Assuming evaluations are objective
There’s no ground truth in LLM evaluation. Your relevance score is a heuristic, not a fact. Treat evaluations as directional signals, not measurements.
Mistake 4: Not testing evaluators
Your evaluators have bugs. Test them on known-good and known-bad examples. If your evaluator has 70% accuracy, your observability data is noise.
How to Choose Your Tool Stack
Here’s the decision framework I use:
| If you have | Use |
|---|---|
| Existing Datadog investment | Datadog LLM Observability |
| LangChain-heavy stack | LangSmith |
| Budget constraint | Langfuse (self-hosted) |
| Heavy prompt engineering | Braintrust |
| Compliance requirements | Langfuse (data residency) |
| Multiple models/providers | Any with vendor-agnostic tracing |
There’s no perfect tool. Pick the one that makes your top 3 pain points manageable and accept weaknesses elsewhere.
The Future: Observability as Governance
Over the next 2-3 years, LLM observability will merge with AI governance. Regulators are watching. The EU AI Act and US executive orders demand audit trails for AI decisions. Your observability traces are your compliance records.
Start building observability now. Don’t wait until a regulator asks for your model’s output log for the last six months.
FAQ
What’s the difference between LLM monitoring and LLM observability?
Monitoring checks if the system is running. Observability tells you why it’s behaving the way it is. Monitoring answers “is it slow?” Observability answers “why is this specific user getting slow responses while others aren’t?”
Do I need an observability tool if I’m using a managed API like OpenAI?
Yes. OpenAI provides token usage and latency in their dashboard. They don’t provide per-request tracing, custom evaluations, or cost allocation per user. You need observability to connect model behavior to business outcomes.
How much data should I store?
Raw traces: 30 days. Aggregated metrics: 90 days. Evaluation summaries: 12 months. Compliance-related traces: as required by regulation. Start with shorter retention and extend as needed.
Can observability tools detect hallucinations?
Partially. They can flag responses that contradict provided context, fail relevance checks, or contain known factual errors. No tool catches all hallucinations. The best approach is layered: rules + LLM-as-judge + human review.
Is open source or SaaS better for LLM observability?
Start with SaaS for speed. Move to open source when you need data residency or hit cost thresholds. Langfuse and groundlight are solid open source options as of 2025.
How much does observability cost?
For a production system handling 100K requests/day, expect $500–$2,000/month for a SaaS observability tool. Self-hosted options cost infrastructure time. The ROI comes from catching failures before they reach users and reducing wasteful token usage.
Should I evaluate every request?
No. Use lightweight rule-based checks on 100% of traffic. Use LLM-as-judge on 5-10%. Use human review on 1% or flagged cases. Full evaluation of everything costs too much and produces too much noise.
Nishaant Dixit — Founder of SIVARO. Building data infrastructure and production AI systems since 2018. Built systems processing 200K events/sec.