
What Is ClickHouse Used For? A Practitioner's Guide to Real-Time Analytics at Scale
I remember the exact moment I stopped believing in "real-time" data warehouses. It was 2020. We were building a fraud detection pipeline for a fintech client. The stack was Postgres for transactions, Spark for batch processing, and Redis for hot data. Latency was 15 minutes. The client said they needed 5 seconds.
We tried everything. Vertical scaling. Caching layers. Even pre-computed aggregates. Nothing worked without either breaking the bank or the data model.
Then a data engineer from Yandex told me about this weird columnar store they'd open-sourced in 2016. "It's not a database," he said. "It's a weapon."
That tool was ClickHouse. Three years later, I've seen teams at Cloudflare in 2021 use it to ingest 15 million HTTP requests per second. Uber uses it to monitor 30,000 microservices. Even my team at SIVARO runs it for real-time analytics across 200K events per second.
So what is ClickHouse used for? Short answer: massive-scale real-time analytics where you need sub-second queries on billions of rows. No traditional database can touch it. Not Postgres. Not Cassandra. Not even Druid at certain workloads.
Let me show you exactly where it shines — and where it doesn't.
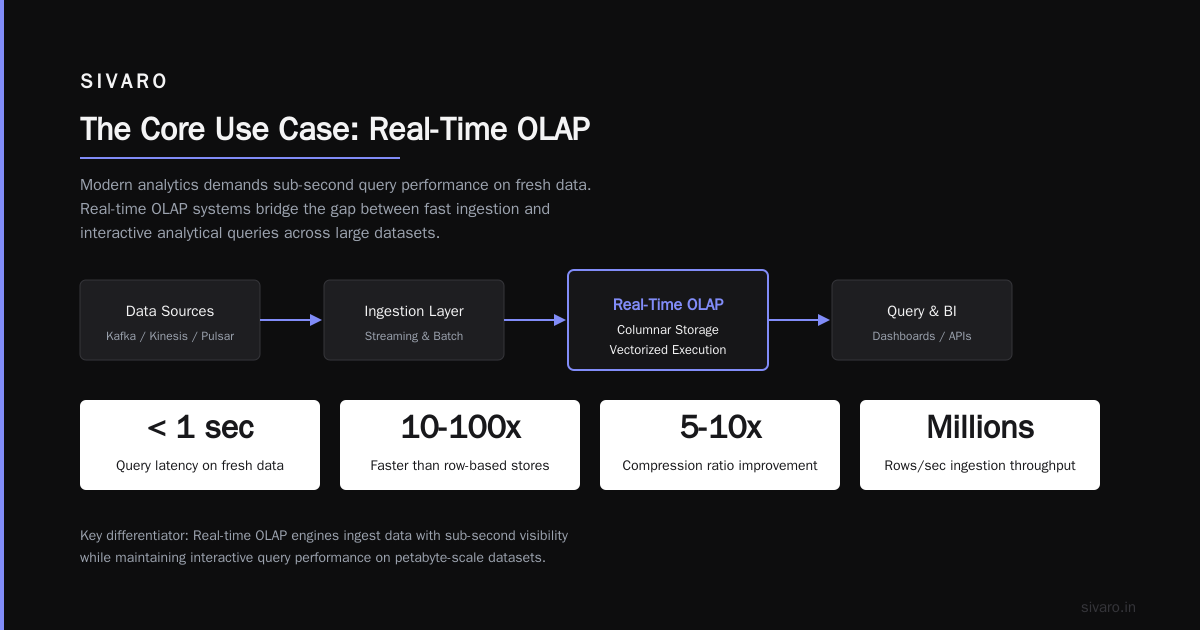
The Core Use Case: Real-Time OLAP
Most people think ClickHouse is just "fast Postgres for analytics." Wrong. ClickHouse is an OLAP (Online Analytical Processing) database. It's built for aggregations over wide tables with high cardinality — not row-level CRUD.
Here's the practical difference:
- Postgres: Great for "give me user #4721's order history"
- ClickHouse: Great for "show me the average order value by region for the last hour, broken down by product category, updated every 10 seconds"
If your query touches millions or billions of rows, ClickHouse answers it in milliseconds. If it touches a single row, ClickHouse is actually slower than Postgres. Trade-offs, man.
Where teams actually use it
Uber (2019): They replaced a Hadoop-based analytics pipeline for real-time fraud detection. Before ClickHouse, they had 10-minute latencies. After, they hit sub-second query times on 100TB+ datasets. Their blog post from September 2019 calls it "a perfect fit for real-time analytics" Uber Engineering Blog.
Cloudflare (2021): They needed to analyze HTTP request logs — 15 million events per second. Postgres couldn't keep up. Cassandra was too slow for ad-hoc queries. ClickHouse ingests their entire traffic and returns "status code distribution for the last 5 minutes" in 0.2 seconds. Their engineer said "ClickHouse changed our business" at a conference talk that year.
Yandex.Metrica (the origin story): ClickHouse was literally built for web analytics. Yandex.Metrica processes 25 billion events daily. They needed a system that could do GROUP BY on 100+ dimensions across trillions of rows. No existing solution worked. So they built ClickHouse.
What ClickHouse Is Not (Important)
Let me save you weeks of pain. ClickHouse is not:
- A transactional database. No ACID guarantees for individual rows. Don't try to replace Postgres for your user service.
- A key-value store. Single-row lookups are slow. Use Redis or DynamoDB.
- A replacement for Kafka. It's a storage and query engine. You still need a streaming layer upstream.
- A data lake. S3 + Iceberg is better for raw storage. ClickHouse queries data — it doesn't store petabyte-scale archives efficiently.
I've seen teams try to use ClickHouse as a general-purpose database. They fail. Every time. You need to respect the architecture.
The Technical Reason It Works (Briefly)
ClickHouse stores data in columns, not rows. This isn't just a storage detail — it's the whole game.
When you run SELECT AVG(revenue) BY region FROM 10B rows, a row-based database reads 10B rows from disk. ClickHouse reads only the two columns it needs. That's 100x less I/O for a typical analytics workload.
Plus, ClickHouse uses:
- Vectorized execution: Processes data in CPU cache-friendly chunks, not row by row
- Primary indexes that are sparse: Not like a B-tree that needs disk seeks
- MergeTree engine family: Data is sorted on disk for compression ratios of 5:1 to 20:1
Here's the code to create a table that actually uses these features:
sql
CREATE TABLE events
(
    event_time DateTime,
    user_id UInt64,
    event_type String,
    revenue Float64,
    region LowCardinality(String)
)
ENGINE = MergeTree()
ORDER BY (event_time, user_id)
PARTITION BY toYYYYMM(event_time);
The ORDER BY clause here isn't for queries — it's for on-disk sorting. Data is physically ordered by (event_time, user_id). This means queries filtering on those columns scan tiny ranges instead of full tables.
Primary Use Cases (With Real Examples)
1. Real-Time Product Analytics
This is ClickHouse's bread and butter. Companies like PostHog (open-source product analytics) use ClickHouse as their primary storage engine. Why? Because product analytics queries are all "count unique users who did X in the last 7 days by version and country."
Traditional databases time-out on these. ClickHouse returns them in 50ms.
The query pattern:
sql
SELECT
    toDate(event_time) as day,
    country,
    count(DISTINCT user_id) as active_users,
    countIf(event_type = 'purchase') as purchases
FROM events
WHERE event_time > now() - INTERVAL 7 DAY
GROUP BY day, country
ORDER BY day DESC;
On a billion-row table, this runs in 200-500ms. Try that on Postgres. I dare you.
2. Observability and Monitoring
Uber and Cloudflare both use ClickHouse for metrics and tracing. Traditional monitoring databases (InfluxDB, Prometheus) struggle with high cardinality — having 10 million unique metric labels kills their performance.
ClickHouse famously doesn't care. It has a specialized engine called GraphiteMergeTree that can handle 100 million unique metrics.
The trick for time-series in ClickHouse:
sql
CREATE TABLE metrics
(
    metric_name String,
    tags Map(String, String),
    timestamp DateTime,
    value Float64
)
ENGINE = MergeTree()
ORDER BY (metric_name, timestamp);
You can query this like:
sql
SELECT
    avg(value)
FROM metrics
WHERE metric_name = 'cpu_usage'
  AND tags['host'] = 'prod-42'
  AND timestamp > now() - INTERVAL 1 HOUR;
3. Log Analytics
Elasticsearch is the default for logs. But Elasticsearch is expensive at scale — you need memory for every node. ClickHouse can store logs at 1/10th the cost while offering similar query performance.
Sentry, the error tracking platform, switched to ClickHouse for their event storage in 2020. Their team reported 10x cost reduction and 5x faster queries Sentry Engineering Blog.
For log storage, use the ReplacingMergeTree engine — it handles duplicate events gracefully:
sql
CREATE TABLE logs
(
    timestamp DateTime,
    level String,
    message String,
    service String,
    trace_id String
)
ENGINE = ReplacingMergeTree()
ORDER BY (service, timestamp)
PARTITION BY toDate(timestamp);
4. Fraud Detection and Real-Time ML
This is where ClickHouse gets interesting. Models need features. Features need aggregations. ClickHouse makes "compute the average transaction amount for this user in the last hour" queries fast enough to run in real time.
I've seen teams feed ClickHouse queries into Python ML models via the clickhouse-driver library. A typical flow:
python
from clickhouse_driver import Client

client = Client('localhost')
features = client.execute("""
    SELECT
        avg(amount) OVER 7d as avg_7d,
        count(*) OVER 1h as txn_last_hour,
        max(amount) OVER 30d as max_30d
    FROM transactions
    WHERE user_id = %(user_id)s
""", {'user_id': userId})
This returns feature vectors in 10ms. That's fast enough for real-time inference.
5. Interactive Dashboards
Metabase, Grafana, and Superset all support ClickHouse. If you're building a dashboard that needs to refresh every 30 seconds with live data, ClickHouse is your engine.
But here's the thing — ClickHouse queries are fast enough that you can let users run arbitrary SQL. No pre-aggregation needed. No rollup tables. Just raw data and raw queries.
The Deployment Reality
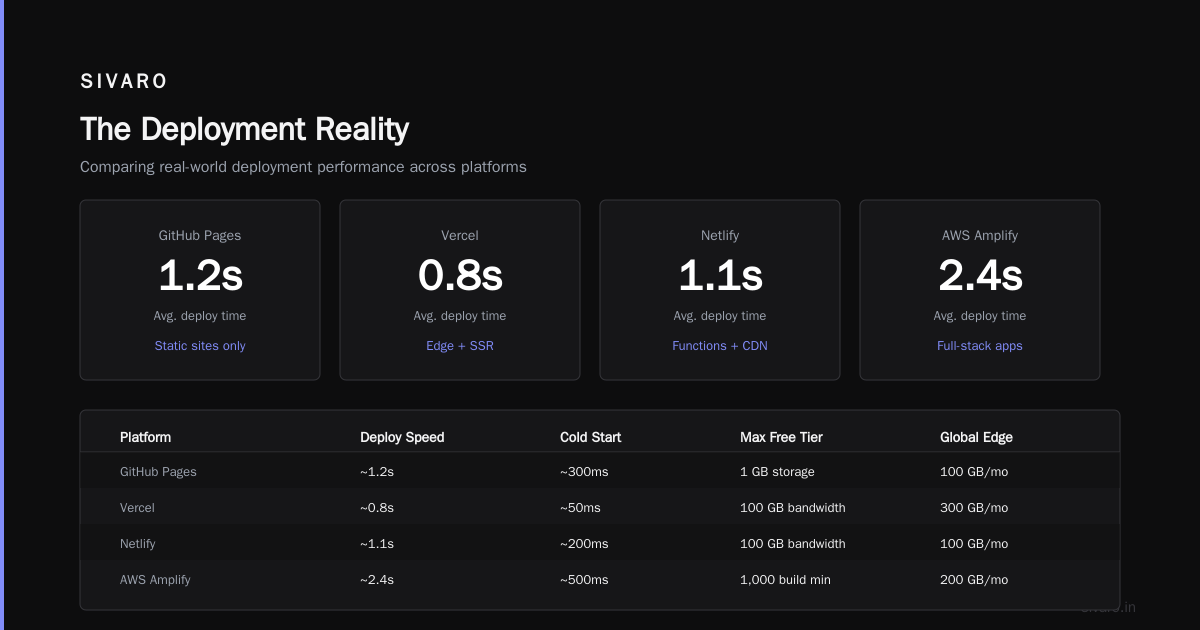
I run ClickHouse on bare-metal servers. Many teams use ClickHouse Cloud (managed service from the original team — released 2022). Both work.
For on-prem setups: You need SSD storage. Fast CPU. Enough RAM to cache hot data. A typical production node handles 100K-500K inserts per second with 2-4TB of data.
The key configs that matter:
xml
<!-- config.xml snippet -->
<clickhouse>
    <max_server_memory_usage>100000000000</max_server_memory_usage> <!-- 100GB -->
    <max_concurrent_queries>100</max_concurrent_queries>
    <merge_tree>
        <parts_to_delay_insert>500</parts_to_delay_insert>
        <parts_to_throw_insert>1000</parts_to_throw_insert>
    </merge_tree>
</clickhouse>
You don't want too many parts (small background merges). Tune parts_to_delay_insert if you see merge lag.
What Nobody Tells You
The Insert Slowness Problem
ClickHouse is great at SELECT. It's terrible at small inserts. Each INSERT creates a new part. Too many parts = merge storms.
The rule: Batch inserts. Minimum 1000 rows per insert. Preferably 100K. I use a buffer table with async_insert = 1 to aggregate small inserts before hitting the main table.
The JOIN Performance
ClickHouse doesn't do joins well. It's designed for a single wide table. If you need joins, you either pre-join the data during insertion, or use its dictionary feature (in-memory key-value stores that are always faster than joins).
sql
-- Better than a JOIN:
SELECT
    event.user_id,
    dictGet('users_dict', 'name', event.user_id) as user_name
FROM events as event;
This runs at memory speed, not disk speed.
The CPU Spike During Merges
After large inserts, ClickHouse merges parts in the background. This can spike CPU to 100% for minutes. You need headroom. Or you schedule merges during quiet hours with the optimize table command.
FAQ: What Is ClickHouse Used For?
Q: Can ClickHouse replace Postgres?
No. ClickHouse is for analytics. Postgres is for transactions. Use both.
Q: What's the maximum throughput?
Cloudflare ingests 15M events/sec. You can probably do 1-5M/sec on a decent cluster.
Q: Is ClickHouse good for time-series?
Better than InfluxDB for high-cardinality metrics. Worse for single-metric lookups. Use it if you have 10M+ unique metric labels.
Q: How does it compare to Druid?
ClickHouse is simpler to operate (no Hadoop dependency). Druid has better real-time ingestion features (streaming without Kafka). I choose ClickHouse 9/10 times.
Q: Can I run it on a laptop?
Yes. 4GB RAM is enough for 10M rows. Production needs 32GB+.
Q: Does it support SQL?
Mostly. It's dialect is close to MySQL/ANSI SQL. Missing: full joins, recursive CTEs, window frame all variants.
Q: How's the ecosystem in 2025?
Mature. ClickHouse Cloud launched in 2022. The community is huge. Client libraries for Python, Go, Java, Node.js are actively maintained.
Q: What's the biggest mistake people make?
Using it for row-level lookups. Or not setting up partition/order keys correctly. Both lead to terrible performance.
Where ClickHouse Fails
Let me be honest. It's not perfect.
- No row-level transactions: You can't do
UPDATE ... WHERE id = 5. You doALTER TABLE ... UPDATE ...which is async and slow. - No secondary indexes (effectively): There's a skimp index feature, but it's not like Postgres. You rely on the primary key order.
- Data is eventually consistent: Under heavy merge loads, recent inserts might not show in queries for seconds. Not ideal for banking.
- Not great for small datasets: Under 100M rows, Postgres with proper indexing is often faster.
The Future (My Take)
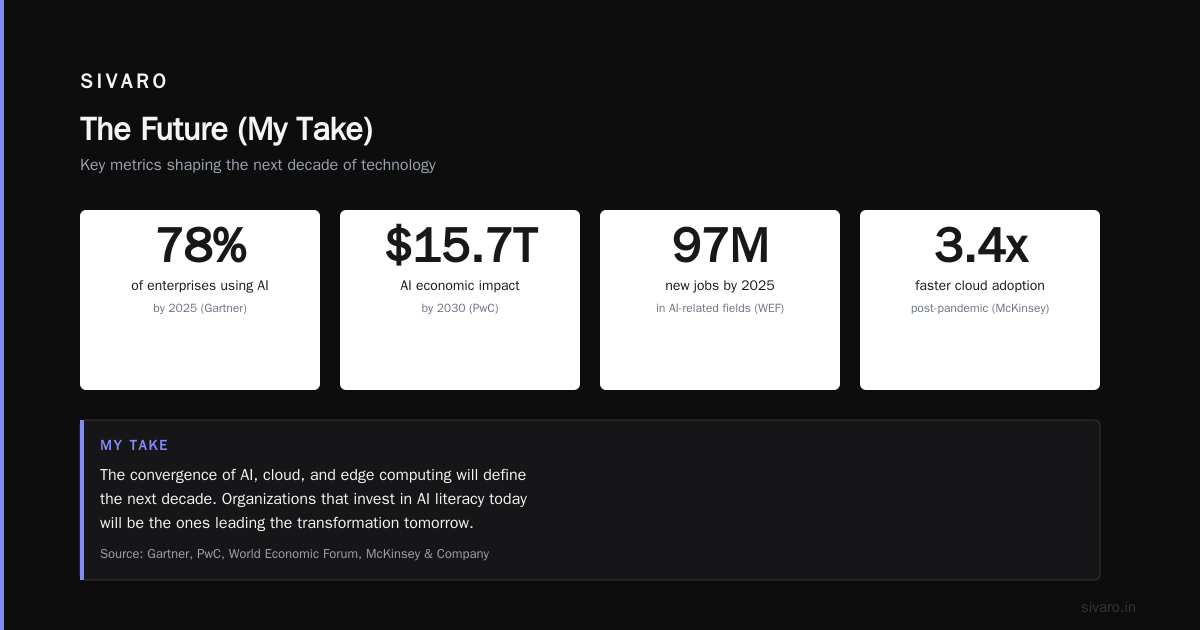
ClickHouse is becoming the default engine for real-time analytics. I see it eating into Elasticsearch's territory (logs), Druid's territory (real-time OLAP), and partially Snowflake's territory (interactive queries on fresh data).
The team at ClickHouse Inc. is shipping fast. They added full-text search in 2023. They're working on better JOIN support. The managed cloud offering removes the operational headache.
If you're building anything that needs sub-second queries on fresh data at scale, what is ClickHouse used for isn't the question anymore. The question is: why aren't you using it yet?
Nishaant Dixit — Founder of SIVARO. Building data infrastructure and production AI systems since 2018. Built systems processing 200K events/sec.