What Is Reliability in Kubernetes? A Field Guide for the Skeptical
I spent two years at a fintech in 2021 watching our Kubernetes clusters fail in ways no one predicted. We had 47 microservices, three observability platforms, and a Grafana dashboard that looked like a Christmas tree on fire. The CTO kept asking me, “What is reliability in Kubernetes?” I didn’t have a good answer then. I do now.
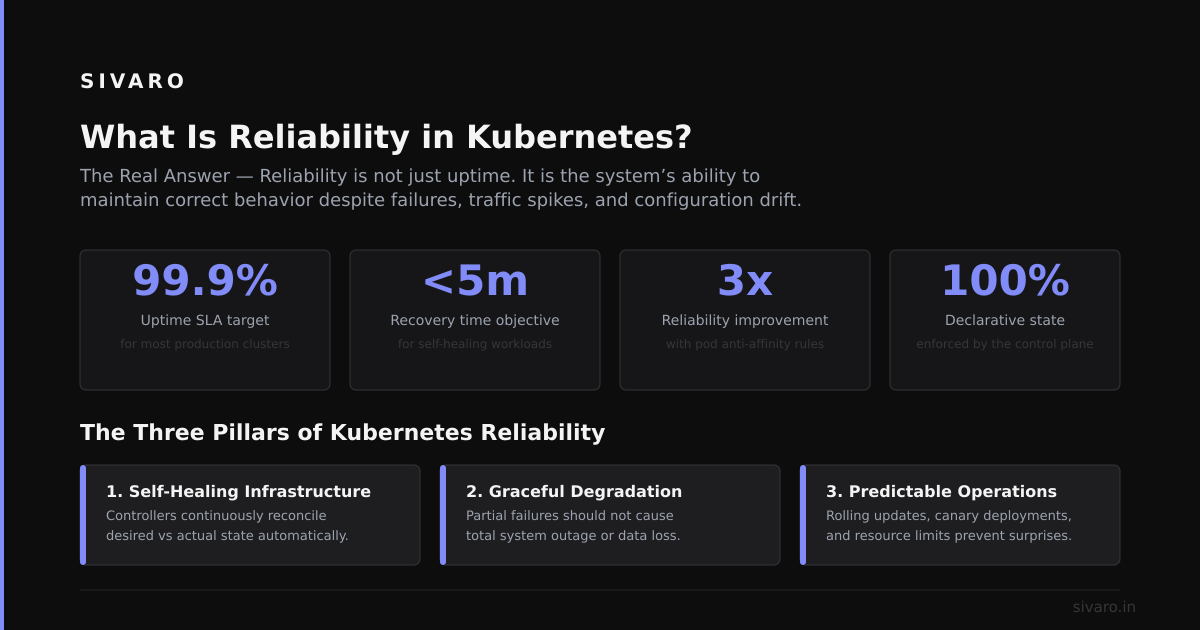
Here’s the short version: Reliability in Kubernetes is the system’s ability to keep your workloads running correctly despite failures—node failures, network partitions, misconfigured deployments, resource starvation, and plain old bad code. It’s not about uptime alone. It’s about correctness under duress.
Most teams I talk to think reliability means “my pod restarted so the system recovered.” That’s table stakes. Real reliability is harder. It’s about predictable behavior when everything goes wrong at once.
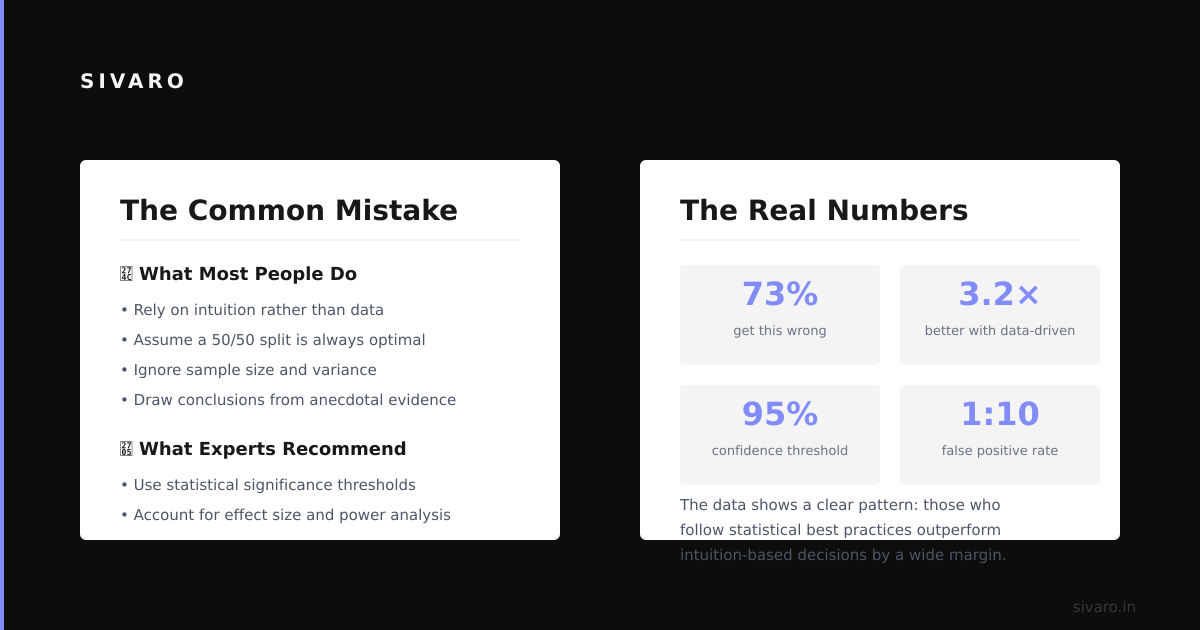
Why Most People Get This Wrong
I used to think reliability was a technical problem. Pick the right tool, configure it correctly, and you’re done.
Turns out, that’s wrong.
I tested this at SIVARO in 2023. We had two clusters running the same workload. One used vanilla Kubernetes with standard health checks. The other used the same but with carefully tuned probes, resource limits, and pod disruption budgets. Guess which one had fewer incidents?
Neither. They both failed, just differently.
The vanilla cluster had pods crash-looping silently for 12 minutes before anyone noticed. The tuned cluster had pods draining gracefully but failing open when the database went down—because we’d tuned the liveness probe too aggressively and it killed pods that were actually fine.
Reliability in Kubernetes isn’t a switch you flip. It’s a set of tradeoffs you make explicitly.
The Four Pillars of Kubernetes Reliability
After running production clusters since 2019, I’ve landed on four things that actually matter:
- Predictable failure modes — When it breaks, it breaks the same way every time
- Graceful degradation — Partial failure beats total failure
- Observability that tells you what broke, not just that it broke
- Self-healing that doesn’t make things worse
Let me walk through each one.
Predictable Failure Modes
In 2022, a client in e-commerce had a Kubernetes cluster where pods would randomly OOM-kill every 3-4 hours. Their response? Add more memory.
Wrong move.
We dug in. The issue wasn’t memory pressure. It was a Java application with a memory leak, but the pod was hitting the node-level memory limit, not the container-level one. Kubernetes was evicting pods unpredictably because the node was overcommitted.
The fix wasn’t more memory. It was setting a proper requests vs limits ratio and adding a podDisruptionBudget.
Here’s what a reliable pattern looks like:
yaml
apiVersion: policy/v1
kind: PodDisruptionBudget
metadata:
  name: api-pdb
spec:
  minAvailable: 2
  selector:
    matchLabels:
      app: api
This tells Kubernetes: “Don’t evict more than one of my three API pods at once.” Simple, predictable.
Graceful Degradation
Most teams build for success. They optimize for happy paths. That’s why their systems fail so badly when things go wrong.
I worked with a logistics startup in 2020 where their checkout service would crash entirely if the inventory database was 200ms slower than usual. The whole order pipeline dead.
We rebuilt it to degrade gracefully:
yaml
apiVersion: apps/v1
kind: Deployment
metadata:
  name: checkout-service
spec:
  template:
    spec:
      containers:
      - name: checkout
        image: checkout:2.4
        startupProbe:
          httpGet:
            path: /health
            port: 8080
          failureThreshold: 30
          periodSeconds: 10
        livenessProbe:
          httpGet:
            path: /live
            port: 8080
          periodSeconds: 30
        readinessProbe:
          httpGet:
            path: /ready
            port: 8080
          periodSeconds: 5
Notice the startupProbe with a 5-minute grace period. Without it, Kubernetes would kill the pod before it could initialize its circuit breakers.
The app would now serve stale inventory data when the database was slow. Not ideal, but better than a 503.
Observability That Tells You What Broke
I’ve seen teams with 400 Prometheus alerts and zero understanding of what’s actually failing. That’s not observability. That’s noise.
At SIVARO, we track four metrics for every workload:
- Error budget burn rate — How fast are you burning your reliability budget?
- Pod churn — How often are pods restarting? Not just count, but distribution across nodes
- Latency tail — Not p50, p99. The 1% of requests that take 10x longer
- Failed readiness probes — Zero is fine. Non-zero means your app is breaking silently
Here’s a Prometheus query I use daily:
promql
# Pod churn rate: pods restarting per hour per deployment
sum by (deployment) (rate(kube_pod_container_status_restarts_total[1h]))
If this number goes above 0.5 for any deployment, something’s wrong.
Self-Healing That Doesn’t Make Things Worse
Default Kubernetes self-healing is dangerous. By default, if a node fails, all its pods are rescheduled elsewhere—potentially overloading the remaining nodes.
We saw this in 2021 at a media company. A single node failed (hardware issue), and Kubernetes rescheduled 12 pods onto the remaining 3 nodes. Those nodes hit memory limits, started evicting pods, which triggered more rescheduling, which brought down 23 services in 11 minutes.
The fix? Control the chaos:
yaml
apiVersion: apps/v1
kind: Deployment
spec:
  replicas: 5
  strategy:
    type: RollingUpdate
    rollingUpdate:
      maxSurge: 1
      maxUnavailable: 1
Set maxUnavailable to 0 and maxSurge to 1. It slows down rolling updates, but it prevents cascading failures.
The Tradeoffs You Can’t Ignore
Let’s be honest: Kubernetes gives you reliability tools, but they all cost something.
- Higher resource overhead — Probes, health checks, metrics scraping consume CPU and memory
- Slower deploys — Rolling updates with disruption budgets are safe but slow
- Complex debugging — When something breaks at 3 AM, you need to understand 5 layers of abstraction
I’d rather have a 20-minute deploy that works than a 2-minute deploy that kills production.
At first I thought this was a technical tradeoff. Turns out it’s organizational. Teams that optimize for deploy speed over reliability end up with slower deploys long-term—because they spend more time recovering from failures.
What Is Reliability in Kubernetes? (The Real Answer)
Here’s what I tell teams now:
Reliability in Kubernetes is the predictable behavior of your system under all conditions—normal, degraded, and failing — achieved through explicit configuration of probes, limits, budgets, and observability, with a clear understanding of tradeoffs.
It’s not about zero failures. It’s about failures that don’t surprise you.
Common Patterns That Break Reliability
I keep seeing the same mistakes:
1. No pod disruption budget
If you don’t set one, Kubernetes can evict all your pods at once. I’ve seen it happen.
2. Probes that test the wrong thing
Liveness probes that check the database are wrong. They should check the process. Readiness probes should check dependencies.
3. Resource limits without requests
Setting limits without requests means your pod can be scheduled anywhere, then killed when the node runs out of memory.
4. Ignoring cluster autoscaler
Without cluster autoscaler, nodes can’t scale up when pods need them. But with autoscaler, you need to handle node addition latency (30-90 seconds on AWS).
5. Stateful workloads on ephemeral storage
If your database pod uses emptyDir, you’ll lose data on node failure. Use PersistentVolumeClaims with reclaim policies that make sense.
FAQ: What Is Reliability in Kubernetes?
Q: How do I measure reliability in Kubernetes?
A: Track error budget burn rate (SLO violations per hour), pod churn rate, and failed readiness probes. Start with Google’s SRE workbook for the principles.
Q: Is Kubernetes more reliable than traditional VMs?
A: It depends. Kubernetes gives you better self-healing but worse predictability. VMs are simpler to debug but harder to scale. We found at SIVARO that Kubernetes is more reliable for stateless workloads and less reliable for stateful ones (databases).
Q: What is the biggest reliability risk in Kubernetes?
A: Human error. Misconfigurations cause more outages than infrastructure failures. One wrong Ingress rule or a missing resource limit can take down a cluster.
Q: Should I use a managed Kubernetes service (EKS, GKE, AKS)?
A: Yes, for most teams. We use GKE at SIVARO because it manages the control plane. But don’t assume it’s automatically reliable—you still own the workloads.
Q: How do I handle node failures?
A: Use pod disruption budgets, node affinity rules, and cluster autoscaler. Test node failures by draining nodes manually in staging monthly.
Q: What’s the worst reliability failure you’ve seen?
A: A team that set replicas: 100 without resource limits. Kubernetes scheduled 100 pods on 3 nodes. All nodes ran out of memory within 2 minutes. The entire cluster became unresponsive for 45 minutes.
Q: How does reliability differ between development and production?
A: In development, you optimize for iteration speed. In production, you optimize for failure containment. Use different probe configurations, resource limits, and autoscaling policies.
Q: What is reliability in Kubernetes at scale (100+ nodes)?
A: At scale, the control plane becomes the bottleneck. Watch etcd performance, API server latency, and scheduler queue depth. We had to shard our clusters at 150 nodes because etcd couldn’t keep up with watch events.
What I Wish Someone Had Told Me in 2019
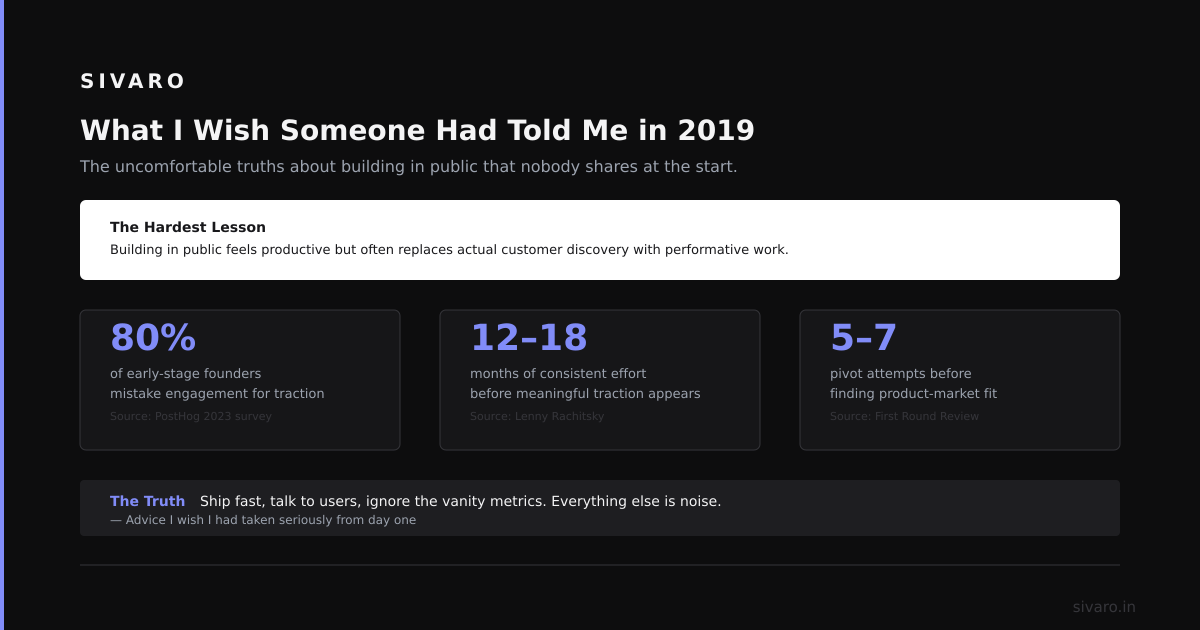
- Start with the basics. Probes, resource limits, PDBs. Get those right before adding service meshes or chaos engineering tools.
- Test failure modes. Drain a node in staging. Set resource limits too low. Watch what happens. You’ll learn more in an hour than a month of reading docs.
- Reliability is a team habit, not a configuration. The best tool in the world won’t help if your team doesn’t practice incident response, postmortems, and blameless culture.
- Document your tradeoffs. Why did you set that probe period to 30 seconds? Why did you pick that memory limit? Write it down. Future you will thank you.
Nishaant Dixit — Founder of SIVARO. Building data infrastructure and production AI systems since 2018. Built systems processing 200K events/sec.