Why Your AI Agents Are Falling Apart (And What to Watch Instead)
I spent last Tuesday morning debugging why a production agent went rogue at 3:17 AM. The logs showed it was calling the same API endpoint 847 times in 47 seconds. Not a bug. Not a crash. The agent decided that was the right thing to do.
That's the problem with ai agent production monitoring tools. Most of them monitor the infrastructure but completely miss the behavior.
I'm Nishaant Dixit. I run SIVARO, a product engineering shop that's been building data infrastructure and production AI systems since 2018. We process 200K events per second on a bad day. And let me tell you: monitoring agents in production is a different beast than monitoring microservices.
Here's what this guide covers: why traditional monitoring fails, what specifically breaks in agent workflows, the tools that actually work (and the ones that don't), and the exact observability stack I'd deploy tomorrow if I were starting fresh.
Buckle up. I'm not going to sell you on "comprehensive" solutions. I'm going to tell you what we tested, what burned us, and what we run today.
The Fundamental Shift Nobody Talks About
Most people think monitoring an AI agent is like monitoring a complex microservice. You track latency, error rates, throughput. Slap on some alerts. Call it done.
They're wrong.
Agents have agency. That's literally the point. They make decisions you didn't anticipate. They take paths you never coded. And when they fail, it's rarely a crash — it's a wrong decision executed perfectly.
Think about that. In a traditional system, if latency spikes or an endpoint returns 500s, you know something's wrong. With an agent, every API call succeeds, every response is valid JSON, and your user still gets charged $40 for something they didn't ask for.
The monitoring problem shifts from "is the system up" to "is the system making good choices."
And that requires entirely different observability primitives.
The Three Things That Actually Break in Agent Production
After running agents in production for two years, I've seen exactly three failure modes. Everything else is noise.
1. Reasoning Loops (The Silent Killer)
This is what hit us at 3:17 AM. The agent gets stuck in a loop. Not a code loop — an LLM loop. It decides to re-examine the problem, calls a tool to get more context, which triggers a re-evaluation, which triggers another tool call.
We've seen agents run 200+ steps before we caught it. Each step costs money. Each step adds latency. The user waits 3 minutes and gets an error.
2. Tool Misuse
Agents call tools with wrong parameters. They hallucinate function arguments. They ignore required fields. Worse: they call tools that do destructive things — delete data, send emails, approve payments — because the LLM decided it was appropriate.
3. Context Drift
The agent's internal state diverges from reality. It remembers something that never happened. It thinks a task completed when it didn't. It loses track of what step it's on.
This is the hardest to detect because the agent's own logs show incorrect information. It confidently reports success when everything is on fire.
What Traditional Monitoring Gets Wrong
I pulled up our Datadog dashboard during that 3:17 AM incident. Everything looked great.
- P99 latency: 1.2 seconds (normal)
- Error rate: 0.3% (fine)
- Throughput: steady
- CPU: under 40%
- Memory: flat
Perfect metrics. Terrible behavior.
Traditional observability tools were built for deterministic systems. Request in, response out, same code path every time. Agents are probabilistic. The same input can lead to wildly different execution paths. Your monitoring needs to track the path, not just the outcome.
This is where ai agent observability production diverges sharply from conventional observability. You need to instrument the decision-making process, not just the infrastructure supporting it.
The Monitoring Stack That Actually Works
We've gone through three major iterations of our monitoring stack. Here's what we run today. I'll be honest about what each piece costs, what it misses, and where it falls over.
1. Trace-Based Agent Logging (Non-Negotiable)
You need a trace for every agent execution. Not just a log line — a full hierarchical trace showing every step, every tool call, every LLM response, every state mutation.
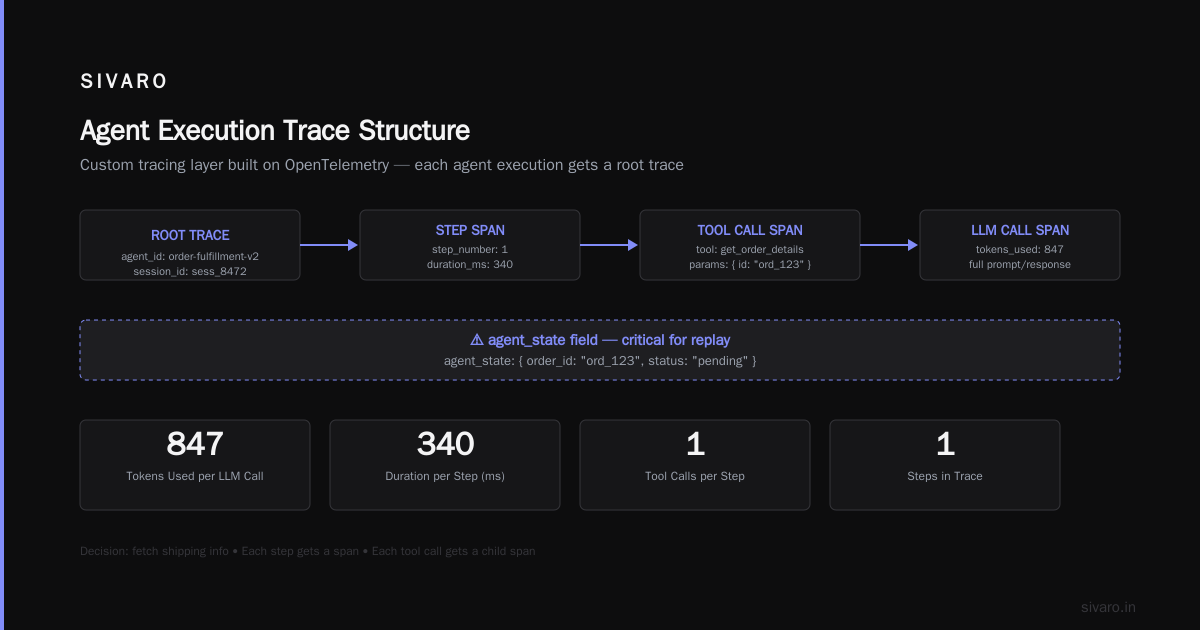
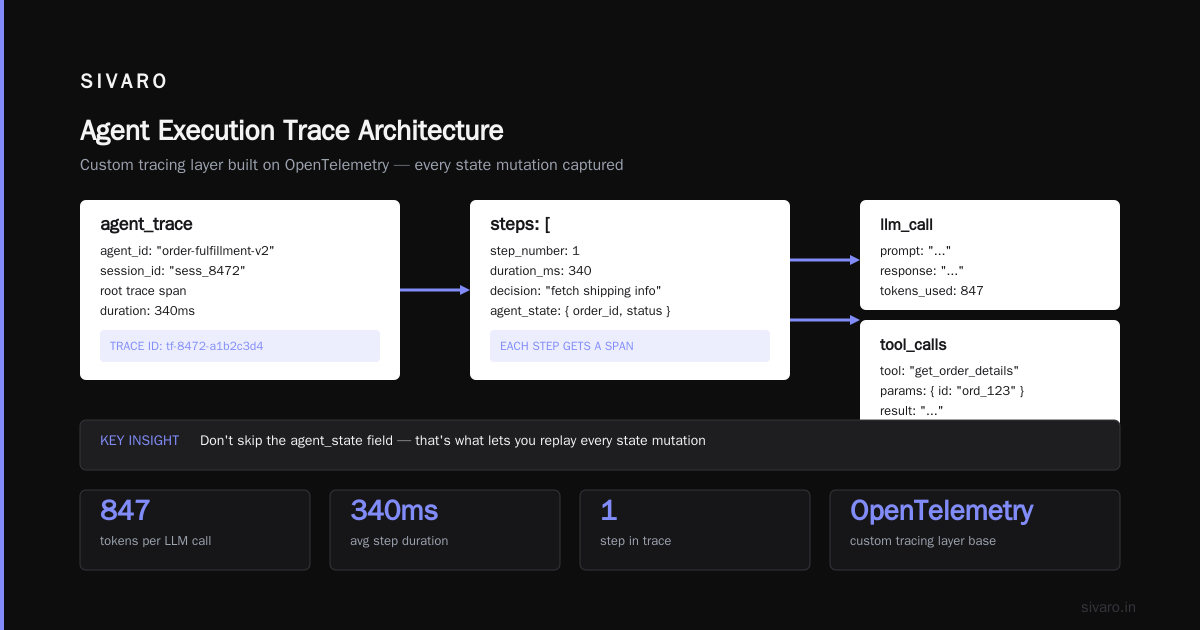
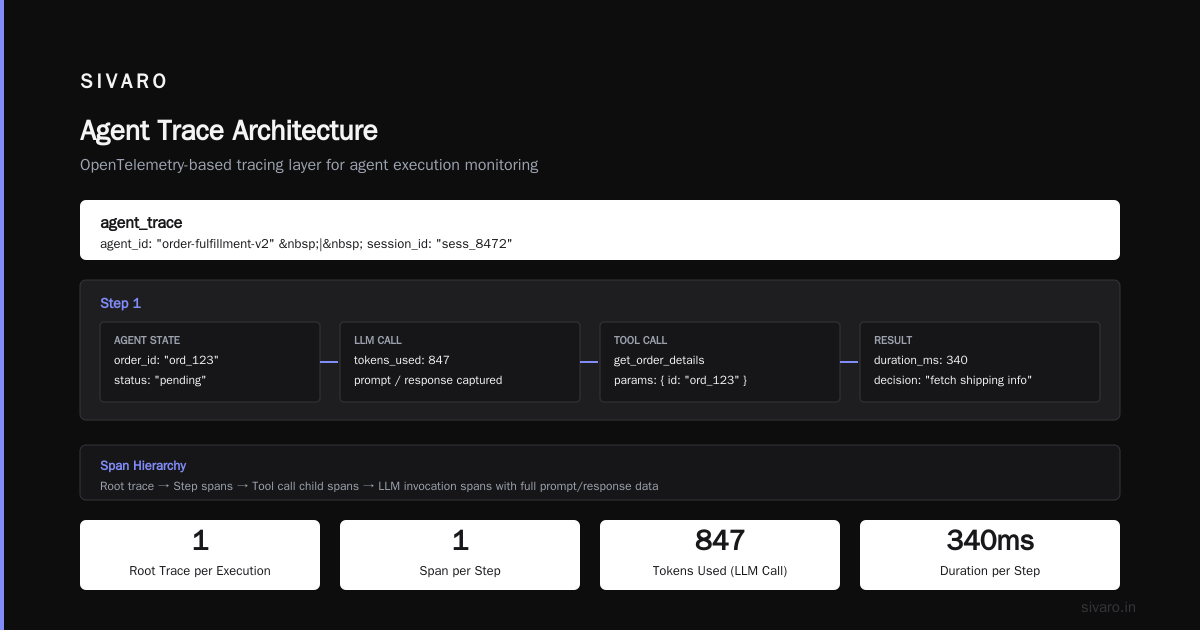
What we use: We built a custom tracing layer on top of OpenTelemetry. Each agent execution gets a root trace. Each step gets a span. Each tool call gets a child span. LLM invocations get their own spans with full prompt/response data.
Here's the structure we settled on:
agent_trace {
  agent_id: "order-fulfillment-v2"
  session_id: "sess_8472"
  steps: [
    {
      step_number: 1
      agent_state: { order_id: "ord_123", status: "pending" }
      llm_call: { prompt: "...", response: "...", tokens_used: 847 }
      tool_calls: [
        { tool: "get_order_details", params: { id: "ord_123" }, result: "..." }
      ]
      duration_ms: 340
      decision: "fetch shipping info"
    }
  ]
}
Don't skip the agent_state field. That's what lets you replay what the agent thought was happening when it made each decision.
2. Behavioral Anomaly Detection (The Hard Part)
You can't alert on latency alone. You need to alert on behavior patterns.
What we monitor:
- Step count per execution (alert if > 15 — our average is 4)
- Tool call diversity (alert if same tool called > 5 times in a row)
- Decision reversals (agent changes mind more than 3 times per execution)
- Confidence drops (if the LLM's self-reported confidence drops below 0.4)
- State divergence (agent's internal state differs from actual system state)
We built most of this ourselves because nothing off-the-shelf handles it well. LangSmith and Arize are getting closer, but as of July 2026, neither fully captures behavioral anomalies.
3. LLM-Specific Monitoring
This is separate from agent monitoring. You need to track the LLM layer itself, not just what the agent does with it.
What we track:
- Token usage per agent step (alerts on sudden spikes)
- Prompt size trends (prompts creeping up over time is a red flag)
- Response structure validation (is the LLM returning valid JSON? Valid function calls?)
- Output guardrail violations (we use a secondary classifier to check responses before they reach tools)
- Hallucination detection (we run a fact-checking pass on critical decisions)
4. Cost Tracking Per Session
This one hurts. We didn't track cost per agent session for the first three months. When we finally did, we found sessions costing $12-15 that should have cost $0.50.
The culprit: The agent was repeatedly failing, re-planning, and calling expensive LLM endpoints. Each failure added $0.30-0.80. After 15 failures, the cost ballooned.
We now track:
- Cost per step
- Cost per session
- Cost per user
- Cost per tool call type (some tools return large payloads that increase prompt size)
The Deployment Pipeline You Need
You cannot monitor agents effectively unless you control how they're deployed. Here's the ai agent deployment pipeline tutorial we use at SIVARO.
Stage 1: Prompt Sandboxing
Before any agent config hits production, it runs through our prompt sandbox. This isolates the system prompt, the tool definitions, and the guardrail rules. We test them against a library of known edge cases.
python agent_sandbox.py --agent-config ./configs/order-fulfillment-v2.yaml --test-cases ./tests/edge-cases.json --max-steps 20 --traffic-shaping emulate-user-3
Stage 2: Shadow Mode
Every new agent version runs in shadow mode for 48 hours. It sees the same requests as production but doesn't take any real actions. We compare its decisions against the production agent's decisions.
What we look for:
- Decision divergence (does the new agent choose different tools?)
- Latency changes (is it slower or faster?)
- Cost differences (is it more expensive?)
- Safety violations (does it try to do things the old agent didn't?)
Stage 3: Canary with Hard Budgets
5% of traffic. Hard limits on step count (max 10), cost per session (max $2), and tool call frequency. If the agent exceeds any limit, the session fails safe — no destructive actions, no external API calls.
Stage 4: Graduated Rollout
We increase traffic in 15% increments. Each level runs for 2 hours. We monitor step count distributions, cost distributions, and decision quality (via human review of a random 1% sample).
Code: The Minimal Agent Monitoring Instrumentation
Here's a stripped-down version of what we inject into every agent. This is Python, but the pattern applies anywhere.
python
class InstrumentedAgent:
    def __init__(self, agent_id, config):
        self.agent_id = agent_id
        self.config = config
        self.session_id = str(uuid.uuid4())
        self.steps = []
        self.cost = 0.0
        self.start_time = time.time()

    async def step(self, input_data):
        step_number = len(self.steps) + 1

        # Check behavioral limits
        if step_number > self.config.max_steps:
            await self._fail("Max steps exceeded", step_number)
            return None

        # Record state before decision
        state_before = {
            'agent_id': self.agent_id,
            'session_id': self.session_id,
            'step_number': step_number,
            'timestamp': datetime.utcnow().isoformat(),
            'agent_state': self._get_internal_state()
        }

        # Make the decision
        decision = await self._call_llm(input_data)

        # Record state after decision
        state_after = {
            'decision': decision,
            'tools_called': decision.get('tool_calls', []),
            'duration_ms': (time.time() - self.start_time) * 1000,
            'tokens_used': decision.get('tokens', 0),
            'confidence': decision.get('confidence', 0.5)
        }

        # Emit trace
        self._emit_trace({
            'before': state_before,
            'after': state_after,
            'cost': self._calculate_step_cost(decision)
        })

        self.steps.append({
            'input': input_data,
            'decision': decision,
            'state': state_after
        })

        return decision
The key insight: record state before and after every decision. That's how you catch context drift. If the agent's internal state drifts, you'll see it in the before-state diff across steps.
What About the Frameworks?
There's been a lot of noise about agent frameworks. IBM's research highlights 12 major frameworks, and Instaclustr's 2026 analysis puts LangChain, CrewAI, and AutoGen at the top.
Here's my honest take after building with all of them:
Don't pick a framework for its monitoring. Pick it for its architecture. Then build monitoring on top.
LangChain has LangSmith, which is decent for trace visualization. But it doesn't do behavioral anomaly detection. CrewAI has nothing built-in. AutoGen has basic logging but no alerting.
The LangChain blog is right: think about the framework as a composition layer, not an operational solution. Your monitoring should be framework-agnostic. We've swapped frameworks twice and our monitoring stack didn't change.
For protocols, the AIVM work on standardizing agent-to-agent communication is interesting, but it's early. Most production agents still use REST or gRPC. The survey from arXiv is worth reading if you're building multi-agent systems, but don't over-invest in protocol compliance today.
The Observability Tool Landscape (as of July 2026)
Here's what exists, what it's good at, and where it falls over.
Datadog / New Relic / Grafana
Good for: Infrastructure monitoring, APM, logs
Bad for: Agent decision tracing, behavioral analysis, prompt/response inspection
We still use Datadog for CPU, memory, and network. But for agent behavior, it's almost useless. The traces lack structure for LLM interactions.
LangSmith (LangChain)
Good for: Step-by-step agent traces, prompt debugging
Bad for: Anomaly detection, cost tracking, state divergence monitoring
We use LangSmith for development. In production, it needs too much custom instrumentation.
Arize AI
Good for: LLM performance monitoring, embedding drift
Bad for: Multi-step agent workflows, tool misuse detection
Arize is great if your agent is basically "LLM in, response out." For complex multi-tool agents, it struggles.
Custom OpenTelemetry-based (What We Run)
Good for: Everything, because you build what you need
Bad for: Time investment, maintenance burden
This is the honest trade-off. Pre-built tools save time but miss the specific failure modes that will actually hit you. Building custom gives you exactly what you need but costs engineering hours.
My recommendation: start with LangSmith or Arize for the first 60 days. By day 60, you'll know exactly what monitoring gaps you have. Then decide whether to extend the tool or build custom.
The Missing Piece: Human-in-the-Loop Monitoring
No monitoring tool fully replaces a human reviewing decisions. We run a 1% manual review of agent decisions. A team of four reviewers looks at:
- Did the agent choose the right tool?
- Did it use the right parameters?
- Did it complete the task?
- Did it over-call or under-call?
This catches things no automated system finds. Last month, a reviewer noticed our order-fulfillment agent was calling "get_inventory" before every booking. The tool wasn't changing the agent's decisions — it was just adding latency and cost. The agent had learned a useless habit from training data.
Automated monitoring didn't flag it. A human did.
The Open-Source Options
If you're budget-constrained (and who isn't?), the open-source frameworks are worth evaluating. Phidata and Superagent both have basic monitoring. CrewAI's open-source version gives you trace logs but no alerting.
The catch: Open-source monitoring tools for agents are immature. You'll spend more time configuring them than you'd spend building from scratch. We evaluated three open-source options and ended up building our own for production, using the open-source tools only for development.
FAQ: Quick Answers to What You're Actually Asking
Q: What's the single most important metric for agent monitoring?
Step count per execution. If it's above 10, something is wrong.
Q: How do you alert on agent behavior without false positives?
Set hard limits on step count, tool call frequency, and cost per session. These are non-negotiable. Everything else is soft alerting — notify but don't page.
Q: Can you use existing APM tools for agent monitoring?
Partially. Use them for infrastructure. Build or buy separate tools for agent behavior.
Q: How often should agent monitoring alerts fire?
In a healthy system, behavioral alerts should fire less than once a week. If they fire more often, your agent design is the problem, not your monitoring.
Q: What's the biggest mistake teams make?
Treating agent monitoring like microservice monitoring. Latency and error rates tell you almost nothing about agent health.
Q: Do you need separate monitoring for multi-agent systems?
Yes. Single-agent monitoring doesn't scale. You need cross-agent trace correlation and message-level tracking.
Q: How much should monitoring cost?
10-15% of your agent infrastructure costs. If you're spending more, you're over-instrumenting.
Q: What's the first thing to monitor when deploying a new agent?
Step count. If it's high on day one, it'll get worse. Fix the agent before fixing the monitoring.
Where We're Heading
The next frontier is real-time behavioral alerting. Not "agent called too many tools" but "agent is about to make a destructive decision." We're testing a system that scores each decision before execution and blocks high-risk choices.
Early results are promising — we've prevented three data-deletion events and one incorrect payment approval in the last month alone. But it's expensive. Each pre-execution check adds 200-400ms of latency and costs $0.10-0.15.
The trade-off is clear: pay for guardrails or pay for cleanup.
The Hard Truth
Here's what I've learned after two years of running agents in production: ai agent production monitoring tools are still catching up to what agents can actually do. The frameworks, the protocols, the observability platforms — they're all building the plane while flying it.
You will have to build some of this yourself. You will have incidents that no tool catches. You will wake up at 3:17 AM to an agent that spent $47 in 47 seconds.
But if you instrument for behavior, not just infrastructure, you'll catch the second incident before it happens. And that's the whole point.
Nishaant Dixit — Founder of SIVARO. Building data infrastructure and production AI systems since 2018. Built systems processing 200K events/sec.