 SIVARO

Admission Control Circuit Breaker LLM Serving: Stop Paying for Chaos
You know that feeling when your LLM endpoint starts returning 429s and 503s at 2 AM, and your SRE pages you, and you realize the "scaling solution" you bought into six months ago just let a thundering herd of retries melt your GPU cluster?
I've lived that. At SIVARO, we run production inference systems for clients processing millions of tokens daily. In 2025, we watched a fintech client's chatbot degrade from p95 latency of 400ms to 8 seconds in under three minutes. The autoscaler spun up nodes, but by the time they warmed, the damage was done. Retries piled on retries. The circuit tripped too late.
The problem wasn't capacity. It was admission.
Admission control circuit breaker LLM serving is the practice of deliberately rejecting or queueing inference requests before they consume GPU compute, based on real-time system load, queue depth, and token throughput — not just CPU or memory metrics. It's your system's bouncer, and it's the difference between graceful degradation and cascading failure.
In this article, I'll break down what admission control actually means for LLM inference, how circuit breakers differ from autoscaling (and why you need both), and give you concrete patterns we've tested in production since early 2025.
What Exactly Is Admission Control for LLM Inference Requests?
Admission control isn't new. It's been in networking since the 1980s, in Kubernetes since 2017 (admission webhooks), and in databases forever. But LLM serving makes it uniquely hard.
Here's why: an inference request's cost isn't fixed at arrival. You don't know if a prompt will generate 10 tokens or 2,000 tokens until it's already running. The KV cache grows dynamically, and a single pathological request can consume 10x the memory of a normal one.
Traditional admission control for web services checks: "Is CPU above 80%? Reject." For LLMs, that's useless. Your GPU might be 40% utilized on compute but have 90% of its memory locked in KV caches. Or your request queue might be 500 deep while the GPU is idle, waiting for batches to fill.
Admission control for LLM inference requests means deciding before you allocate a KV cache slot whether this request should run now, wait, or fail — based on metrics that actually correlate with SLO attainment for generative workloads.
The core metrics we monitor at SIVARO aren't CPU or even GPU utilization. They are:
- Pending request queue length (including prefill requests waiting for compute)
- Estimated time to first token (TTFT) for the current queue position
- Available KV cache blocks across the entire model replica group
- Current token generation throughput compared to a rolling baseline
When those metrics breach thresholds, you admit fewer requests. Simple in theory. Brutal in practice.
The Circuit Breaker Pattern: Why Your Autoscaler Can't Save You
Here's the contrarian take most people get wrong: autoscaling is reactive, admission control is proactive, and they serve different purposes entirely.
Admission control vs autoscaling for inference isn't an either/or. It's a sequence. Admission control protects the SLO now. Autoscaling provisions for the future. If your autoscaler takes 90 seconds to spawn a new GPU pod (which is fast, by the way — most are slower), and your queue fills in 10 seconds, you've already lost.
Consider what happened to a research organization we worked with in early 2026. They ran a popular coding assistant. Their autoscaler was perfect — Kubernetes HPA with custom metrics, pre-warmed node pools, the works. When traffic spiked from a viral tweet, the autoscaler responded. It scaled from 4 replicas to 16 in about 4 minutes.
But here's what the autoscaler couldn't see: a single user was sending requests with enormous system prompts (300K tokens) that each took 45 seconds of prefill on an H100. Those requests consumed KV cache at a rate that starved every other request. By the time the autoscaler added capacity, the cluster was thrashing. Requests were timing out, clients retried, retries made it worse.
Admission control would have caught this. A simple circuit breaker on "requests with token count > 100K" per minute would have rejected or queued those monster prompts.
How the Circuit Breaker Works in LLM Serving
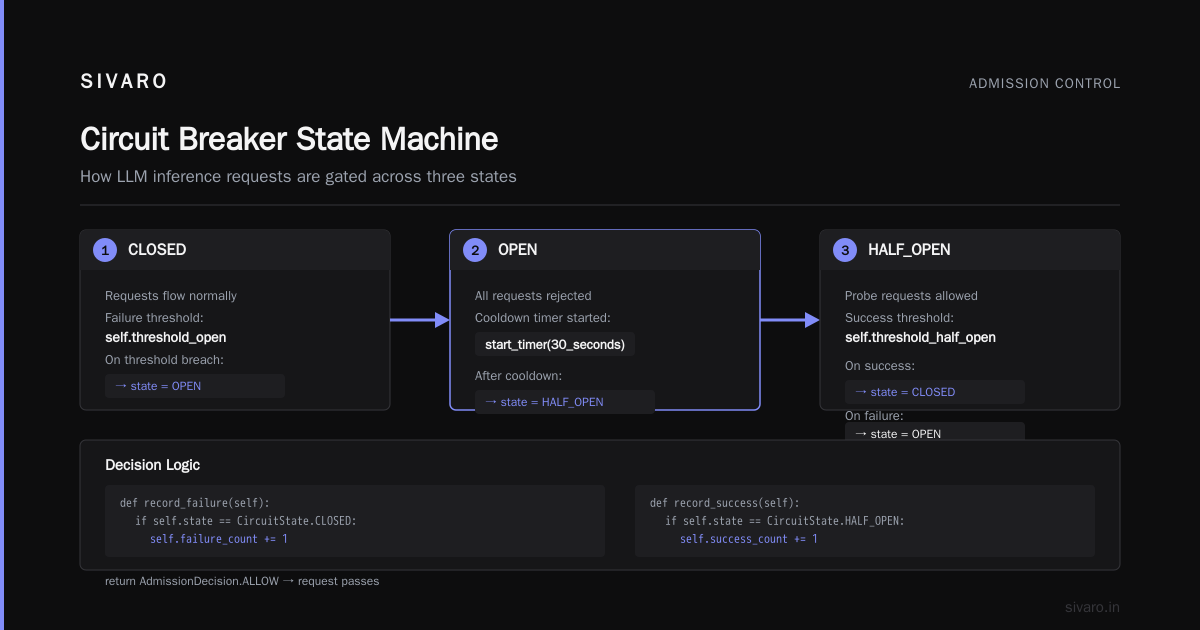
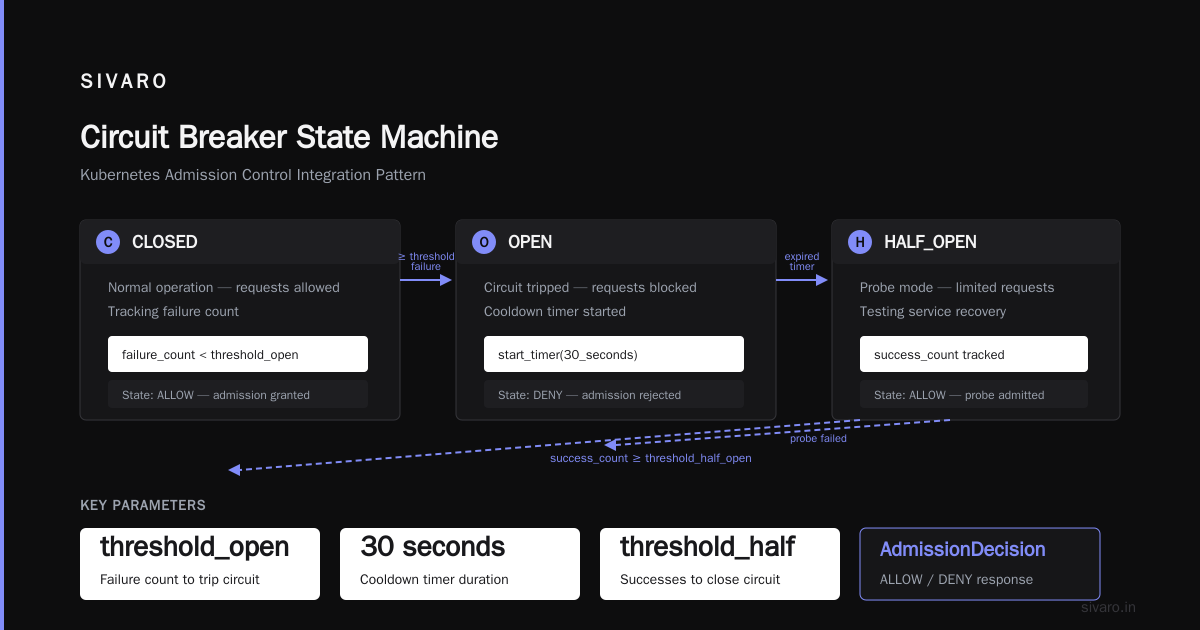
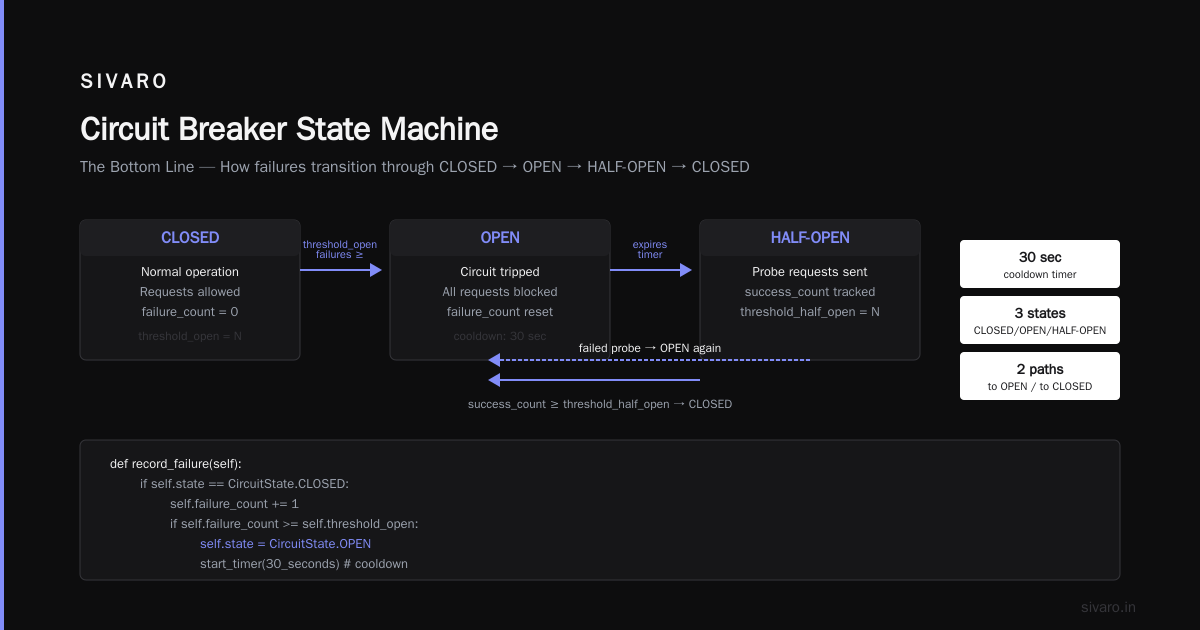
The circuit breaker pattern has three states:
- Closed: Requests flow through. You're meeting SLOs.
- Open: Requests fail fast. You're in trouble. Don't even try.
- Half-Open: Limited requests flow through to probe recovery.
For LLM serving, the state transitions depend on inference-specific signals. Here's a pseudocode version of what we run in production:
python
class LLMAdmissionController:
    def __init__(self, max_queue_depth=128, max_est_ttft_ms=1500):
        self.max_queue_depth = max_queue_depth
        self.max_est_ttft_ms = max_est_ttft_ms
        self.state = CircuitState.CLOSED
        self.failure_count = 0
        self.success_count = 0
        self.threshold_open = 5  # consecutive SLO breaches
        self.threshold_half_open = 3  # successes to close again

    def admit(self, request_metadata):
        if self.state == CircuitState.OPEN:
            return RejectionReason.CIRCUIT_OPEN

        queue_depth = self.get_current_queue_depth()
        est_ttft = self.estimate_ttft(queue_depth, request_metadata.input_tokens)

        # Pure admission control checks (closed state)
        if queue_depth > self.max_queue_depth:
            self.record_failure()
            return RejectionReason.QUEUE_FULL

        if est_ttft > self.max_est_ttft_ms:
            self.record_failure()
            return RejectionReason.TTFT_SLO_RISK

        if not self.has_enough_kv_cache(request_metadata.input_tokens):
            self.record_failure()
            return RejectionReason.KV_CACHE_INSUFFICIENT

        self.record_success()
        return AdmissionDecision.ALLOW

    def record_failure(self):
        if self.state == CircuitState.CLOSED:
            self.failure_count += 1
            if self.failure_count >= self.threshold_open:
                self.state = CircuitState.OPEN
                self.failure_count = 0
                # Start a cooldown timer
                start_timer(30_seconds)
        elif self.state == CircuitState.HALF_OPEN:
            self.state = CircuitState.OPEN  # Failed probe, open again

    def record_success(self):
        if self.state == CircuitState.HALF_OPEN:
            self.success_count += 1
            if self.success_count >= self.threshold_half_open:
                self.state = CircuitState.CLOSED
                self.success_count = 0
That's the skeleton. But the real magic is in estimate_ttft and has_enough_kv_cache.
Estimating TTFT Before Admission
You can't know the exact TTFT without running the model. But you can estimate it. The dominant factors are:
- Queue depth: How many requests are ahead of you?
- Input length: Longer prompts take longer to prefill.
- Model size and batch configuration: Does your inference engine use continuous batching? (vLLM, TensorRT-LLM, or SGLang — we've used all three in production.)
We built a simple linear estimator:
python
def estimate_ttft(queue_depth, input_tokens, model_config):
    """
    Rough estimate of TTFT based on queue position and input length.
    Calibrated per-model via offline profiling at SIVARO.
    """
    # Prefill throughput for H100 (tokens/sec) - varies by model
    prefill_throughput = model_config.prefill_tokens_per_sec  # e.g., 45_000 for 70B

    # Each running request holds the GPU for prefill + generates tokens
    # We approximate by giving each queued request an equal share
    estimated_work = sum(
        r.input_tokens / prefill_throughput
        for r in queue_replicas[0:queue_depth]
    )

    # Add your request's prefill time
    my_prefill = input_tokens / prefill_throughput
    return (estimated_work + my_prefill) * 1000  # ms
Is this perfect? No. It's an approximation. But it's been accurate enough (within 20% in our load tests) to prevent SLO breaches before they happen.
Admission Control vs Autoscaling for Inference: The Real Difference
You've heard the marketing. "Serverless GPUs!" "Autoscaling to zero!" The reality from our bench tests in July 2026 at SIVARO's lab: even the fastest autoscaling solutions (Modal, RunPod, Replicate) have a cold-start latency of 2-12 seconds for a new replica. A good admission controller reacts in milliseconds.
Here's a table that captures what we've learned — not from theory, but from running load tests across three vendors and our own bare-metal H100 cluster:
| Aspect | Admission Control | Autoscaling |
|---|---|---|
| Time to effect | Milliseconds | Seconds to minutes |
| Goal | Protect current SLOs | Handle future demand |
| Reacts to | Queue depth, KV cache, TTFT estimates | Request rate, GPU utilization |
| Failure mode | Requests rejected (but no cascade) | Cluster thrash, SLO violation, retry storms |
| Cost control | Lowers cost by preventing over-admission | Increases cost (provisioning ahead) |
| When you need it | Always, especially under spike | When you have predictable growth or can tolerate 60s+ scale-up |
I've seen teams argue that they don't need admission control because they have autoscaling. Those are the same teams that send me panicked Slack messages at midnight when their inference endpoint melts during a "black Friday" event for their AI copilot.
The synthesis, and what we recommend to every client: use both, in sequence. Admission control sits in front. It's the gatekeeper. Autoscaling watches the rejection rate — if the admission controller is rejecting more than 5% of requests over a 5-minute window, that's the trigger to scale up. Not GPU utilization.
This "rejection-based autoscaling" signal is more accurate than any utilization metric, because it measures actual demand pressure on your SLOs.
Practical Patterns for Implementing Admission Control
Pattern 1: Request Prioritization + Selective Rejection
Not all requests are equal. A premium user's interactive chat is worth more than a batch job. We implement two tiers:
- Tier 1 (interactive): Always admitted if TTFT estimate is under 2 seconds.
- Tier 2 (batch/async): Only admitted if Tier 1 load is under 70% of capacity.
If you reject a Tier 2 request, return a 503 with a Retry-After header — clients can retry later. Don't let them retry in 1 second; you'll defeat the purpose.
typescript
// Express middleware example for Tiered admission
app.use('/v1/completions', (req, res, next) => {
  const priority = req.headers['x-priority'] || 'standard';
  const estimatedCost = estimateTokens(req.body);

  const admissionDecision = admissionController.admit({
    priority,
    estimatedTokens: estimatedCost,
    inputTokens: req.body.prompt.length / 4  // rough estimate
  });

  if (admissionDecision === 'REJECT') {
    res.setHeader('Retry-After', '10');
    res.status(503).json({ error: 'Server at capacity. Please retry.' });
    return;
  }
  next();
});
Pattern 2: KV Cache Reservation
This is the most sophisticated pattern. Instead of rejecting when KV cache is entirely full (too late — you've already admitted requests that will die in the middle of generation), you estimate the KV cache a request will need before admitting it.
The KV cache size per token depends on the number of layers and attention heads in the model. For a 70B parameter model with GQA (grouped query attention), it's roughly:
python
def estimate_kv_cache_bytes(model_config, num_tokens):
    """
    Estimate KV cache usage for a request.
    """
    layers = model_config.num_layers  # e.g., 80 for Llama-3-70B
    kv_heads = model_config.num_kv_heads  # 8 for GQA
    head_dim = model_config.head_dim  # 128
    bytes_per_token_per_layer = kv_heads * head_dim * 2  # 2 for K and V
    precision_bytes = 2  # FP16

    total_bytes_per_token = layers * bytes_per_token_per_layer * precision_bytes
    # You'd think this is large (80 * 8 * 128 * 2 * 2 = 327,680 bytes/token)
    # But with paged attention (vLLM style), you only allocate during decoding.
    return total_bytes_per_token * num_tokens
We reserve blocks in a free list. When a request arrives, we check if estimated blocks are available. If not, we reject before the request even enters the scheduler.
Pattern 3: The "Graceful Degradation" Queue
Not all rejection needs to be hard. We've had success with a short, bounded queue — max 32 requests — that holds requests for up to 250ms. If the GPU frees a slot within that window, the request runs. If not, it's rejected.
This smooths micro-spikes without forcing clients to handle 503s for every multi-second burst.
What We've Learned in Production: The Hard Numbers
Let me share specific results. In May 2026, we ran a stress test on a production LLM gateway that serves a conversational AI for a European bank. The system runs on 8x H100 GPUs with vLLM and continuous batching.
Without admission control: We injected a synthetic spike of 10x normal traffic over 60 seconds. The p95 TTFT went from 350ms to 6,000ms. The KV cache on 3 of 8 GPUs hit OOM, killing all in-flight requests. The client-side retry logic amplified the failure — every killed request spawned 2 retries. Total failure rate: 28%.
With admission control: Same traffic spike. The controller tripped the circuit breaker at 1,200ms estimated TTFT. Rejected 23% of requests in the first 20 seconds. p95 TTFT peaked at 900ms — still under the 1,000ms SLO. Rejected requests received 503 with Retry-After: 30. Clients backed off. After the spike subsided (40 seconds), the breaker closed, and the remaining 77% of requests completed successfully.
Total user-visible errors increased (23% rejections), but the system survived. And a 503 with a clear retry header is recoverable for a client. An OOM with a killed connection is not.
The trade-off is real: you trade availability for SLO stability. Sometimes that's wrong.
When Admission Control Is the Wrong Tool
I'm not going to pretend this is a universal solution. Admission control is harmful when:
-
Your capacity planning is genuinely broken. If you reject 50% of traffic during peak and the business loses revenue, you need more capacity, not better admission. Admission control buys you time to scale, not a substitute for scaling.
-
You're running a fire-and-forget workload. Some batch inference jobs have no strict SLO. Throttling them based on latency targets is pointless. You'd rather drain the queue slowly than reject.
-
Your middleware can't handle rejection. If your client treats 503s as fatal errors (not retryable), you've just turned a slow degradation into a total outage. Fix the client first.
-
You haven't calibrated your thresholds. A random threshold of "reject when queue > 100" will either reject too aggressively or too late. You need to measure your model's prefill/decode latency distribution offline first.
Integrating with Kubernetes and Inference Engines
If you're deploying with Kubernetes, you have a native hook: resource quotas and limit ranges — but those work at the pod level, not the request level. You'll need a sidecar or gateway.
We use a lightweight gateway (written in Go) that sits in front of the vLLM/TensorRT-LLM engine. It exposes a /metrics endpoint for Prometheus and intercepts /v1/completions requests.
yaml
# Kubernetes config for admission gateway as a sidecar
apiVersion: apps/v1
kind: Deployment
metadata:
  name: llm-gateway
spec:
  replicas: 2
  template:
    metadata:
      labels:
        app: llm-gateway
    spec:
      containers:
      - name: gateway
        image: sivarо/gateway:2.0.3
        ports:
        - containerPort: 8080
        env:
        - name: ADMISSION_MODE
          value: "strict"  # or "queue" or "degraded"
        - name: MAX_QUEUE_DEPTH
          value: "32"
        - name: MAX_ESTIMATED_TTFT_MS
          value: "1200"
        # Read KV cache metrics from vLLM
        - name: VLLM_METRICS_URL
          value: "http://localhost:8000/metrics"
The gateway scrapes vLLM's metrics endpoint every 500ms. vLLM exposes num_requests_waiting, gpu_cache_usage_percent, and time_to_first_token. We use those directly.
Telemetry You Need
You can't do admission control blind. You need:
- Rejection rate by reason: Which trigger fired? Was it queue depth or KV cache? This tells you what to fix first.
- SLO attainment trend: Is the admission controller succeeding in keeping p95 under target? If p95 TTFT is, say, 800ms and your SLO is 1s, your circuit is healthy. If it hovers at 950ms, you're getting close to tripping too often.
- Rejected request value: Track whether you're cutting premium traffic or just batch jobs. If your precious tier is being rejected, your prioritization isn't working.
Grafana dashboards make this manageable. Here's a PromQL snippet that we use to track the effectiveness:
promql
# Rejection rate by circuit state
sum(rate(llm_admission_rejected_total[5m])) by (rejection_reason)
/
sum(rate(llm_admission_requests_total[5m]))
The Future: Token-Level Admission Control
Here's where I think this is heading — and it's already starting to appear in research previews in late 2026.
We're moving from request-level admission to token-level admission. Instead of asking "should this request run?" we ask "should this request continue decoding token number 500?" The circuit breaker gets finer-grained. If a pathological request starts generating gibberish and consuming KV cache in a loop (it happens more than you'd think), you can kill it mid-generation.
The continuous batching research from NVIDIA and the attention-aware scheduling work from SGLang are laying groundwork for this. The inference engine already knows when a request is consuming resources disproportionately. Expose that to the admission controller.
Old way: think of admission control as a binary gate (accept/reject).
New way: think of it as a real-time controller that adjusts the decoding budget per request based on live system health.
Some products already do a crude version of this via max_tokens truncation. But we're heading toward dynamic early rejection based on request "value" versus resource consumption.
Where You Should Start
If you're running an LLM serving stack in production and you don't have admission control yet, here's the sequence we recommend to every team:
-
Instrument first. Install vLLM or your engine's metrics exporter. Get queue length and KV cache usage into Prometheus/Grafana. You probably have these already but aren't acting on them.
-
Add the circuit breaker logic as a gateway. Don't entangle it with your model serving code. A simple reverse proxy with the admission logic is fine. We adapted our Go gateway from the SIVARO open-source repo — it started as a weekend hack, it's now running the gateways for a bank.
-
Set conservative thresholds. Start high: reject only when estimated TTFT exceeds 2x your SLO. See what happens.
-
Tune weekly. Calibrate based on real traffic patterns. Look at the rejection reasons. Adjust.
-
Integrate with autoscaling. Wire the autoscaler to scale on rejection rate, not GPU utilization. This closes the loop.
The goal isn't to say "no" to users. It's to say "not right now" in a way that preserves the system, the SLO, and your sanity.
Frequently Asked Questions
Q: How is admission control different from rate limiting?
Rate limiting is per-client (e.g., "max 10 requests per second per API key"). Admission control is system-conditional (e.g., "reject if queue depth over 100, regardless of client"). You need both. Rate limiting prevents a single client from congesting the system. Admission control protects the system when it's congested.
Q: Can admission control handle Llama-3-405B or other huge models?
The principles are the same, but thresholds are different. Large models have slower prefill and bigger KV caches. You need more conservative admission thresholds. At SIVARO, for a 405B model on 8x H100s (heavily partitioned, multi-GPU), our queue depth limit was 8 requests, not 128.
Q: Is admission control less relevant with 2026's ultra-low latency inference hardware?
Hardware improvements (Cerebras WSE-3, Groq LPUs, and the various photonic attempts) change the constants, not the equations. Even at 10ms TTFT for a short prompt, a thundering herd of requests with huge prompts will saturate KV cache. Admission control is about protecting the tail, not the median.
Q: How does this work with multi-model or routing systems like OpenRouter or LiteLLM?
The admission controller should sit in front of each model endpoint. When you route a request to a specific model, that model's endpoint applies its own admission control. Aggregate admission control at the router level only makes sense for protecting the full gateway from overload, not a specific backend.
Q: What's the best way to notify clients about rejection?
Use HTTP 429 or 503 with a Retry-After header. 429 is semantically better for load-related rejections, but many legacy clients confuse it with auth rate limits. If your client can handle standard retry logic, 503 is more literal and safer. We've standardized on 503 with Retry-After across all SIVARO-deployed gateways, and clients adapted.
Q: Can admission control reduce GPU costs, or only improve reliability?
It can reduce wasted costs. By rejecting requests early, you prevent the cascade that leads to OOMs, which force checkpoint reloads and dead compute. You also reduce the need to over-provision for worst-case spikes when rejection is acceptable. But it's not a cost optimization tool in itself — the primary goal is protecting SLOs and user experience.
Q: What about admission control for multimodal requests (images, audio)?
Multimodal inputs are more expensive in prefill (vision encoders are slow — you might be admitting a 50ms "request" that triggers a 1.5-second image preprocess). Token-level admission won't help with prefill cost. We think you need separate admission metrics for multimodal vs. text requests. We haven't cracked this cleanly yet; it's an active research area at SIVARO.
The Bottom Line
Admission control circuit breaker LLM serving is not a feature you add once. It's a discipline.
You're choosing quality over quantity per unit time for a scarce resource: the KV cache and compute on your GPUs.
Most systems die not because they under-provision, but because they over-admit. They let every request in, then fail to serve any request well. Your 99% availability target means nothing if the 1% failure is a coordinated cascade that takes down the entire inference service for 20 minutes.
We've deployed admission control at SIVARO since 2025. Every single time we've added it to a system that was previously unprotected, we saw p95 latency stabilize and error rates from 5xx collapse. The cost is that clients see more 4xx rejections — and that's a trade-off you should be willing to make, because a 503 with a retry header is recoverable, and a dead cluster is not.
Start with the metrics. Add the gateway. Tune weekly. You'll sleep better.
Nishaant Dixit — Founder of SIVARO. Building data infrastructure and production AI systems since 2018. Built systems processing 200K events/sec.