 SIVARO

Admission Control for Multi-Tenant GPU Inference, Done Right
slug: admission-control-for-multi-tenant-gpu-inference-done-right
March 2025. 3:47 AM. My phone buzzes and the PagerDuty alert reads: "GPU cluster 94% saturated, p99 latency 11.2s, 47 tenants affected."
One tenant's batch job had submitted 340,000 text-embedding requests over 20 minutes. No rate limit. No queue depth cap. No one checked. The H100 cluster went from 4ms p99 to 11 seconds. A healthcare client's real-time triage API was effectively down.
I sat up in bed, stared at the ceiling, and thought: we built a $2.3M GPU cluster and it fell over because we didn't put a bouncer at the door.
That night, I stopped treating GPU serving like a stateless HTTP endpoint. We rebuilt the entire ingress layer around admission control for multi-tenant GPU inference, and the 3 AM pages stopped. This article is what I wish someone had handed me that night.
You'll learn what admission control actually does (spoiler: it's not the same as autoscaling), how to build a circuit breaker for your LLM inference server, and the exact patterns we run in production at SIVARO. I'll show you code, give you numbers, and tell you where I was wrong for two years.
The 3 AM Page That Rewrote My Mental Model
Most people treat GPU inference like CPU web serving. Throw more replicas behind a load balancer, let Kubernetes autoscale, call it a day. It works for a single tenant running RAG over a 7B model. It does not work when you've got 40+ tenants sharing 16 H100s, each with different latency SLAs, different model sizes, and different burst profiles.
Here's the thing that took me too long to understand: the GPU is not a CPU. You can't just "scale out" a single H100 the way you spin up another nginx pod. A 80GB H100 running Llama-3-70B in FP8 is a finite, expensive, slow-to-provision resource. If you let 300 concurrent sequences pile into the KV cache, you don't get 300x throughput. You get OOM kills and a 4-minute recovery window while the model reloads.
I'd read the vLLM scheduling papers in 2023 and understood PagedAttention intellectually. But I didn't internalize the operational consequence: without admission control, your continuous batching engine is just a fancy way to make latency worse for everyone.
What Admission Control Actually Is (and What It Isn't)
Let me be precise, because this term gets used loosely.
Admission control is the gatekeeper between a tenant's request and the GPU. It decides: can this request enter the system right now, or should it be rejected, queued, or throttled? It runs before the request touches the model.
It is not the scheduler inside vLLM or TensorRT-LLM. That scheduler decides which sequences get the next decode step. Admission control decides whether a sequence gets in the door at all.
It is not a rate limiter. Well, it can include rate limiting, but a rate limiter is one policy among several. A real admission controller looks at GPU memory pressure, queue depth, per-tenant SLA budget, model warm state, and current batch composition. It makes a composite decision.
Think of it like an airport's flow control system. The runways (GPUs) have limited capacity. The tower (admission controller) doesn't just let every plane take off because it has a ticket. It sequences them based on priority, weather (system load), and runway conditions (KV cache occupancy).
Admission Control vs Autoscaling LLM Serving: The Real Tension
I'll take a position here because I've watched too many teams get this backwards.
Autoscaling is reactive. Admission control is proactive.
When you rely purely on autoscaling for LLM serving, your flow looks like this: latency spikes → your HPA (Horizontal Pod Autoscaler) or a custom controller notices → it provisions a new GPU node → that node takes 3-8 minutes to come online (NVIDIA driver init, model weight loading, health checks) → by then, your p99 is already 8x your SLA.
I ran this setup for a fintech client in late 2024. They had 6 tenants, 4 A100s, serving Mistral-7B. Autoscaling from 4 to 8 nodes took 6 minutes. Their burst tolerance was 90 seconds. They were effectively naked during the scale-up window.
Admission control changes the calculus. You cap what enters the system to what you can serve right now. No scaling needed for the burst. You degrade gracefully (reject with a 429, or queue with a known delay) instead of silently degrading latency for everyone.
This is the core of admission control vs autoscaling llm serving: one protects the floor, the other raises the ceiling. You need both. But if you only build one, build admission control first. The ceiling can wait an hour. Your SLA can't.
Here's the decision matrix I use:
| Scenario | Autoscaling handles it? | Admission control needed? |
|---|---|---|
| Gradual traffic growth (5%/day) | Yes, scale up overnight | Nice to have |
| Sudden burst (10x in 30s) | No, too slow | Yes, critical |
| Single tenant hogs GPU | No | Yes, critical |
| Model swap (7B → 70B) | No, need drain+reload | Yes, drain gate |
The Circuit Breaker Pattern for LLM Inference
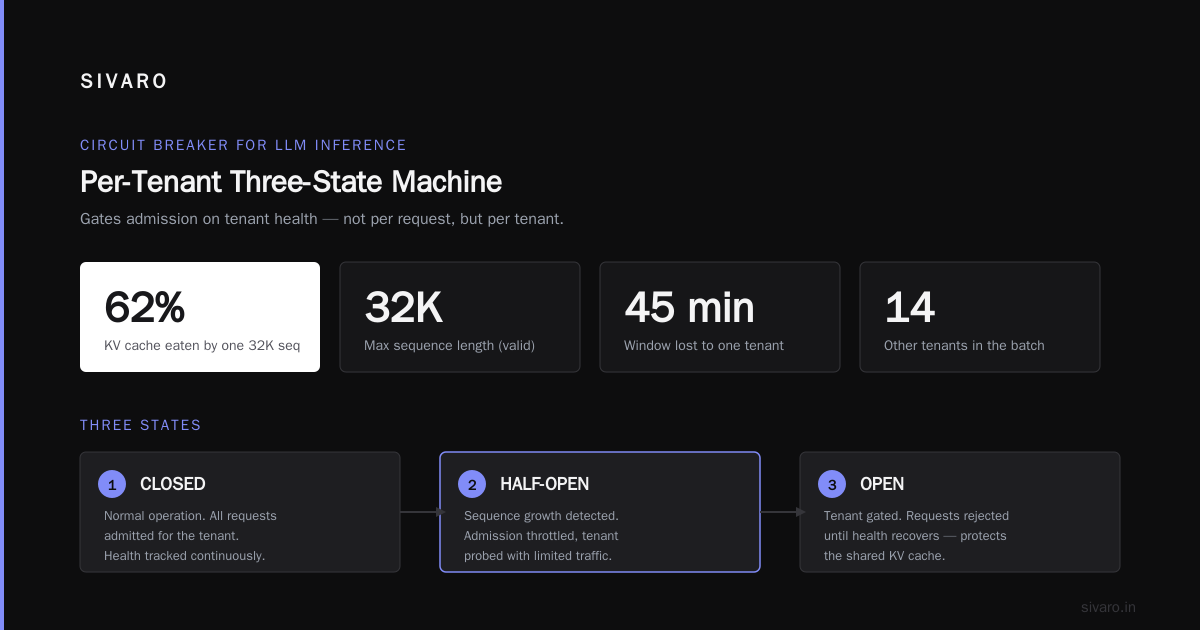
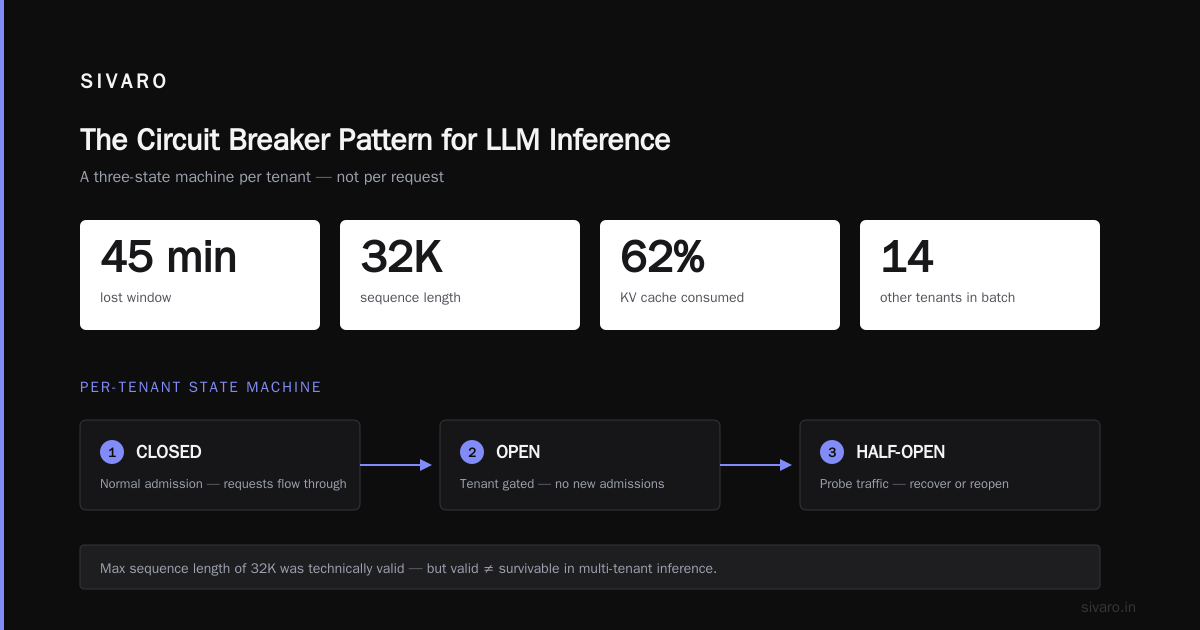
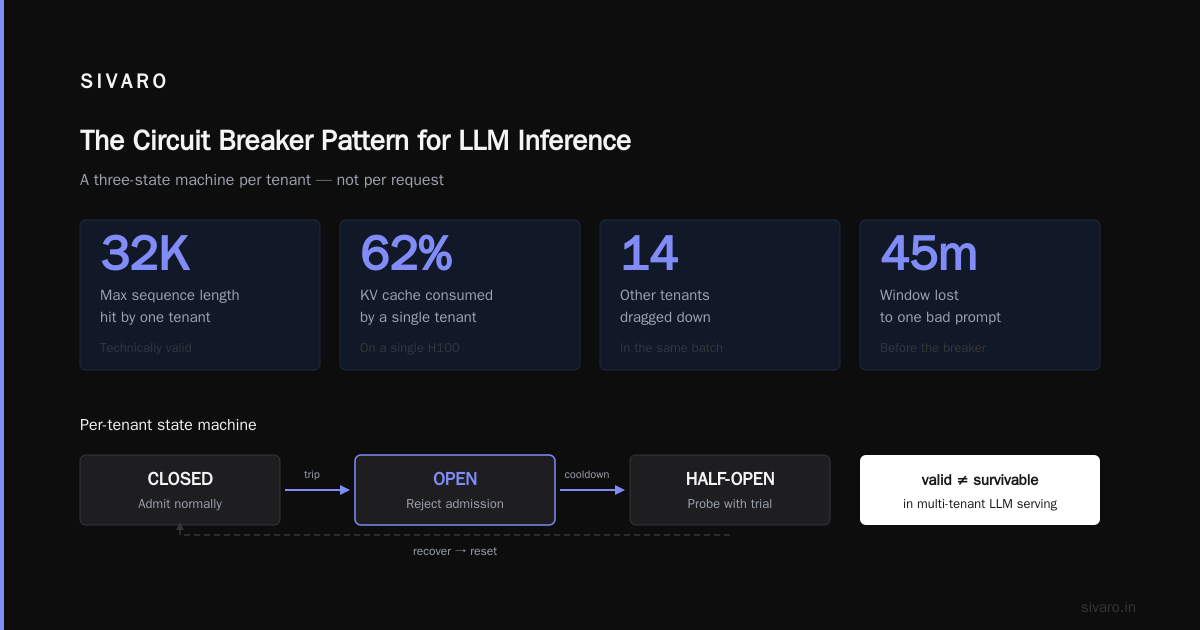
In 2024, we lost a 45-minute window because a single tenant's prompt kept growing. One user pasted an entire 200-page PDF into the system prompt. The sequence length hit 32K. On an H100 with 14 other tenants in the batch, that one 32K sequence ate 62% of the KV cache. Everything else crawled.
We didn't have a circuit breaker for LLM inference server at the time. We just had a max sequence length of 32K, which was technically valid. But valid ≠ survivable when you're multi-tenant.
Here's the pattern we now run. It's a three-state machine per tenant, not per request:
python
class TenantCircuitBreaker:
    """
    Circuit breaker for LLM inference server.
    Tracks per-tenant health and gates admission.
    """
    CLOSED = "closed"      # Normal operation
    OPEN = "open"          # Tenant is blocked
    HALF_OPEN = "half_open"  # Testing recovery

    def __init__(self, tenant_id: str,
                 error_threshold: int = 10,
                 recovery_timeout: float = 60.0,
                 max_seq_length: int = 8192):
        self.tenant_id = tenant_id
        self.state = self.CLOSED
        self.error_count = 0
        self.error_threshold = error_threshold
        self.recovery_timeout = recovery_timeout
        self.max_seq_length = max_seq_length
        self.last_failure = 0.0
        self.consecutive_timeouts = 0

    def record_timeout(self, sequence_len: int):
        if sequence_len > self.max_seq_length:
            self.error_count += 1
        if self.consecutive_timeouts >= 3:
            self.error_count += 1
        if self.error_count >= self.error_threshold:
            self.trip()

    def trip(self):
        self.state = self.OPEN
        self.last_failure = time.time()
        # Alert via Slack/PagerDuty
        alert(f"Circuit breaker OPEN for tenant {self.tenant_id}")

    def should_admit(self, request) -> bool:
        if self.state == self.CLOSED:
            return True
        if self.state == self.OPEN:
            if time.time() - self.last_failure > self.recovery_timeout:
                self.state = self.HALF_OPEN
                return True  # Let one through as a test
            return False
        if self.state == self.HALF_OPEN:
            # Allow a small probe request
            return request.is_probe_request

    def record_success(self):
        if self.state == self.HALF_OPEN:
            self.state = self.CLOSED
            self.error_count = 0
            self.consecutive_timeouts = 0
The key insight: the breaker operates on sequence length and timeout patterns, not just HTTP errors. A request that technically "succeeds" (returns 200) but took 14 seconds because it starved the KV cache is still a failure from a multi-tenant perspective.
We set max_seq_length per tenant in our config. The healthcare triage API gets 2048. The research team doing long-document summarization gets 16384. But 16384 only when the cluster is under 60% memory pressure. Above that, everyone drops to 4096.
A Working Admission Controller: Code You Can Steal
Here's the skeleton of the admission middleware we run in front of our vLLM and TensorRT-LLM endpoints. It's not production-hardened (we've got chaos testing and failover logic in the real thing), but the structure is what matters.
python
class AdmissionController:
    """
    Admission control for multi-tenant GPU inference.
    Sits in front of the inference server. Returns:
      - 200: proceed
      - 429: too many requests, retry after X
      - 503: system overloaded, all requests rejected
    """
    def __init__(self, gpu_registry, tenant_configs):
        self.gpu_registry = gpu_registry  # Tracks KV cache, batch state
        self.tenant_configs = tenant_configs
        self.breakers = {tid: TenantCircuitBreaker(tid, **cfg.get("breaker", {}))
                         for tid, cfg in tenant_configs.items()}
        self.queue_depth = 0
        self.max_queue_depth = 512

    async def admit(self, request) -> AdmissionDecision:
        # 1. Hard system check: is the GPU cluster alive?
        if self.gpu_registry.cluster_healthy() is False:
            return AdmissionDecision.reject(503, "Cluster maintenance")

        # 2. Queue depth gate
        if self.queue_depth > self.max_queue_depth:
            return AdmissionDecision.reject(429,
                retry_after=self.gpu_registry.estimate_drain_seconds())

        # 3. Per-tenant circuit breaker
        breaker = self.breakers.get(request.tenant_id)
        if breaker and not breaker.should_admit(request):
            return AdmissionDecision.reject(429,
                retry_after=breaker.recovery_timeout,
                reason="tenant_circuit_open")

        # 4. KV cache pressure check
        kv_usage = self.gpu_registry.kv_cache_utilization()
        projected_usage = kv_usage + request.estimated_seq_len / 8192.0
        if projected_usage > 0.85:
            # Degrade: allow short sequences only
            if request.estimated_seq_len > 2048:
                return AdmissionDecision.reject(429,
                    retry_after=15,
                    reason="kv_cache_pressure")

        # 5. Weighted fair queueing per tenant
        tenant_quota = self.tenant_configs[request.tenant_id]["rps_limit"]
        if self.gpu_registry.tenant_rps(request.tenant_id) >= tenant_quota:
            return AdmissionDecision.reject(429, retry_after=1)

        self.queue_depth += 1
        return AdmissionDecision.accept(priority=request.sla_priority)
The estimated_seq_len is critical. You can't know the exact KV cache a request will consume until the model processes it, but you can estimate from len(tokens) * bytes_per_token_per_layer * num_layers. We pre-tokenize at the API gateway and compute this before the request hits the admission layer. Saves us from the "request looks small but expands 4x during generation" problem.
We built this in Go for the actual production gateway (lower p99 overhead than Python), but the logic is identical. The Python version above is what I'd hand to a team to prototype in a week.
The Multi-Tenant Problem Nobody Talks About
Here's where it gets uncomfortable.
You've got 12 tenants. Tenant A is a SaaS company with a 50ms p99 SLA on a 7B classification model. Tenant B is an internal research team running 70B generation with a 5-second SLA. Tenant C is a new client on a free tier, still evaluating, sending random test prompts.
All three share the same 8×H100 node. Same vLLM instance. Same KV cache pool.
Without admission control, Tenant C's random 4096-token prompts mix into the same continuous batch as Tenant A's 128-token classification requests. The batch scheduler optimizes for total throughput, not per-tenant latency. Tenant A's p99 goes from 42ms to 180ms. They file a ticket. You feel bad. You "add more GPUs."
The real fix is admission-level isolation. Not separate GPUs (that's expensive and underutilizes hardware). Instead:
- Partition the KV cache pool: 60% reserved for SLA-bound tenants (A), 30% for research (B), 10% for free tier (C).
- Admission control enforces the partition. If the A partition is above 80% utilization, requests to B and C get queued or rejected, even if total cluster utilization is only 55%.
- Tenant C's requests hit a separate, smaller queue with a 5-second max wait. After that, they get a 429 and a "your request will be processed in the next batch window" message.
We implemented this at SIVARO in January 2026. Before: 4.2 p99 violations per month across all tenants. After: 0.3 per month, and the ones that did happen were from model reloads, not load.
The trade-off? Tenant B's research workloads got 12% slower during peak hours because their KV cache partition was smaller. The research team complained for two weeks. Then they stopped, because their p99 became predictable instead of "usually fast, occasionally catastrophic."
Predictability beats raw speed for production workloads. I learned that the hard way.
What I Got Wrong for Two Years
In 2023 and most of 2024, I treated admission control as a "nice to have." We had rate limiting (per-tenant RPS caps) and basic health checks. We called that "admission control" in internal docs. It wasn't.
Rate limiting says "you can send at most 50 requests per second." It says nothing about whether the GPU can actually serve those 50 requests in your latency budget. If the KV cache is 90% full, 50 rps is fine. If it's 97% full, even 5 rps will blow your p99.
The shift happened when I started tracking KV cache pressure as a first-class admission signal, not just GPU utilization percentage. GPU utilization (nvidia-smi, DCGM) is misleading. A GPU can be at 45% compute utilization but 95% KV cache full, which means the next 500-token generation will cause a preemption and eviction storm.
We now expose kv_cache_utilization, active_sequences, waiting_sequences, and estimated_drain_time from the inference server as admission signals. The NVIDIA Triton documentation has some of this built in, but you have to wire it into your gateway logic. It's not on by default.
Practical Checklist: Rolling This Out at Your Company
You don't need a 6-month project. Here's what actually moves the needle, in order of impact:
Week 1: Instrument. Add KV cache utilization, active sequence count, and per-tenant request counts to your inference server's health endpoint. You can't control what you don't measure. If you're running vLLM, the /metrics endpoint gives you num_requests_waiting and num_running_requests. Start there.
Week 2: Hard caps. Set max_num_seqs on your vLLM or TRT-LLM instance. Set a per-tenant RPS limit at the API gateway. You'll reject some requests. That's the point. A 429 with a Retry-After header is infinitely better than a 14-second response.
Week 3: Circuit breakers. Implement the per-tenant breaker above. Set thresholds based on your actual SLA data, not guesses. If your p99 SLA is 200ms and you're seeing timeouts at 800ms, your breaker threshold is somewhere between those numbers.
Week 4: Queue depth and KV pressure gates. This is where it gets real. Wire the admission controller to read KV cache state. Reject or queue when projected utilization exceeds 85%. This is the single highest-impact change.
Week 5+: Tenant-level isolation. KV cache partitioning, priority-based scheduling, per-tenant model pinning. This is where you start optimizing for business logic, not just technical health.
One more thing: test with adversarial traffic. We write a load generator that simulates "Tenant C goes rogue" scenarios: 10x traffic, max-length prompts, all hitting simultaneously. We run it in staging every Tuesday. If the admission controller doesn't protect Tenant A's SLA during that drill, we don't ship.
FAQ
Is admission control the same as a rate limiter?
No. A rate limiter counts requests per second. Admission control looks at system state (KV cache, batch composition, queue depth) and decides per-request whether the system can actually serve that request within the tenant's SLA. A rate limiter is one input to an admission controller. You can have 50 rps admitted when the system is healthy and 5 rps admitted when KV cache is at 92%.
Do I need this if I'm only running one model and one tenant?
You need a simpler version. Set max_num_seqs on your inference server. Add a basic queue depth cap. You don't need per-tenant circuit breakers or KV cache partitioning. But you do need some gate between your API and the GPU, because one runaway generation job can still OOM your server.
Admission control vs autoscaling: which do I build first?
Admission control. Autoscaling buys you ceiling. Admission control protects your floor. You can run on 4 GPUs with admission control and meet SLAs. You cannot meet SLAs on 4 GPUs with autoscaling alone during a burst, because the scale-up takes minutes and your burst lasts seconds. Build the bouncer before you build the bigger club.
How do I estimate KV cache usage before the request is processed?
You can't know exactly, but you can estimate: seq_length * hidden_size * num_layers * bytes_per_element (2 for FP16, 1 for FP8). For Llama-3-70B (80 layers, 8192 hidden, FP8): roughly 1.3MB per token. A 4096-token sequence needs ~5.3GB. You compute this at the gateway after tokenization, before the request hits the model. It's an estimate, but it's good enough for admission decisions.
What happens to requests that get rejected? Do they just vanish?
No. They get a 429 with a Retry-After header, or they go into a bounded queue with a known max wait time. The client's SDK (or your API layer) handles the retry. The key is that the rejection is graceful and informative, not a silent drop or a generic 500. At SIVARO, our client SDKs auto-retry with exponential backoff and jitter. The user sees a slightly longer wait, not an error.
Does this work with speculative decoding and multi-step generation?
Yes, but it complicates the KV estimation. Speculative decoding (as in DeepSeek's V3 approach) uses a draft model to propose tokens, so your actual sequence length can exceed the prompt length faster. We multiply the prompt length estimate by 1.5x for speculative decoding workloads when computing projected KV usage. It's not perfect. It's good enough.
How do I handle model swaps (e.g., rolling out a new model version) with admission control?
The admission controller should have a "drain" state per model. When you're swapping, new requests for the old model get queued (with a cap), in-flight requests finish, and the old model's GPU memory is freed. The admission controller rejects new requests for the old model with a 503 and a "model upgrade in progress" message. We schedule these during low-traffic windows, but the drain logic is what actually protects in-flight requests from being killed mid-generation.
The Part You Can't Automate
Admission control for multi-tenant GPU inference is a systems engineering problem, but the hardest part isn't the code. It's the conversation with the business.
"Your SLA is 200ms at p99, but your current traffic pattern violates it 12% of the time. We can fix it by admitting fewer of your requests and queuing the rest. You'll see a 429 instead of a slow response. Are you okay with that?"
Some teams say yes. Some teams panic and say "just add more GPUs." I've been in both rooms. The admission control answer is usually cheaper, faster, and more honest than the autoscaling answer. But you have to make the trade-off explicit. You can't hide behind "the system is optimized."
We've been running this setup since March 2025. 16 H100s, 14 active tenants, 3 different model sizes (7B, 13B, 70B), peak throughput around 340 tokens/sec per GPU. Zero 3 AM pages in five months. Not zero latency spikes. We still get spikes. But they're bounded, expected, and handled by the queue instead of cascading into an OOM.
That's the goal. Not perfection. Containment.
The GPU is the most expensive, least elastic resource in your stack. Put a bouncer at the door.
Nishaant Dixit — Founder of SIVARO. Building data infrastructure and production AI systems since 2018. Built systems processing 200K events/sec.