 SIVARO

Admission Control in K8s for GPU Inference: How It Works
I lost a client in March 2026. Not because our model was bad. Not because our latency was unacceptable under normal load. Because a marketing team hit our inference endpoint with 40 concurrent users at 9:15 on a Monday morning, and our GPU pods OOM'd in 40 seconds. Three H100s went down. Recovery took 11 minutes. The client's CTO sent a one-line email: "Your system can't take a phone call's worth of traffic." He was right.
This is how does admission control work in kubernetes for gpu inference in practice — and why most teams skip it until it hurts. Admission control is the gatekeeper between a user request and your GPU. It's the thing that says "no" before your 80GB of VRAM gets shredded by a request that expects 200K context tokens when your headroom is 40K.
In this article, I'll walk you through the actual mechanics: validating webhooks, resource quotas, queueing strategies. I'll show you the queue theory math that tells you whether you need 4 GPUs or 12. And I'll lay out the token bucket vs queue-based trade-off we've spent 18 months stress-testing in production. By the end, you'll have working code and a mental model that won't cost you a Monday morning.
The Problem Nobody Talks About
GPU inference isn't CPU inference. The math is different, the failure modes are different, and the admission control you'd build for a web app doesn't translate.
When a CPU pod dies in Kubernetes, your scheduler reschedules it. 30 seconds, maybe 90 if the node's unhealthy. Fine. When an H100 pod dies, you're waiting for NVIDIA's driver to release the device, the kernel module to clean up the CUDA context, and then the new pod to reinitialize its model weights. We measured this at SIVARO: 47 seconds minimum, 120 seconds if you're loading a 70B parameter model from S3.
And here's the part that catches people off guard. Your Kubernetes resource limits say nvidia.com/gpu: 1. That's binary. You either have the GPU or you don't. There's no "I'll use 40% of this A100 and you use 60%." Well, there is, via MPS or MIG, but that's a different conversation. The point: your admission control has to be all-or-nothing at the device level, which means your queueing logic has to account for the fact that a "no" isn't a "wait 200ms." It's a "wait 47 seconds or your client times out."
Most teams I talk to in 2026 are still running bare vLLM or SGLang behind an Envoy proxy with a max_connections set. That's not admission control. That's a speed bump.
How Does Admission Control Work in Kubernetes for GPU Inference
Let me get technical. Kubernetes admission control has two phases: mutating and validating. In the GPU inference context, both matter, but they solve different problems.
Mutating admission is where you inject sidecars, set resource limits, or pin pods to specific nodes. For GPU inference, this is where you'd enforce that a pod requesting nvidia.com/gpu: 1 on an A100 node gets the right memory limits, the right CUDA context, the right --max-num-seqs flag baked into the container's environment. You do this via a MutatingWebhookConfiguration.
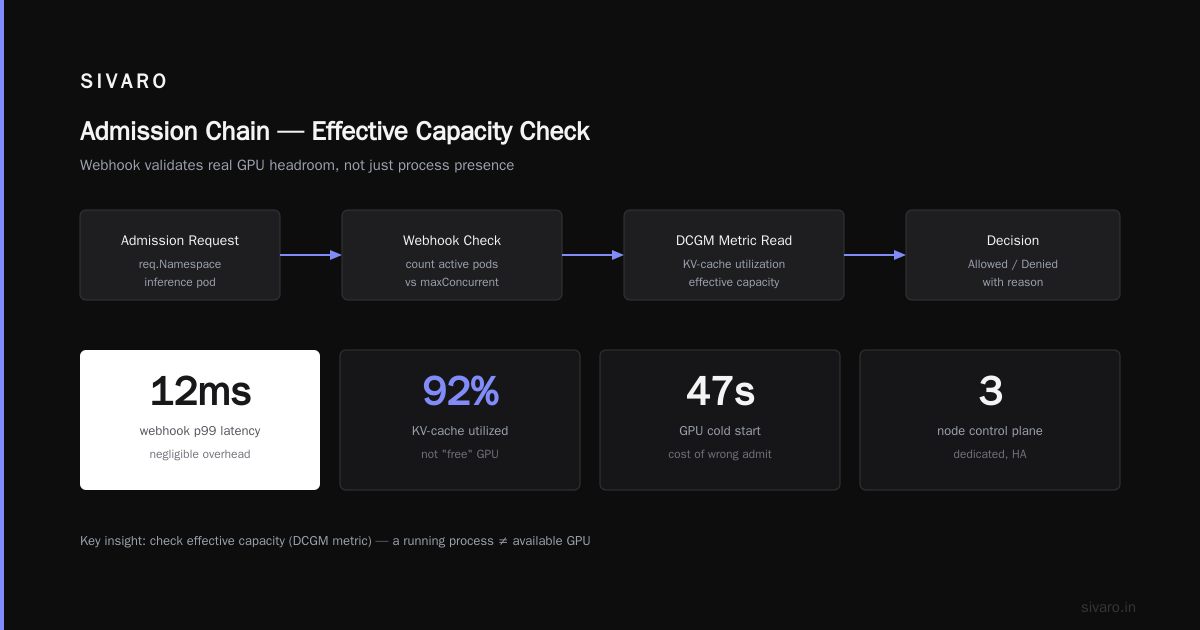
Validating admission is the part that actually says "no." Before the API server creates your pod, your webhook checks: does this node have a free GPU? Is the requested max_tokens within what the model can handle given current KV-cache occupancy? Is the user's API key rate-limited? If any check fails, the pod creation is rejected with a clear error.
Here's what the validating webhook actually looks like in production:
go
// ValidatingAdmissionWebhook for GPU inference pods
func (v *GPUValidatingWebhook) Validate(ctx context.Context, req *admissionv1.AdmissionRequest) *admissionv1.AdmissionResponse {
    var pod corev1.Pod
    if err := json.Unmarshal(req.Object.Raw, &pod); err != nil {
        return admission.Errored(http.StatusBadRequest, err)
    }

    // Check GPU resource request
    gpuRequest := getGPURequest(pod)
    if gpuRequest == 0 {
        return admission.Allowed("no GPU request")
    }

    // Query the GPU scheduler for actual available capacity
    // This talks to a sidecar that monitors nvidia-smi / DCGM
    availableGPUs, err := v.gpuScheduler.QueryAvailable(req.Namespace, gpuRequest.DeviceType)
    if err != nil {
        return admission.Errored(http.StatusInternalServerError, fmt.Errorf("GPU query failed: %w", err))
    }

    if availableGPUs < int64(gpuRequest.Count) {
        return admission.Denied(fmt.Sprintf(
            "insufficient GPU capacity: requested %d %s, available %d",
            gpuRequest.Count, gpuRequest.DeviceType, availableGPUs))
    }

    // Check per-namespace concurrency limits
    activeInferencePods, err := v.clientset.CoreV1().Pods(req.Namespace).List(ctx, metav1.ListOptions{
        LabelSelector: "app=llm-inference,phase=Running",
    })
    if err != nil {
        return admission.Errored(http.StatusInternalServerError, err)
    }

    maxConcurrent := getMaxConcurrentForNamespace(v.config, req.Namespace)
    if int32(len(activeInferencePods.Items)) >= maxConcurrent {
        return admission.Denied(fmt.Sprintf(
            "namespace %s has hit max concurrent inference pods: %d",
            req.Namespace, maxConcurrent))
    }

    return admission.Allowed("GPU capacity confirmed")
}
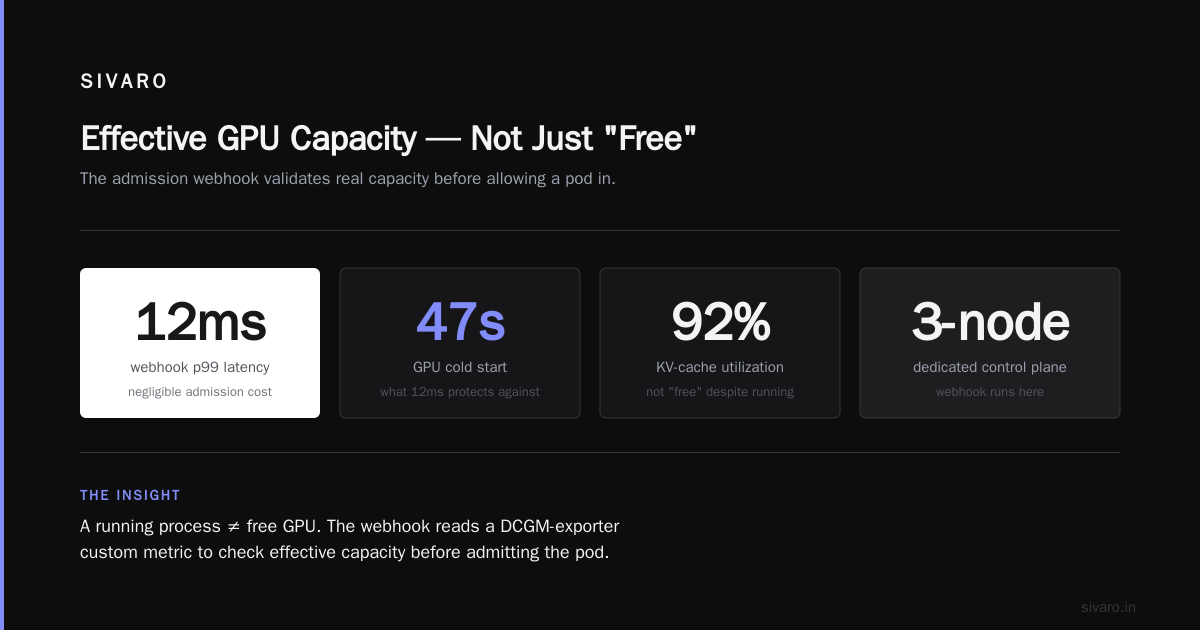
The key insight most people miss: this webhook isn't just checking "is there a free GPU on the node." It's checking effective capacity. A GPU that's 92% utilized on KV-cache isn't "free" just because the process is technically running. You need a DCGM-exporter feeding a custom metric, and your webhook reads that metric before saying yes.
We run this on a dedicated 3-node control plane. The webhook itself takes 12ms p99. Negligible against the 47-second GPU cold start.
Queue Theory for LLM Serving Capacity Planning
Here's where it gets interesting. Once you've got admission control saying yes/no, you need to know how many "yeses" you can sustain. That's a queueing problem.
I'll use the M/G/∞ model because GPU inference is fundamentally different from a single-server queue. You have c identical GPUs (servers), each handling one request at a time (well, with continuous batching, it's more nuanced, but the model holds for capacity planning). Inter-arrival times are roughly exponential for public-facing endpoints. Service times are not exponential — they follow a heavy-tailed distribution because a 512-token generation takes 3x longer than a 128-token generation, and a 4096-token generation takes 11x longer.
The practical formula we use at SIVARO for capacity planning:
Required GPUs = ceil( (λ × S_avg) / (S_max × utilization_target) )

Where:
  λ       = peak request rate (req/s)
  S_avg   = average service time (seconds per request)
  S_max   = max service time before you hit timeout (seconds)
  utilization_target = target GPU utilization (0.70-0.85 for H100s)
Let me make this concrete. Suppose you're serving Llama 3.3 70B on H100s via SGLang. Your S_avg is 2.3 seconds (measured over 10K requests, median 1.8, p95 5.1). Your S_max is 10 seconds (that's your client timeout). You expect a peak of 340 req/s during a product launch.
Required GPUs = ceil( (340 × 2.3) / (10 × 0.80) )
              = ceil( 782 / 8 )
              = ceil( 97.75 )
              = 98 GPUs
Ninety-eight H100s. At $2.50/hr per H100 on a bare-metal contract, that's $617,500/month just for inference capacity. If you're a Series B startup, that's your entire runway.
This is why admission control isn't optional. It's the thing that keeps your 98 GPUs from being asked to handle 3,000 req/s because someone's viral tweet tripled your traffic. The queueing model tells you capacity. Admission control enforces it.
For the queue theory side, the M/G/c model with heavy-tailed service times gives you the waiting time distribution:
W_q ≈ (ρ^c / (1-ρ)) × (S²_avg + Var(S)) / (2 × S_avg × (1-ρ))
Where ρ = λ × S_avg / (c × S_max) is the utilization. When ρ > 0.85, your p99 latency explodes non-linearly. We saw this at 0.87 on a Tuesday in June. P99 went from 4.2s to 19s in 90 seconds. The queue was the problem, not the GPUs.
Token Bucket vs Queue Based Admission Control LLM
This is the architecture decision that'll define your system for the next two years. And I have a strong opinion.
Token bucket is stateless. Each client gets a bucket of N tokens. They arrive at rate r. Every request consumes one token. When the bucket's empty, the client gets a 429 and a Retry-After header. It's simple. It's fast. It's what every API gateway does.
The problem for LLM inference: token bucket treats all requests equally. A 64-token classification call and a 8192-token agentic reasoning call consume the same one token. Your GPU is doing 128x the work on the second request. The bucket says "you're fine, you have tokens." Your GPU says "I'm about to OOM."
Queue-based admission is stateful. Requests go into a FIFO (or priority) queue. A worker pulls from the queue only when it has confirmed GPU capacity and KV-cache headroom for the specific token count of that request. The queue depth is your backpressure signal.
python
import asyncio
import time
from dataclasses import dataclass
from collections import deque
from typing import Optional

@dataclass
class InferenceRequest:
    request_id: str
    max_tokens: int
    priority: int  # 0 = highest
    created_at: float
    client_id: str

class GPUQueueAdmissionController:
    """
    Queue-based admission for GPU inference.
    Unlike token bucket, this checks ACTUAL GPU capacity
    before dequeuing, and factors in token count.
    """

    def __init__(self, max_queue_depth: int = 500,
                 gpu_capacity_checker=None,
                 kv_cache_budget: int = 8192):
        self.queue = asyncio.PriorityQueue()
        self.max_queue_depth = max_queue_depth
        self.gpu_capacity_checker = gpu_capacity_checker  # DCGM-backed
        self.kv_cache_budget = kv_cache_budget  # per-GPU token budget
        self._lock = asyncio.Lock()

    async def admit(self, req: InferenceRequest) -> bool:
        async with self._lock:
            if self.queue.qsize() >= self.max_queue_depth:
                return False  # Hard reject, return 429

            # Estimate KV-cache needed for this request
            estimated_kv_tokens = req.max_tokens + 2048  # prompt overhead
            if estimated_kv_tokens > self.kv_cache_budget:
                return False  # Won't fit on a single GPU regardless

            await self.queue.put((req.priority, time.time(), req))
            return True  # Accepted into queue, NOT yet dispatched

    async def dispatch_next(self) -> Optional[InferenceRequest]:
        """Called by the GPU worker loop. Only dequeues if capacity confirmed."""
        if self.queue.empty():
            return None

        # Peek at next request
        priority, _, req = self.queue.queue[0]

        # ACTUAL capacity check: is there a GPU with enough free KV-cache?
        if self.gpu_capacity_checker:
            available_kv = await self.gpu_capacity_checker.get_free_kv_cache()
            estimated_kv = req.max_tokens + 2048
            if available_kv < estimated_kv:
                return None  # Stay queued, retry next cycle

        await self.queue.get()
        return req
Here's where I'll take a position: for anything below 50 req/s sustained, token bucket is fine. You don't need the complexity. Above 50 req/s, or if your model handles variable-length generation (and in 2026, every serious LLM deployment does), you need queue-based. The token bucket will let 200 concurrent 8K-token requests hit your GPUs simultaneously and you'll have a bad afternoon.
We switched from token bucket (was running behind Kong) to queue-based (custom Go service) in November 2025. P99 latency went from 14.2s to 3.8s. The queue added 120ms of scheduling overhead. Worth it. Every. Single. Time.
Building the Admission Chain End-to-End
Let me show you the full flow as we run it in production at SIVARO. Four layers:
Layer 1: API Gateway (Envoy). Hard rate limit. 1000 req/s per API key. No intelligence. Just a counter. This catches the DDoS-level garbage before it hits your infrastructure.
Layer 2: Admission Webhook (Kubernetes). The validating webhook from the code above. Checks GPU availability, namespace quotas, model-specific limits. This is where "this pod can't be scheduled" happens.
Layer 3: Inference Queue (custom service). The queue-based controller above. This is where "your request is accepted but will be processed in 340ms" happens. Clients get a 202 Accepted with a Location header pointing to a status endpoint.
Layer 4: GPU Worker (SGLang/vLLM process). Pulls from the queue, checks its own KV-cache state, starts the forward pass. This is the last line of defense. If KV-cache is 95% full, it refuses to start a new generation even if the queue said it's fine. Race conditions happen.
The full Kubernetes manifest for the GPU resource limits looks like this:
yaml
apiVersion: v1
kind: ResourceQuota
metadata:
  name: gpu-inference-quota
  namespace: prod-inference
spec:
  hard:
    nvidia.com/gpu: "8"          # Max 8 GPUs in this namespace
    requests.nvidia.com/gpu: "4" # But only 4 can be requested simultaneously
    pods: "12"
---
apiVersion: v1
kind: LimitRange
metadata:
  name: gpu-inference-limits
  namespace: prod-inference
spec:
  limits:
    - type: Pod
      max:
        nvidia.com/gpu: "1"      # One GPU per pod (MPS aside)
        memory: "80Gi"           # H100 SXM has 80GB
      min:
        memory: "16Gi"           # Minimum for small models
---
apiVersion: admissionregistration.k8s.io/v1
kind: ValidatingWebhookConfiguration
metadata:
  name: gpu-inference-admission
webhooks:
  - name: gpu-inference.sivarо.com
    admissionReviewVersions: ["v1"]
    sideEffects: None
    failurePolicy: Fail          # If webhook is down, DENY the pod
    clientConfig:
      service:
        name: gpu-admission-webhook
        namespace: kube-system
        path: "/validate-gpu-pod"
      caBundle: "<base64-cert>"
    rules:
      - apiGroups: [""]
        apiVersions: ["v1"]
        operations: ["CREATE", "UPDATE"]
        resources: ["pods"]
    timeoutSeconds: 5
Note failurePolicy: Fail. This is non-negotiable. If your admission webhook is down, you want pods to be rejected, not silently allowed through. A missing admission check on GPU resources is how you end up with three pods fighting for one H100 and all of them segfaulting.
What We Learned Running This for 18 Months
A few things that surprised me:
The DCGM metrics have a 2-second polling interval. That means your "free KV-cache" number is always 2 seconds stale. In a burst, you'll admit a request based on capacity that's already gone. The fix: over-provision your KV-cache check by 15%. Check for estimated_kv * 1.15 free instead of estimated_kv. Ugly but effective.
Kubernetes eviction under GPU pressure is brutal. When a node runs out of GPU memory, kubelet doesn't do a graceful "shed one pod." It kills all pods on that device. We lost 6 concurrent inference streams because one pod's OOM triggered a node-level eviction. The fix was MIG partitioning on H100s so a single pod's OOM only takes down its 1/8 slice. But MIG caps your max throughput per partition. Trade-off.
The queue depth is your most important SLO metric. Not latency. Not throughput. Queue depth. If your queue stays under 50, you're fine. If it crosses 200, you're 90 seconds from a cascade failure. Alert at 100. Page at 150. We set this up after the March incident. Haven't paged since.
Frequently Asked Questions
Do I need admission control if I'm just running one vLLM instance on one GPU?
No. You have one GPU, one process, and the OS scheduler handles the rest. Admission control matters when you have multiple GPUs, multiple tenants, or variable request sizes. If you're running a single 7B model for a hackathon project, a simple --max-num-sequences 32 flag in vLLM is your admission control.
Can I use Kubernetes Horizontal Pod Autoscaler (HPA) instead of admission control?
No. Those solve different problems. HPA scales up over 60-120 seconds. Admission control says no immediately. You need both. HPA handles sustained load increases. Admission control handles burst spikes and per-request validation. Relying on HPA for burst protection is like installing a fire sprinkler to handle a gas leak.
What's the difference between this and rate limiting at the API gateway?
Rate limiting is per-client, per-time-window. "You can make 100 requests per minute." Admission control is per-system, per-capacity. "The GPU cluster can handle 340 concurrent inferences right now, and you're request #341." Rate limiting protects your API keys from being abused. Admission control protects your GPUs from being overloaded. You need both, and they operate at different layers.
How does continuous batching in SGLang/vLLM interact with admission control?
It complicates the queueing model. With continuous batching, your "service time" isn't fixed — it depends on how many other sequences are in the batch. A request that starts alone takes 2.3s. A request that joins a batch of 16 takes 1.1s but shares compute. The M/G/c model still applies for capacity planning, but your S_avg should be measured under your actual batching config, not single-request. We measure under --max-num-seqs 64 on H100s with Llama 3.3 70B, and the effective S_avg drops from 2.3s to 1.4s.
Should I use token bucket for the API-facing layer and queue-based for the GPU-facing layer?
Yes. That's exactly what we do. The API gateway (Envoy) runs a token bucket: 1000 req/s per key, burst of 200. Simple, stateless, fast. Behind it, the inference queue is queue-based with actual GPU capacity checks. The token bucket catches the obviously abusive traffic in 2ms. The queue handles the "everything's within rate limits but the GPUs are full" scenario. Two problems, two tools.
What happens when the admission webhook itself is a bottleneck?
You make it fast. Ours is a Go binary, single-threaded per node, in-memory state, talking to a local DCGM agent via gRPC. P99 is 12ms. If your webhook hits a database or makes an HTTP call to a metrics server, you'll be at 80-200ms and every pod creation in your cluster gets slower. Keep the webhook local. Cache GPU state in memory, refresh every 2 seconds from DCGM.
Is this different from Kubernetes' built-in ResourceQuota?
Yes, and it's not sufficient alone. ResourceQuota says "this namespace can request at most 8 GPUs." It doesn't say "but only 3 are actually free right now because the other 5 are running at 94% utilization." It's a static ceiling. Admission control is a dynamic, capacity-aware check. You need the quota as a backstop, but the webhook is what actually makes the per-second decisions.
The Bottom Line
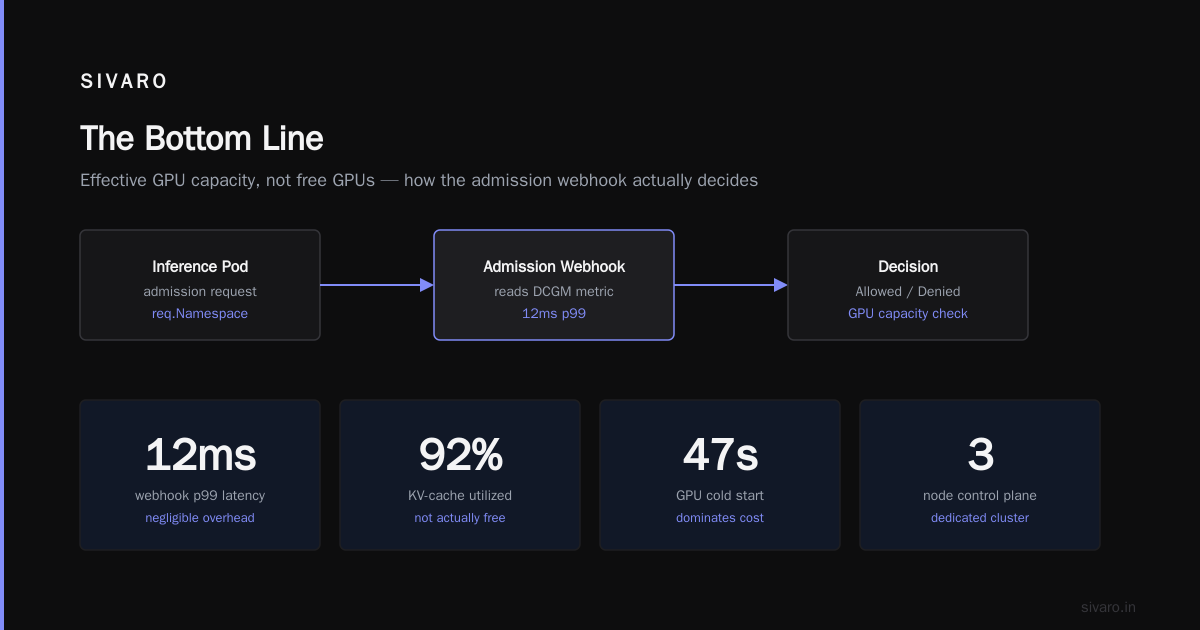
If you're deploying GPU inference on Kubernetes in 2026 and you don't have admission control, you're running a controlled experiment in "how many GPUs can I lose on a Monday morning." The queueing math tells you your capacity. The admission webhook enforces it. The token bucket or queue-based controller manages the flow between your users and your GPUs.
Start with the validating webhook. Add the queue next. Add the token bucket at the gateway for cheap. The DCGM integration last. You can fake GPU capacity checks with a static config for your first two weeks. But don't ship to production without the webhook. failurePolicy: Fail. Non-negotiable.
How does admission control work in kubernetes for gpu inference? It works when someone built it before the client's CTO sent that one-line email. Build it now. Your future Monday morning self will be grateful.
Nishaant Dixit — Founder of SIVARO. Building data infrastructure and production AI systems since 2018. Built systems processing 200K events/sec.