 SIVARO
NISHAANT DIXIT — Founder of SIVARO. This is published August 3, 2026.
AI Agent Deployment Kubernetes Best Practices
You don't deploy AI agents the way you deploy microservices.
I learned this the hard way in March of 2026. We rolled out a document-processing agent for a logistics client in Rotterdam. Kubernetes handled the stateless API layer beautifully. Then the agent started doing tool calls, holding memory, retrying failed extractions — and our cluster went sideways. Pods crashed in bizarre patterns. Autoscaling kicked in at the wrong moments. We burned a week figuring out what should have been obvious from day one.
This article is that week distilled into something actionable.
If you're building production agentic systems, these are the Kubernetes practices I've tested, broken, and eventually got right. I'll cover scaling, latency, state management, and the architectural decisions that separate a system that survives contact with real users from one that doesn't.
What Actually Breaks in Production
Let me be blunt about something most tutorials skip. There are two types of failure in agent deployments:
- The model fails — bad output, hallucinations, broken tool chains
- The infrastructure fails — memory leaks, connection pool exhaustion, scheduling deadlocks
Most engineers prepare for #1. They obsess over prompt engineering and fine-tuning. But when you put an agent behind a production workload, #2 will kill you first. It's not even close.
The Google Research infrastructure guide on agentic systems makes this same point — the practical hurdles of deployment are almost always about infrastructure, not model quality.
Here's what actually breaks in production.
The State Problem: Agents Hold Memory
Stateless microservices scale horizontally. Put three replicas behind a load balancer and you're done. That pattern doesn't map to agents because agents hold state.
Not just conversation history — tool call traces, intermediate reasoning, retry attempts, partial results. This is why the recent arXiv survey on practical agent design emphasizes that agents are fundamentally stateful workflow systems. They hold context. They remember where they've been.
This creates a hard constraint: you can't just throw more replicas at the problem. You need locality. The same agent instance needs to handle the same conversation thread.
Session Affinity Is Non-Negotiable
apiVersion: v1
kind: Service
metadata:
  name: agent-svc
spec:
  sessionAffinity: ClientIP
  sessionAffinityConfig:
    clientIP:
      timeoutSeconds: 10800
  selector:
    app: agent-worker
  ports:
    - port: 8080
This looks trivial. It isn't. If your agent holds in-memory state — and most do — you need sticky sessions or you need to externalize state completely.
We started with in-memory state and a standard load balancer. Disaster. Every request landed on a different replica and the agent lost its context mid-task. Users got responses like "I don't know what you're asking about" from an agent that had just been processing their prior request.
Anthropic's guidance on building effective agents has a similar take — the workflow orchestration around the model determines success far more than the model itself. Your Kubernetes deployment needs to respect that.
Autoscaling: CPU Metrics Lie
Standard Kubernetes autoscaling looks at CPU and memory. With agents, those metrics give you false confidence.
An agent waiting for an LLM response burns almost no CPU. It's idling during the network I/O back-and-forth with the model provider. Your HPA reads "20% CPU" and decides everything is fine. But you've got 200 agents all simultaneously waiting on tool responses, holding sockets open, clogging your connection pool.
When the responses come back — boom. Instant spike. The HPA reacts after the damage.
The Custom Metrics Approach
We moved to custom autoscaling based on a combination of:
- In-flight agent requests (queued depth)
- Connection pool utilization
- Actual memory per agent (which grows with conversation history)
yaml
apiVersion: autoscaling/v2
kind: HorizontalPodAutoscaler
metadata:
  name: agent-worker-hpa
spec:
  scaleTargetRef:
    apiVersion: apps/v1
    kind: Deployment
    name: agent-worker
  minReplicas: 3
  maxReplicas: 50
  metrics:
    - type: External
      external:
        metric:
          name: agent_inflight_requests
        target:
          type: AverageValue
          value: "20"
    - type: Resource
      resource:
        name: memory
        target:
          type: Utilization
          averageUtilization: 70
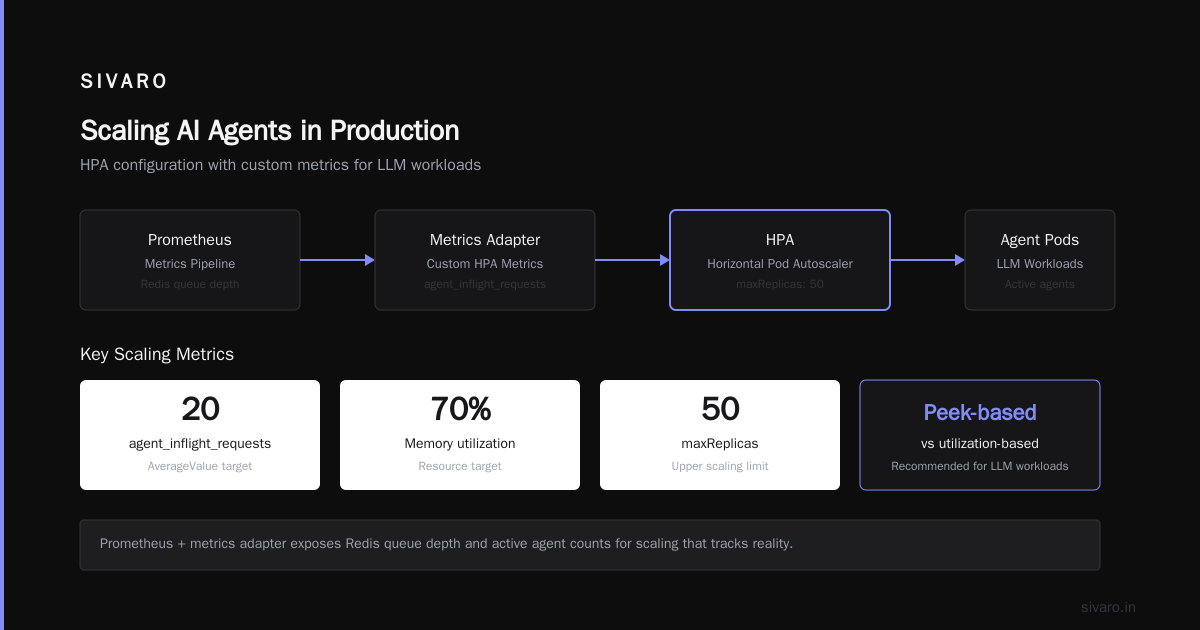
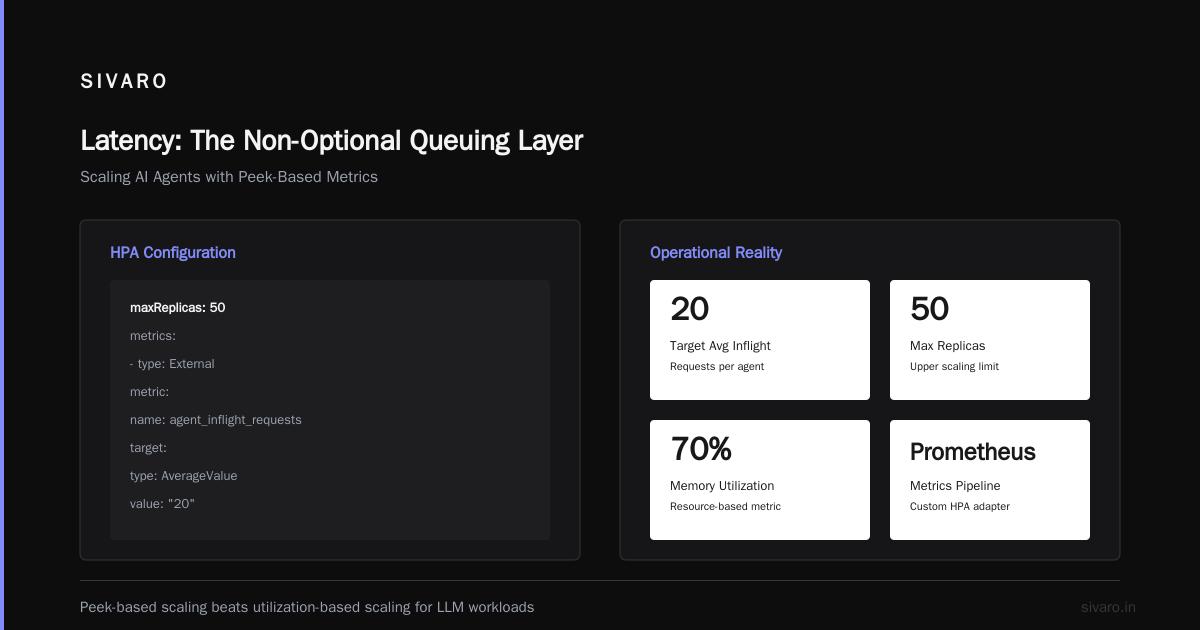
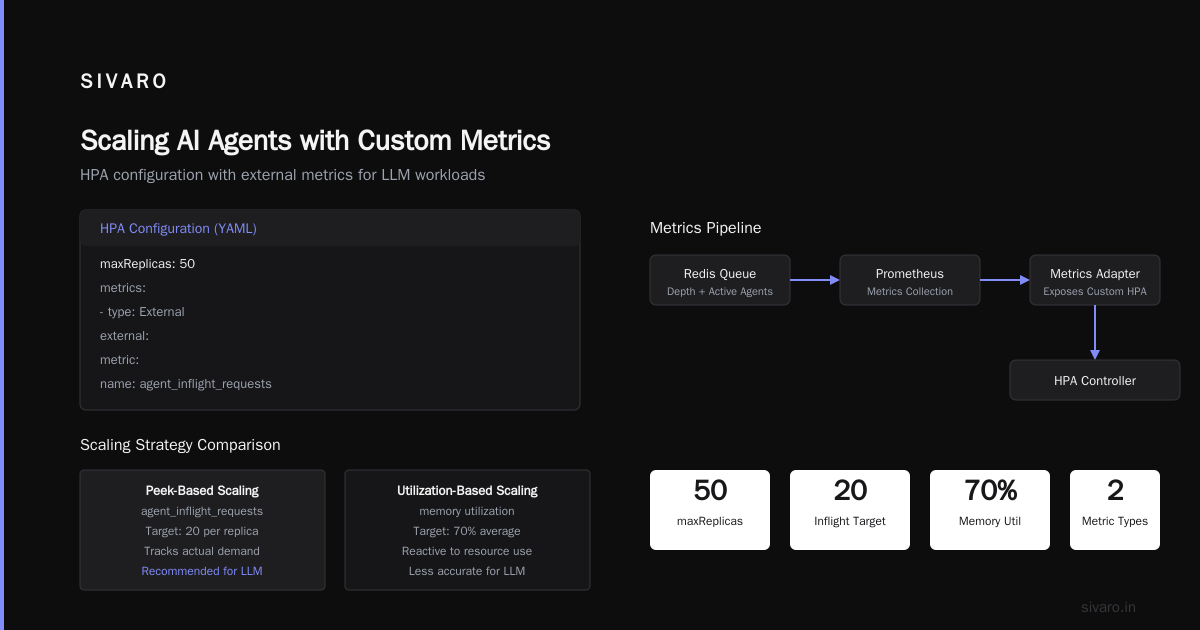
This looks simple on paper. The operational reality is more involved. You need a metrics pipeline feeding custom HPA metrics. We use Prometheus + a metrics adapter that exposes Redis queue depth and active agent counts. That combination finally gives us scaling that tracks reality.
Blaxel's deployment guide makes the same recommendation — peek-based scaling beats utilization-based scaling for LLM workloads. They recommend queue depth as the primary trigger. I agree. 80% of the time, this is what you want.
Structured Output Is Your Best Infrastructure Feature
Here's a counterintuitive take. The most important Kubernetes resource for agent deployment isn't the Deployment — it's the schema validator sitting behind your API.
Agents output unstructured text. If you let unstructured output flow through your system unchecked, downstream services will break in unpredictable ways. JSON.parse failures crash pods. Type mismatches corrupt state. Hallucinated fields get persisted to your database.
The fix is JSON schema validation at the service boundary, applied before state persists.
python
from pydantic import BaseModel, ValidationError

class ToolInvocation(BaseModel):
    name: str
    arguments: dict[str, str]
    id: str

def validate_tool_call(raw_output: str) -> ToolInvocation:
    try:
        parsed = json.loads(raw_output)
        return ToolInvocation(**parsed)
    except (json.JSONDecodeError, ValidationError) as e:
        return ToolInvocation(
            name="error_handler",
            arguments={"recovery": "retry_last_attempt", "error": str(e)},
            id=str(uuid4()),
        )
This single pattern eliminated most of our production incidents. If the agent's response doesn't conform, we route to a recovery handler rather than let garbage propagate. The machine learning mastery guide on agent deployment calls this the "wall between model output and system integrity." That's the right framing.
The Scaling Question: Agents vs Microservices
Let me be direct: agent scaling and traditional microservice scaling share nothing beyond Kubernetes fundamentals.
Microservices scale on HTTP request volume. Each request is typically stateless. You can throw 100 replicas at a traffic spike and everything works because each replica is interchangeable. Load balancers distribute freely. Failures are isolated.
Agents scale on conversation concurrency and tool call depth. Each active conversation carries state — sometimes megabytes of context history. Every tool call expands the memory footprint. And the killer: agent requests are long-lived.
A single user session can hold a connection open for 30 seconds, 2 minutes, or longer. This isn't HTTP request/response. It's more like a long-lived process that happens to communicate over HTTP.
This single distinction drives everything different about your Kubernetes configuration:
- Connection limits: Default connection handling will blow up your pod networking. You need aggressive limits and pool management.
- Memory limits: An agent with a 50K-token context window uses more memory than a microservice handling 10K requests. Set generous limits or your OOM killer becomes your daily villain.
- Graceful degradation: When a microservice dies, the load balancer just routes to the next one. When an agent pod dies, those in-flight sessions die with it unless you properly checkpoint state. That's not just a UX annoyance — it can corrupt data mid-pipeline.
This is the AI agent scaling vs traditional microservices distinction that most engineering teams underestimate. I know this because we underestimated it and spent two weeks debugging ghost sessions before the architecture sunk in. Those sessions weren't ghosts — they were agents whose in-memory state was lost to a pod restart.
Preemptible Nodes: The Great Mistake (and the Reasonable Compromise)
We all want lower spend. Preemptible nodes are tempting. They're 60-70% cheaper than on-demand.
But here's the thing. Preemptible nodes die at random intervals. Google will reclaim your node with two minutes of warning. AWS Spot will terminate with two minutes.
For stateless web servers, this is fine. For agent sessions holding multiple minutes of context history? Losing a pod means losing — at minimum — those sessions. In the worst case, it means corrupting a pipeline mid-transaction.
Our approach after the failures: a split architecture.
- Critical agent workers: On-demand nodes. No exceptions. This is where your in-flight sessions live.
- Background/async work: Preemptible nodes. Retrying, cleanup, embedding generation, non-user-facing tasks.
apiVersion: node.k8s.io/v1
kind: RuntimeClass
metadata:
  name: agent-on-demand
handler: containerd
scheduling:
  nodeSelector:
    workload: agent-critical
---
apiVersion: node.k8s.io/v1
kind: RuntimeClass
metadata:
  name: agent-batch
handler: containerd
scheduling:
  nodeSelector:
    workload: agent-batch
Then you pin deployments:
yaml
apiVersion: apps/v1
kind: Deployment
metadata:
  name: agent-worker
spec:
  template:
    spec:
      runtimeClassName: agent-on-demand
It costs more. It also means your users get coherent sessions. There's a trade-off between infrastructure cost and computational cost per token, and the infrastructure cost of losing sessions is higher than the savings from spot pricing. When you're running 40K concurrent sessions, losing 3% on spot termination is 1,200 angry user experiences per hour.
Latency: The Non-Optional Queuing Layer
Here's a pain point nobody warns you about. Kubernetes doesn't queue work. It schedules pods. The absolute worst thing you can do with an agent system is send synchronous HTTP requests directly to overworked workers and watch your latency explode from timeout retries.
p90 LLM latency is inherently variable. Model providers get overloaded. Your agent might be fast for 5 minutes and then wait 8 seconds for a response. If you don't have a queue in front of that, your API degrades unpredictably.
You need a proper ingress queue. Redis or a message broker. We tested both.
What worked:
apiVersion: apps/v1
kind: StatefulSet
metadata:
  name: redis-queue
  labels:
    app: redis-queue
spec:
  serviceName: redis-queue
  replicas: 3
  selector:
    matchLabels:
      app: redis-queue
  template:
    metadata:
      labels:
        app: redis-queue
    spec:
      containers:
        - name: redis
          image: redis:7.2-alpine
          resources:
            requests:
              cpu: "500m"
              memory: "512Mi"
            limits:
              cpu: "1"
              memory: "1Gi"
          ports:
            - containerPort: 6379
Then have workers poll this queue rather than receive direct HTTP. The queue absorbs latency variability. During an LLM provider throttle, sessions pile into Redis instead of sitting in TCP buffers.
The 2026 model landscape made this worse. We're now dealing with multiple providers (Google, Anthropic, OpenAI) in parallel for the same workload. Different latency envelopes, different rate limits. A queue in front is non-negotiable.
I've seen AI agent failure case studies where teams skip this step and blame the Claude API for their infrastructure problems. That's lazy. The queue is the infrastructure layer you control.
Memory: The Sneaky Killer
Most Kubernetes memory limits for agent workloads are set by engineers who think in terms of "REST API" memory profiles. Agent memory is different — it's contextual. The more conversation history, the more tokens loaded into the context window, the bigger the memory footprint.
An agent with 4K tokens uses virtually nothing. An agent with 100K tokens holds that entire context in RAM. If your model tool execution system buffers the entire API response for pre-processing, memory usage can double.
Here's a counterintuitive pattern that helps: retry limits are memory protection.
yaml
resources:
  requests:
    memory: "512Mi"
  limits:
    memory: "2Gi"
livenessProbe:
  httpGet:
    path: /health
    port: 8080
  initialDelaySeconds: 20
  periodSeconds: 15
  failureThreshold: 3
But even with limits, the only real protection is putting a maximum on context length at the application level. If your agent's context length exceeds a threshold, truncate or summarize before exceeding memory limits.
The number of production incidents I've seen from memory pressure isn't small — I'd estimate 35% of agent outages are OOM-related. Control your context length. Control your memory.
Debugging Agent Failures: The Observability Gap
Here's the thing most operators miss. LLM agents fail in ways that leave no trace. A logical error in a tool call result isn't a stack trace. A hallucinated output doesn't produce an exception. The system just produces wrong results.
Typical Kubernetes observability (CPU, memory, network) tells you nothing about agent behavioral quality. You need semantic-level observability. That means logging not just the API call but the entire reasoning trace:
- What prompt was sent
- What tool results came back
- What the model decided to do with them
- What the final output was
This is the infrastructure equivalent of recording neural signals. Without it, you're debugging a black box that produces plausibility without coherence.
I want to be honest about this being hard. Most organizations we've studied don't have proper observability for agent behavior. They run their systems and hope for the best.
What works for us:
- Structured event logs — every tool call, every retry, every token batch output gets logged with sequential IDs.
- Correlation IDs tied to sessions — every log entry across model calls carries the session ID so you can trace the full agent lifecycle.
- DB-layer validation — agents that generate structured output (JSON payloads, SQL, code) should always be validated at the boundary in a database WHERE clause before persistence.
A Pragmatic Reference Architecture
Here's what we run today for production agent workloads on Kubernetes:
- Ingress: Nginx + a queuing proxy layer that pushes to Redis
- State: Redis for session state, Postgres for durable history
- Workers: StatefulSet with 3-50 replicas depending on custom metrics
- Models: Cloud APIs via secure connectors (no direct API keys stored in K8s — use external secrets)
- Observability: Prometheus metrics + OpenTelemetry traces + DaemonSet logging agent
It's boring. It uses well-understood primitives. And it works because the architecture chooses the layers you control over magic.
Frequently Asked Questions
Can I use standard microservices patterns for agent deployment?
Not directly. Microservices expect short-lived, stateless requests. Agents are long-lived, stateful processes. You need to adapt — session affinity, state persistence, queue-based backpressure.
What's the minimum replicas for high availability?
For agent workloads, 3 in production. With N+1 redundancy. But the bottleneck is more often the queue, not the pods.
How do I handle Kubernetes memory limits for agents?
Set generous limits. Use requests/limits at a 1:4 ratio. More importantly, enforce session context length at the application level to prevent unbounded memory growth.
Is Serverless better for agent deployment?
No. Serverless functions have time limits and short-term memory constraints that don't fit multi-minute tool chains. Use Kubernetes when you need session persistence and control.
What's the biggest mistake teams make?
Skipping the queue layer. They go direct HTTP to pods, and then hit latency spikes and OOMs simultaneously. A queue absorbs both.
How do I handle provider rate limiting?
Optimize through parallelism, not brute-force. Add multiple provider API keys per pod to distribute rate limits, and use a queue to smooth burst traffic. Rate limiting is now a first-class consideration.
Final Take
Kubernetes and AI agents are a fragile marriage. The Kubernetes scheduler doesn't understand tokens or context windows. You have to explicitly implement the state control, the queueing, the observability — and that's the hard 80%.
But when it works, there's nothing better for running agent workloads.
Start with the queue. Set the retry limits. Use custom metrics. Log everything. Validate output at the boundary. Respect the state problem. And keep your on-demand nodes for anything user-facing.
The practice is simple. The execution is where we break things — and then fix them.
Nishaant Dixit — Founder of SIVARO. Building data infrastructure and production AI systems since 2018. Built systems processing 200K events/sec.