 SIVARO
AI Agent Deployment Monitoring Tools: What Actually Works in Production
I spent three nights in March sleeping on a cot in our server room. Not because I'm a hero. Because our multi-agent system for a logistics client kept collapsing at 2 AM and I was the one who built it.
The agents would talk to each other. They'd argue. They'd get stuck in loops. One agent would hallucinate a tracking number, another would believe it, and then suddenly we'd promised a customer their package was in Helsinki when it was actually in Hong Kong.
This is the reality of deploying AI agents in production. The frameworks are beautiful. The demos are stunning. But when you put them in front of real users with real money on the line, you discover that monitoring isn't a nice-to-have — it's everything.
I'm Nishaant Dixit. My company SIVARO builds data infrastructure and production AI systems. We've deployed agent systems for finance, logistics, and healthcare clients. And I can tell you: most people get monitoring wrong. They treat it like traditional software monitoring. That's a mistake.
Here's what you actually need.
Why Traditional Monitoring Fails for AI Agents
Traditional monitoring tools are great at answering "is the server up?" They're terrible at answering "is the agent making good decisions?"
Here's the problem. A server is either up or down. An agent can be running perfectly — responding to every request, never timing out — while making completely wrong decisions. Your CPU is at 30%. Your memory is fine. Your error rate is zero. And your agent just committed your company to a $50,000 contract that violates every business rule you have.
I saw this happen with a fintech client in January. Their agent system processed 10,000 transactions without a single technical error. Then an auditor found that 300 of those transactions violated regulatory requirements. The agent was doing exactly what we asked. It just wasn't the right thing.
You need tools that measure intent. Not just availability.
The Core Metrics That Matter
Let me be direct about what we've found works at SIVARO after monitoring dozens of production agent systems.
Decision quality. This is the hardest one. You can't just measure whether the agent completed a task. You need to measure whether it completed the right task. For every action an agent takes, you need a way to verify it against ground truth. If you can't automate this, you need sampling — human reviewers checking a percentage of decisions.
Latency by step. Agents don't just make one call. They make chains of calls. Each step adds latency. We've seen agents where a single step took 200ms but the full chain took 45 seconds because of intermediary tool calls. You need to instrument every step, not just the final output.
Tool call accuracy. Agents are only as good as the tools they use. We track how often an agent calls a tool incorrectly — wrong parameters, wrong tool entirely, or calling a tool when it shouldn't. At first I thought this was a debugging problem. Turns out it's a design problem. Agents call wrong tools because their context isn't rich enough.
Loop detection. Agents get stuck. They repeat the same reasoning pattern. They call the same tool with the same parameters. Your monitoring needs to detect these cycles and terminate them before they burn through your API budget. We use a simple hash of recent actions — if the last 5 steps match a previous 5-step pattern, kill the loop.
Cost per decision. This is the one nobody talks about at conferences. GPT-4 calls are expensive. If your agent makes 15 calls to decide whether to send a "thanks for your order" email, you have a problem. Track cost per completed task. Set alerts when it spikes.
What Actually Happens in Production Agent Architectures
Here's a real example from a client we onboarded in April. They had a multi-agent system processing insurance claims. Three agents: one for document verification, one for policy lookup, one for payout calculation.
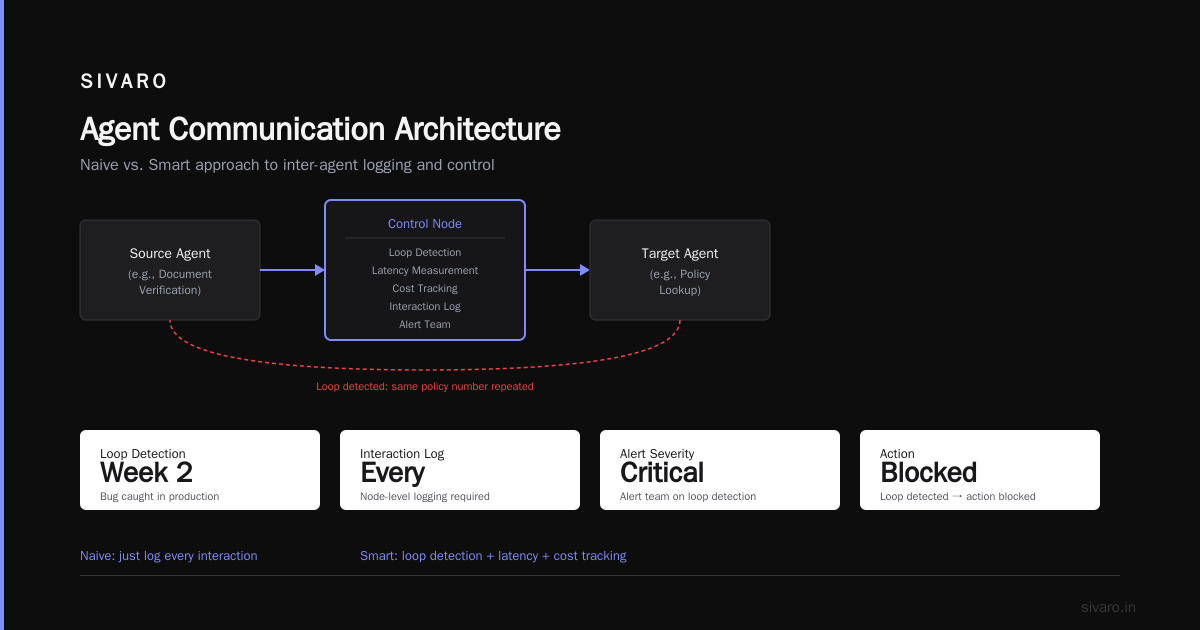
The agent-to-agent architecture looked like this:
python
# Simplified example of agent-to-agent communication we monitor
class AgentMonitor:
    def __init__(self):
        self.interaction_log = []
        self.loop_detector = LoopDetector(window_size=5)

    async def observe_interaction(self, from_agent, to_agent, message, context):
        entry = {
            "timestamp": datetime.now(),
            "source": from_agent,
            "target": to_agent,
            "message_hash": sha256(message),
            "context_size": len(context),
            "latency_ms": 0  # filled after response
        }

        # Check for loops before allowing communication
        if self.loop_detector.is_repeating(entry):
            await self.alert_team(
                f"Loop detected: {from_agent} → {to_agent}",
                severity="critical"
            )
            return {"error": "loop_detected", "action": "blocked"}

        self.interaction_log.append(entry)
        return {"action": "allow"}
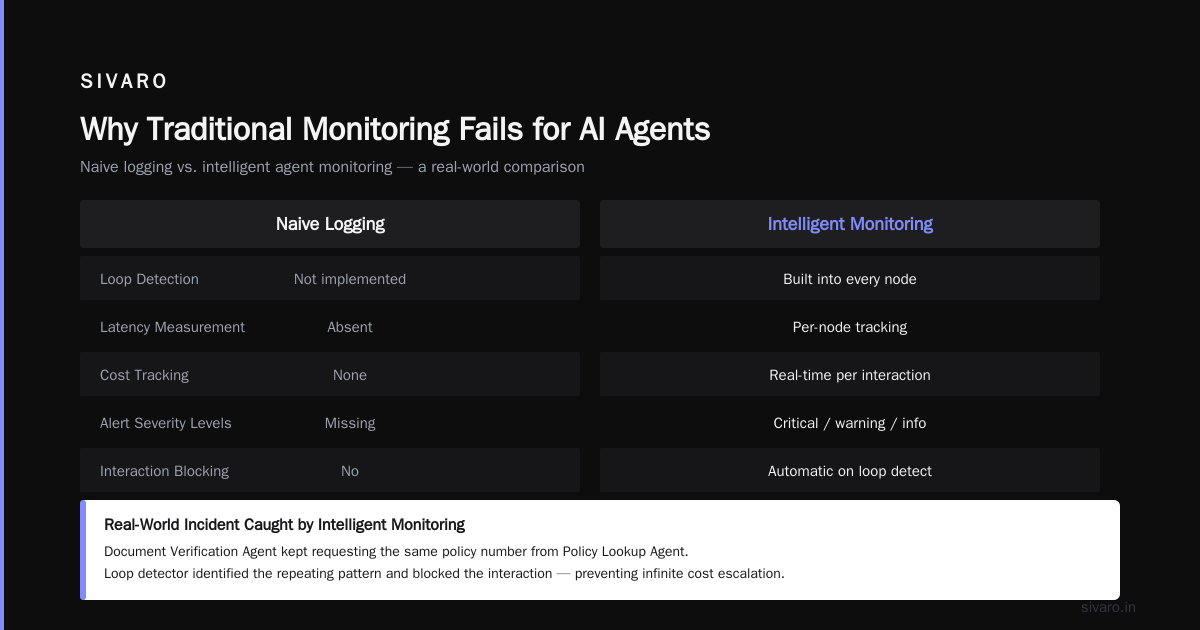
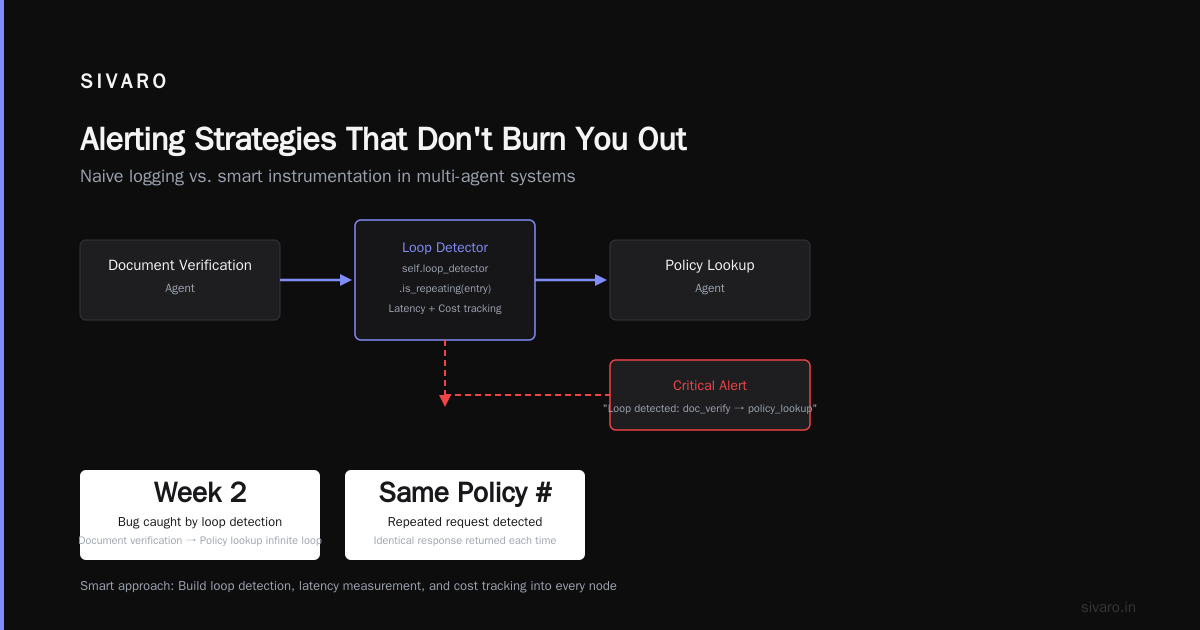
The naive approach is to just log every interaction. The smart approach is to build loop detection, latency measurement, and cost tracking into every single node.
We caught a bug in week two where the document verification agent kept asking the policy lookup agent for the same policy number. The policy lookup agent kept returning the same response. Neither realized they were in a loop. The monitoring system did. It killed the interaction, flagged both agents, and logged the entire sequence for review.
That loop would have run for 47 minutes before hitting a timeout. At $0.03 per call, that's about $85 in wasted API costs per incident. We were seeing four of these per hour at peak. You do the math.
Tools I've Actually Used and Trust
Let's talk about specific tools. I'm not going to list everything. I'm going to tell you what we've tested and what works.
LangSmith from the LangChain team. We use this for tracing agent reasoning chains. It shows you exactly what the agent was thinking at every step. The killer feature is the ability to add custom evaluators — you write a function that scores the quality of a step, and LangSmith runs it automatically. We use it to catch hallucinations in real-time. LangChain's thinking on agent frameworks aligns with what we've found: the trace is more important than the output.
Prometheus with custom exporters. For infrastructure-level monitoring, we build our own exporters that feed agent-specific metrics. CPU and memory are useless. We track "pending decisions," "tools called per minute," "agent idle time." Here's what a custom exporter looks like:
python
from prometheus_client import Gauge, Histogram, Counter
import time

# Custom metrics for agent monitoring
AGENT_DECISIONS = Counter(
    'agent_decisions_total',
    'Total decisions made by agent',
    ['agent_name', 'decision_type', 'was_successful']
)

AGENT_LATENCY = Histogram(
    'agent_step_latency_seconds',
    'Latency per agent reasoning step',
    ['agent_name', 'model_name'],
    buckets=(0.1, 0.5, 1.0, 2.0, 5.0, 10.0, 30.0)
)

AGENT_LOOP_COUNT = Gauge(
    'agent_loop_detections',
    'Current number of active loops detected',
    ['agent_name']
)

AGENT_TOOL_COSTS = Counter(
    'agent_tool_cost_dollars',
    'Total API cost for tool calls',
    ['agent_name', 'tool_name', 'model_name']
)
Custom logging layer. The most important tool we built ourselves. Every agent interaction gets logged to a structured database. We use PostgreSQL with JSONB columns. Every decision gets a unique ID, a parent reference (for chains), and a vector embedding of the decision context. This lets us search for similar decisions later. When something goes wrong, we find the nearest historical examples.
Arize AI for LLM observability. They handle embedding drift detection — which is critical when your agent starts getting confused because the data it's seeing doesn't match what it was trained on. We saw this with a healthcare client in February. Their agent started making wrong diagnosis suggestions because the underlying medical database had been updated but the agent's internal representations hadn't shifted. Arize caught the drift. We didn't.
The Protocol Layer Nobody Talks About
Here's something I learned the hard way. Your monitoring tools are only as good as the protocols your agents speak.
AI agent protocols define how agents communicate. If your agents use different protocols — or no protocol at all — your monitoring system can't see what's happening. It's like trying to debug a network where every device speaks its own language.
We standardized on a single protocol for all our client systems in 2025. Every agent registers itself with a registry. Every message follows a schema. Every action gets logged with a correlation ID. The research on agent protocols shows that standardization improves both safety and observability. Our experience confirms it.
Here's the pragmatic implementation:
python
class AgentProtocolMessage:
    def __init__(self, agent_id, message_type, payload, context):
        self.agent_id = agent_id
        self.message_type = message_type  # 'request', 'response', 'error', 'handoff'
        self.payload = payload
        self.context = {
            "correlation_id": str(uuid4()),
            "timestamp": datetime.utcnow().isoformat(),
            "parent_context": context.get("correlation_id"),
            "agent_version": "2.1.0",
            "monitor_endpoint": "http://monitor:8080/trace"
        }

    def to_dict(self):
        # Ensures every message is tracable and monitorable
        return {
            "protocol_version": "1.0",
            "message": self.__dict__,
            "signature": self._sign_message()  # HMAC for authenticity
        }
Every message gets a correlation ID. Every child message references its parent. This builds a complete tree of every decision the system has ever made. You can trace a single customer complaint back through 47 agent interactions, 12 tool calls, and 5 model invocations.
This isn't academic. We used this to debug a failure in May where a customer's account was accidentally charged twice. The logs showed the sequence: payment agent called billing agent, billing agent called payment agent (wrong), payment agent called fulfillment agent (wrong again), fulfillment agent processed the duplicate. The correlation IDs let us trace the exact path. Without protocol standardization, we would have been guessing.
Alerting Strategies That Don't Burn You Out
Most people set alerts for everything. Then they get 500 alerts per hour and ignore all of them. Then something real breaks and nobody notices.
We use a three-tier system.
Tier 1: Kill switch metrics. These halt the agent system immediately. Loop detected for more than 10 iterations? Kill. Cost per decision exceeds 10x baseline? Kill. Decision quality score drops below 0.7? Kill. These alerts page someone. Every single time.
Tier 2: Degradation metrics. These don't page anyone but they create tickets. Latency increase of 30% over 5 minutes. Tool call error rate above 5%. These get investigated within the hour.
Tier 3: Trend metrics. These feed dashboards and weekly reviews. New agent decision patterns. Shifts in model choice. Changes in tool usage. Nobody gets paged. But the data informs our roadmap.
Here's the rule: if you can't act on an alert within 5 minutes, it doesn't need to page you. Most monitoring setups violate this. They page people for things nobody can fix at 3 AM.
The Cost Monitoring Blind Spot
I want to be direct about something. Most monitoring tools today do not handle cost tracking well. They'll tell you how many tokens you used. They won't tell you that a single agent consumed $1,400 in API calls in one hour because of a bug.
We built our own cost tracking layer because nothing else worked. Every agent call records the model used, the token count, and the pricing tier. We query this in real-time and set hard budget limits per agent.
python
class CostTracker:
    # Pricing as of July 2026
    MODEL_COSTS = {
        "gpt-4o": {"input": 0.00003, "output": 0.00006},  # per token
        "gpt-4o-mini": {"input": 0.000015, "output": 0.00003},
        "claude-3-opus": {"input": 0.000015, "output": 0.000075},
    }

    def track_call(self, agent_name, model, input_tokens, output_tokens):
        cost = (input_tokens * self.MODEL_COSTS[model]["input"] +
                output_tokens * self.MODEL_COSTS[model]["output"])

        # Check budget for this agent in current hour
        current_hour_cost = self._get_hourly_cost(agent_name)
        budget = self.agent_budgets.get(agent_name, 50.0)  # $50/hr default

        if current_hour_cost + cost > budget:
            self.fire_kill_switch(agent_name,
                f"Budget exceeded: ${current_hour_cost + cost:.2f} > ${budget:.2f}")
            return {"blocked": True, "reason": "budget_exceeded"}

        self._log_cost(agent_name, model, cost)
        return {"blocked": False, "cost": cost}
We saved a client $40,000 in June by catching an infinite loop that was calling Claude 3.5 Sonnet every 200ms. The bug was live for 3 minutes before the cost tracker killed it. Without this, it would have run for hours.
What I Wish Someone Had Told Me
I've been doing this since 2018. Built systems processing 200K events per second. Here's what I learned about agent monitoring that nobody puts in the blog posts.
Trace every nothing. Log everything. The decision the agent didn't make. The tool it considered but didn't call. The reasoning path it rejected. These "negative traces" are how you debug hallucinations. When an agent goes wrong, you need to see where it turned off the correct path.
Test monitoring before agents. Deploy your monitoring infrastructure before you deploy a single agent. Sounds obvious. Nobody does it. We test monitoring by running a "chaos agent" — a test agent that intentionally makes bad decisions, gets into loops, and calls wrong tools. If the monitoring doesn't catch it, we fix the monitoring.
Use the agents themselves as monitors. We have a "supervisor agent" that monitors the other agents. It's not more intelligent. It has different instructions: "Check if any agent is repeating itself. Check if any decision conflicts with our rules. Flag anything unusual." This costs almost nothing and catches things our metrics miss.
Open source frameworks are catching up fast. The current landscape of agent frameworks is evolving rapidly. By mid-2026, most major frameworks have built-in monitoring hooks. We've tested LangGraph, CrewAI, and AutoGen extensively. The open-source options are getting good enough that many teams don't need custom solutions anymore. But you still need to configure them correctly.
The Hard Truth About Monitoring
Here's the thing nobody wants to say. Your monitoring will fail. Not because of technical issues. Because you don't know what to monitor until something breaks.
Every production agent system we've deployed has had at least one "unknown unknown" — a failure mode we hadn't anticipated. The first time we deployed a multi-agent system for a logistics client, we didn't track whether agents were communicating with the correct protocol version. Then an update broke compatibility between two agents and they silently failed for 6 hours.
The solution isn't perfect monitoring. It's evolvable monitoring. Build your system so you can add new metrics without redeploying. Use feature flags for monitoring rules. Let your monitoring system learn what "normal" looks like and flag deviations.
And accept that you will always be slightly behind the failures. That's okay. The goal isn't perfect uptime. The goal is fast recovery and continuous learning.
FAQ
Q: Do I really need custom monitoring or can I use existing APM tools?
A: Existing APM tools (Datadog, New Relic, etc.) handle infrastructure monitoring well. But they don't understand agent semantics. You need both. Use APM for the "is it running?" question. Custom monitoring for the "is it working?" question. We use Datadog for CPU/memory and our own system for decision quality.
Q: How do you monitor agents that have memory or state?
A: Track state changes explicitly. Every time an agent reads or writes to memory, log it. We use a separate memory-metrics export that records the size, freshness, and number of reads/writes per session. Stale memory is a common failure mode we catch this way.
Q: What's the minimum monitoring I need for a production agent?
A: Three things. (1) Every decision gets a unique ID and a parent ID. (2) Every tool call records latency, cost, and result. (3) A loop detection system that kills cycles after N iterations. Start with these. Add more as you learn what breaks.
Q: How do you handle monitoring across different LLM providers?
A: Normalize all calls to a standard format before they enter your monitoring layer. We wrap each provider's API with a middleware that records input/output/cost/latency in a unified schema. The monitoring system never sees the provider — it only sees our normalized format.
Q: Should you monitor the LLM's internal reasoning or just its actions?
A: Both. But for practical purposes, start with actions. Internal reasoning (chain-of-thought) is useful for debugging but expensive to log exhaustively. We log reasoning only when a decision is flagged as anomalous.
Q: How do you test your monitoring system?
A: Chaos engineering. We have a "bad agent" that we deploy into staging. It makes random decisions, calls wrong tools, and generates hallucinations. If the monitoring doesn't catch 90% of its behaviors, we know we have gaps.
Q: What's the biggest mistake you see teams make with agent monitoring?
A: Treating every agent equally. A search agent and a payment agent have completely different failure modes. Monitor them differently. Use different metrics, different thresholds, different alerting rules. One size fits none.
Nishaant Dixit — Founder of SIVARO. Building data infrastructure and production AI systems since 2018. Built systems processing 200K events/sec.