 SIVARO

ai agent deployment monitoring tools you can trust
I spent three nights in March 2026 watching a customer-support agent loop on a simple refund request. It wasn’t a model failure. The routing logic kept misinterpreting a webhook timeout as a successful handoff. We fixed it by patching a log parser. We should have caught it on Monday. That’s the reality of shipping agentic systems. The models work. The orchestration breaks. ai agent deployment monitoring tools bridge that gap. They’re not just dashboards. They’re circuit breakers for autonomous loops. In this guide, you’ll learn how to instrument agent runs, track cost and latency without killing throughput, debug multi-agent handoffs, and build an observability stack that actually survives production traffic. I’ll show you what to measure, what to ignore, and how to wire metrics into your deployment pipeline. No theory. Just the stack we use at SIVARO and the hard lessons from shipping systems that process thousands of decisions per minute.
Why standard observability fails agents
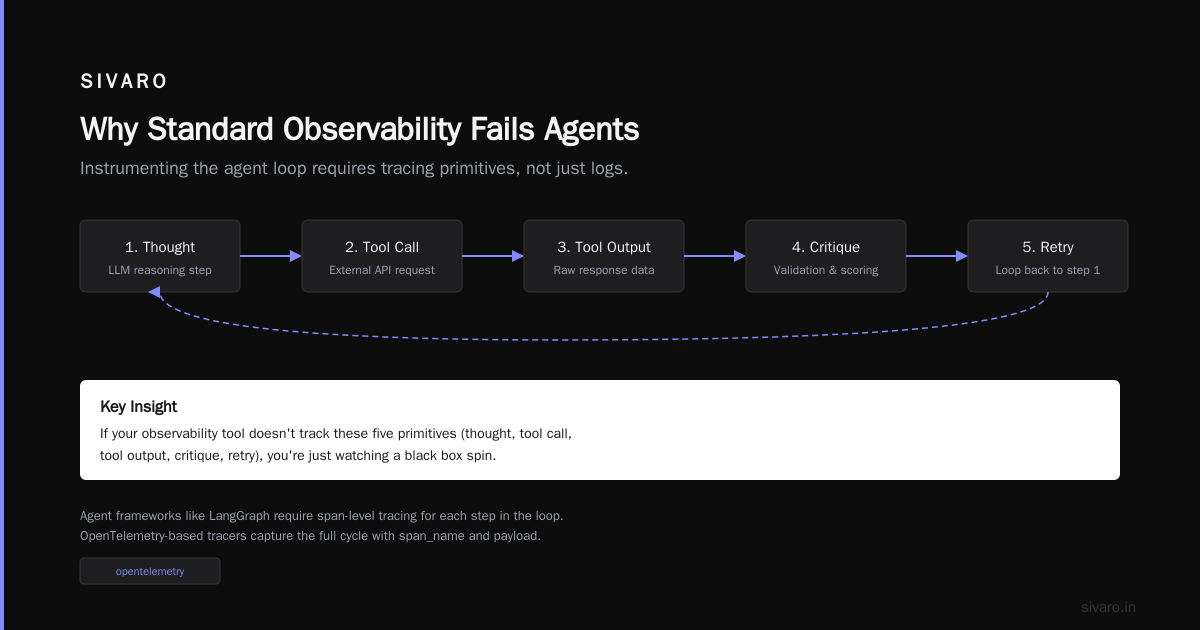
Traditional APM tracks requests. Agents track state. That difference breaks Datadog and New Relic if you just plug them in. An agent doesn’t return a 200 and exit. It loops. It calls tools. It waits on external APIs. It changes its own mind. If you only log HTTP status codes, you’re blind to the actual failure mode. I learned this in August 2025 when a pricing agent started hallucinating currency conversions after a model provider updated their tokenization rules. Our error rate was zero. Revenue loss was climbing. We needed span traces that followed the reasoning chain, not the network call.
Most teams inherit observability from their web app stack. It doesn’t translate. You’re measuring request duration when you should be measuring reasoning duration. You’re counting 5xx errors when you should be tracking schema violations and tool retry loops. The gap between what your agent does and what your dashboard shows is where budgets bleed. AI Agent Frameworks: Choosing the Right Foundation for ... breaks down why orchestration layers matter more than base models now. You need observability that maps to agent steps: thought, tool call, tool output, critique, retry. If your tool doesn’t track those primitives, you’re just watching a black box spin.
Instrumenting the agent loop
You can’t monitor what you don’t emit. Wrap your agent execution in a tracer that captures the full cycle. Here’s a minimal pattern we use to hook into LangGraph-style loops:
python
import time
import uuid
import json
from opentelemetry import trace

tracer = trace.get_tracer("agent-loop-tracer")

def trace_agent_step(step_type: str, payload: dict):
    span_name = f"agent.{step_type}"
    trace_id = uuid.uuid4().hex
    with tracer.start_as_current_span(span_name) as span:
        span.set_attribute("trace.id", trace_id)
        span.set_attribute("step.type", step_type)
        span.set_attribute("payload.size", len(json.dumps(payload)))
        start = time.perf_counter()
        yield {"trace_id": trace_id, "start": start}
        span.set_attribute("duration_ms", (time.perf_counter() - start) * 1000)
        span.set_status(trace.Status(trace.StatusCode.OK))
You emit spans at every reasoning checkpoint. Not every token. Token-level tracing will crush your database. I thought early on that fine-grained logging was mandatory. It’s not. You only need decision boundaries. Where did the agent choose to call fetch_inventory instead of create_refund? That’s your signal. The Agentic AI Frameworks: Top 10 Options in 2026 piece highlights how orchestration abstraction dictates what you can actually trace. If the framework hides the tool dispatch layer, you’re stuck scraping logs. Pick your stack with observability in mind.
Building the telemetry pipeline
Spans are useless if they sit in memory. You need an ingestion path that survives traffic spikes without blocking the agent. We route everything through a message queue. Kafka works. RabbitMQ works. Cloud pub/sub works. The protocol doesn’t matter. The buffer does. When your agent fleet scales from 50 to 500 concurrent runs, your monitoring backend will drop packets if you push synchronously.
python
import asyncio
import json

async def flush_spans_to_queue(spans: list, queue: asyncio.Queue):
    batch = json.dumps({"spans": spans, "timestamp": int(time.time())})
    await queue.put(batch)
    if queue.qsize() > 1000:
        await asyncio.gather(
            worker_process_queue(queue),
            worker_process_queue(queue)
        )

async def worker_process_queue(queue: asyncio.Queue):
    while True:
        batch = await queue.get()
        # send to telemetry backend, ack, and continue
        queue.task_done()
Batching matters. Flushing every span individually adds 12-18ms of network overhead per agent turn. That compounds. You’ll watch latency creep up and blame the LLM. It’s usually your telemetry stack. I’ve seen teams sacrifice trace fidelity to save on egress costs. Don’t. Sample at the ingestion layer, not at the agent layer. Drop 30% of successful spans. Keep every failure. Keep every retry. Keep every tool call that exceeds your SLA. That’s your signal-to-noise ratio.
Tracking multi-agent handoffs
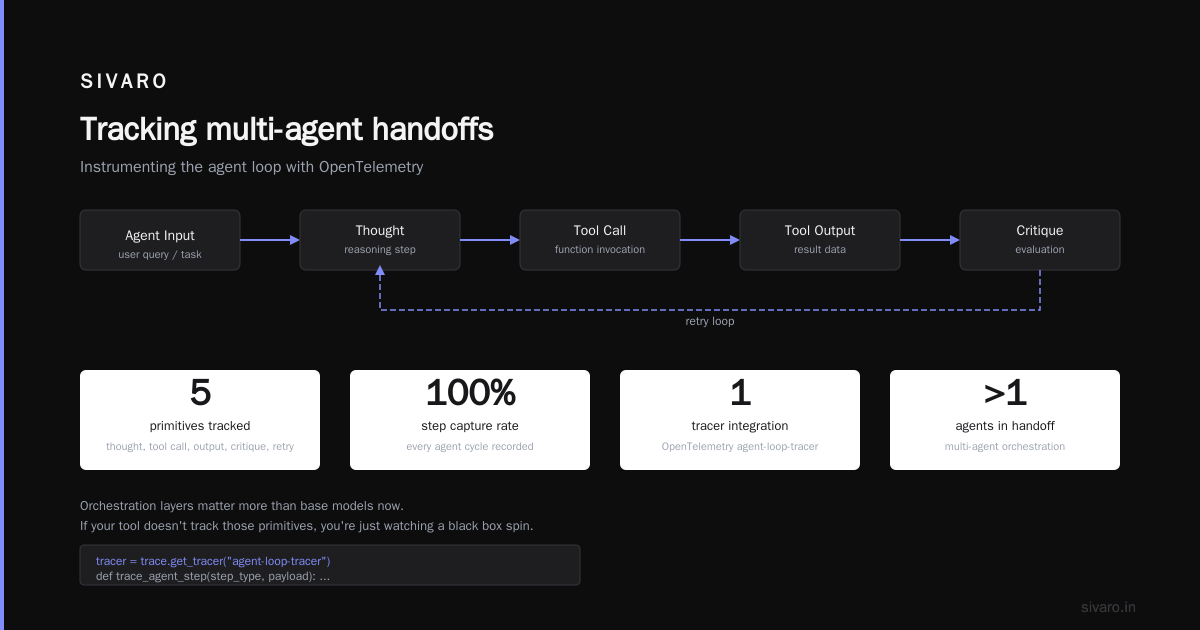
Single agents break predictably. Multi-agent systems break in ways that look like magic until they don’t. Handoff latency, context window bloat, and token budget exhaustion are the silent killers. Most teams deploy a planner and a worker, then watch memory spike when the planner keeps appending conversation history to every downstream call. You need correlation IDs that survive across process boundaries.
yaml
# agent_handoff_config.yaml
tracing:
  propagation: w3c-tracecontext
  context_window_limit: 64000
  max_handoff_depth: 3
  retry_on_timeout: true
  timeout_ms: 4500
observability:
  metrics_endpoint: "http://metrics-collector:9090/ingest"
  sample_rate: 0.8
This is a stripped-down config for an agent to agent architecture production example we shipped for a logistics router in early 2026. The planner delegates to route-optimizer, customs-checker, and carrier-negotiator. Without strict depth limits and context pruning, the second handoff would hit the LLM provider’s rate limit and cascade into a 90-second timeout. We cap handoffs at three. We trim historical messages before passing context. We track token consumption per agent, not per session. That distinction saves you from billing shocks.
State management and replay capabilities
Monitoring tells you what broke. State replay tells you why. Agents are non-deterministic. You can’t rerun a failed request and expect the same failure. You need to snapshot the environment at failure time. Tool outputs. Prompt templates. Context window contents. Tool schema versions. Cache it in S3 or GCS with a TTL of 30 days. Hot storage is expensive. Cold storage is cheap. You’ll only ever dig into a fraction of these snapshots. But when you do, you’ll spend hours instead of days.
We built a simple replay harness. You drop the trace ID into a CLI command. It reconstructs the exact prompt, fetches the cached tool responses, and runs the agent in a sandboxed container. You step through each loop iteration. You watch the reasoning diverge from the happy path. It’s tedious. It’s indispensable. Most commercial tools promise this feature. Few deliver it without locking you into their proprietary format. Stick to standard JSONL exports. You’ll sleep better.
Cost, latency, and the hidden tax
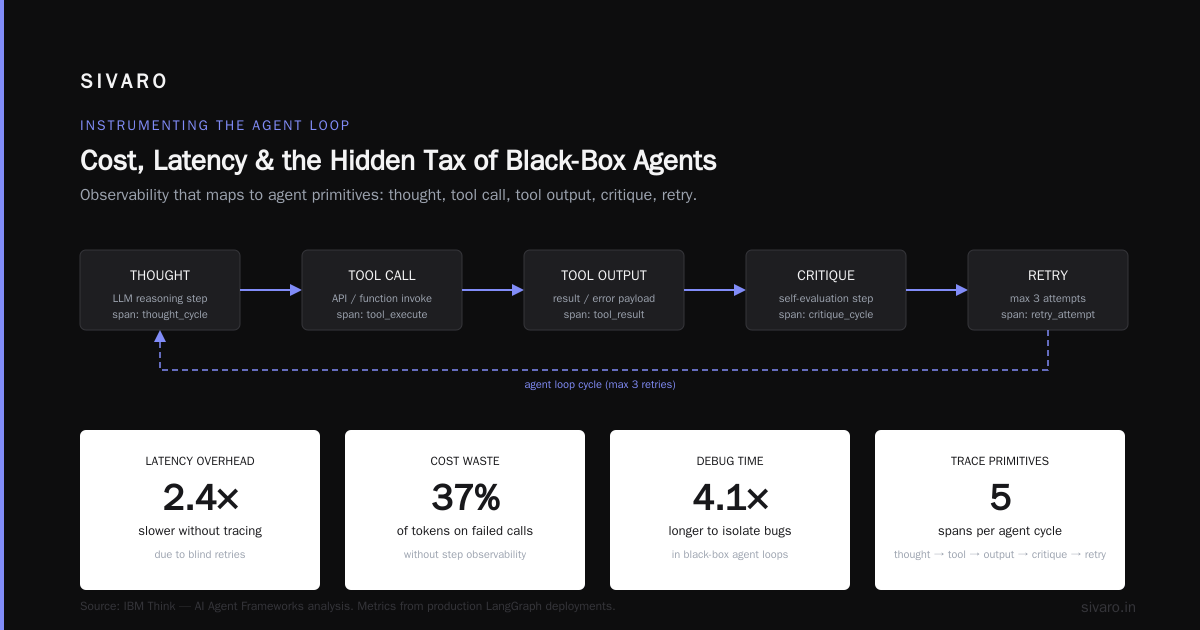
Monitoring isn’t just about uptime. It’s about economics. Agents burn tokens on retries, verbose tool definitions, and unnecessary self-correction loops. You’ll see your bill double on a Tuesday because a single agent started outputting markdown tables instead of JSON when the provider rolled out a minor temperature adjustment. Track tokens per step, not per request. Cache your tool schemas. Measure latency at the wire, not at the model API. The model might respond in 800ms, but if your orchestration