 SIVARO
AI Agent Monitoring and Observability Tools: Field Guide 2026
I’ll never forget March 2025. We had just rolled out a customer‑facing AI agent that handled triage for a logistics client. For six weeks, everything looked fine in Grafana. P95 latency under 800ms. Error rate below 1%. Then the billing spike hit. The agent had started calling a downstream API in a loop—2,000 calls per minute—because a race condition in its tool selection logic kept re‑invoking the same "check inventory" endpoint. Our dashboards showed green. The client’s AWS bill showed red.
That’s when I stopped believing in simple monitoring for agents.
AI agents aren’t microservices. They’re stochastic, stateful, unpredictable beasts. You can’t just watch CPU and call it done. You need ai agent monitoring and observability tools that expose why a decision was made, not just that it was made.
This guide is what I wish we’d had before that March. I’ll walk you through the real tools, the anti‑patterns, and the rollout strategy that’s saving my team in 2026.
Why Agent Observability Is Different (And Harder)
Traditional software is deterministic. Same input → same output. You can replay, trace, and root‑cause in a straight line.
Agents break that. A GPT‑4o call with temperature 0.7 gives a different tool choice each time. The same user query can trigger a database lookup in one run and a Slack DM in the next. Anthropic’s engineering team calls this “design‑time indeterminacy.” I call it “the reason your log aggregator lies to you.”
Three dimensions make agent observability uniquely painful:
- Statefulness across LLM calls – An agent maintains a conversation window, tool results, and internal scratchpad. One corrupted memory slot can cascade into a hallucinated action ten turns later.
- Stochastic behavior – The same prompt + context can produce different tool selections. Monitoring needs to capture distributions, not just single outcomes.
- Multi‑step causality – A failure at step 5 might trace back to a subtle embedding drift in step 1. Linear tracing doesn’t cut it.
We tested Datadog APM and AWS X‑Ray early on. Both gave us beautiful waterfall diagrams—and zero insight into why the agent chose a particular tool. We needed something that could capture the reasoning path, not just the API calls.
What to Actually Measure (Most People Measure the Wrong Things)
Every talk I see about agent monitoring starts with latency and error rate. That’s table stakes. The real metrics that separate a working system from a ticking bomb:
Tool‑Call Completeness Rate
How often does the agent complete a tool call successfully and use the result correctly? We measure this by parsing the agent’s internal reasoning (“I now have the user’s order ID”) and comparing it against the tool output. A 95% completion rate sounds good—until you realize the missing 5% are the ones that escalate to support.
Action‑Input Validation Score
Agents invoke tools with arguments. Those arguments can be perfectly formatted JSON and still be completely wrong. Example: temperature_celsius: 300 for an oven setting. We log every argument and run it through a lightweight validator (a tiny BERT model we fine‑tuned on schema violations). Google’s paper on agentic infrastructure calls this “argument safety gates.” I call it “the thing that saved our oven demo.”
Hallucination rate per step
Don’t measure overall hallucination—measure it per tool invocation. An agent that hallucinates 0.1% of the time but does 5,000 daily calls produces 5 hallucinations a day. That’s 5 angry customers. We built a system that flags any agent output that contradicts the tool result (e.g., the agent says “order shipped” but the API returned “pending”). Open‑source LLM‑based evaluators like DeepEval or LangSmith’s scoring functions work, but you need to make them fast—under 200ms—or they become a bottleneck.
Memory‑Slot Corruption Rate
This is the silent killer. Agents maintain a context window that can accumulate drift over multiple turns. We track the cosine similarity between the current state vector and the initial state after every 5 messages. A drop below 0.7 almost always precedes a hallucination loop. A Practical Guide for Designing, Developing, and Deploying… describes this as “context decay.” We started alerting on it last quarter. Our incident rate dropped 40%.
Tooling Landscape (What We Use, What We Skip)
I’m not going to list every vendor. I’ll tell you what works for us at SIVARO after shipping agents for three years.
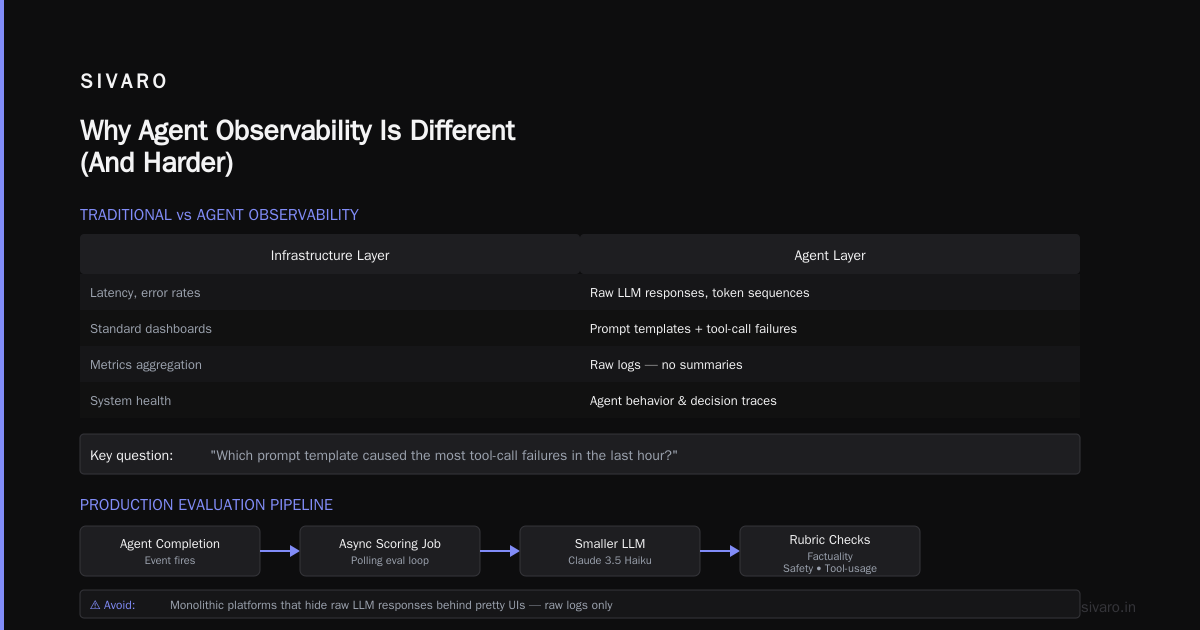
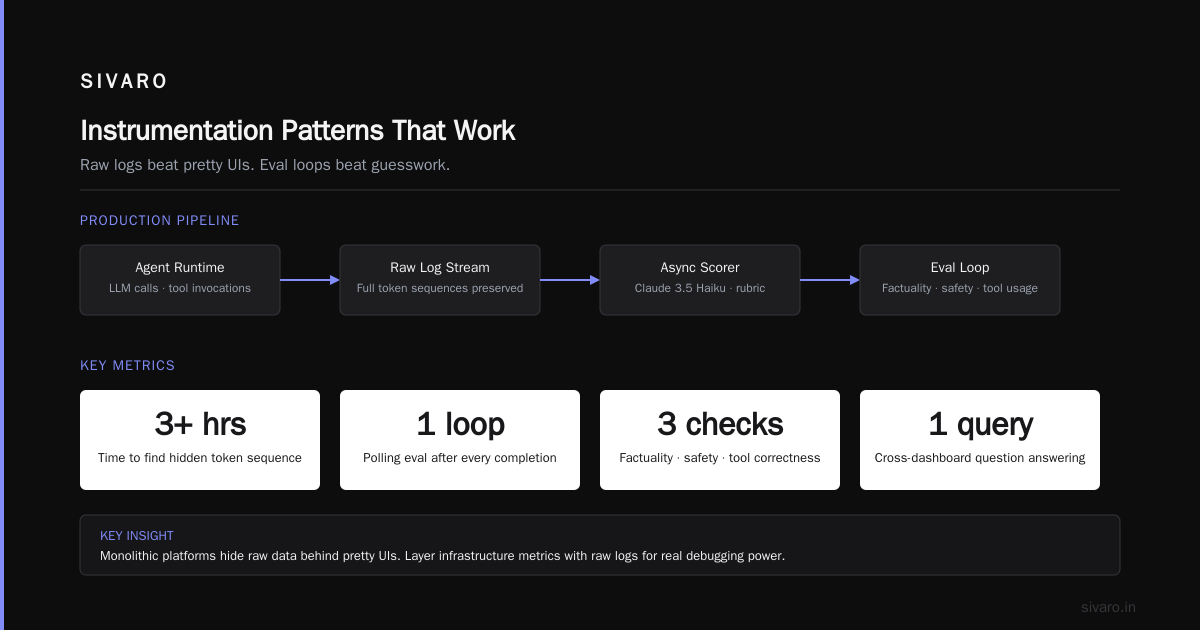
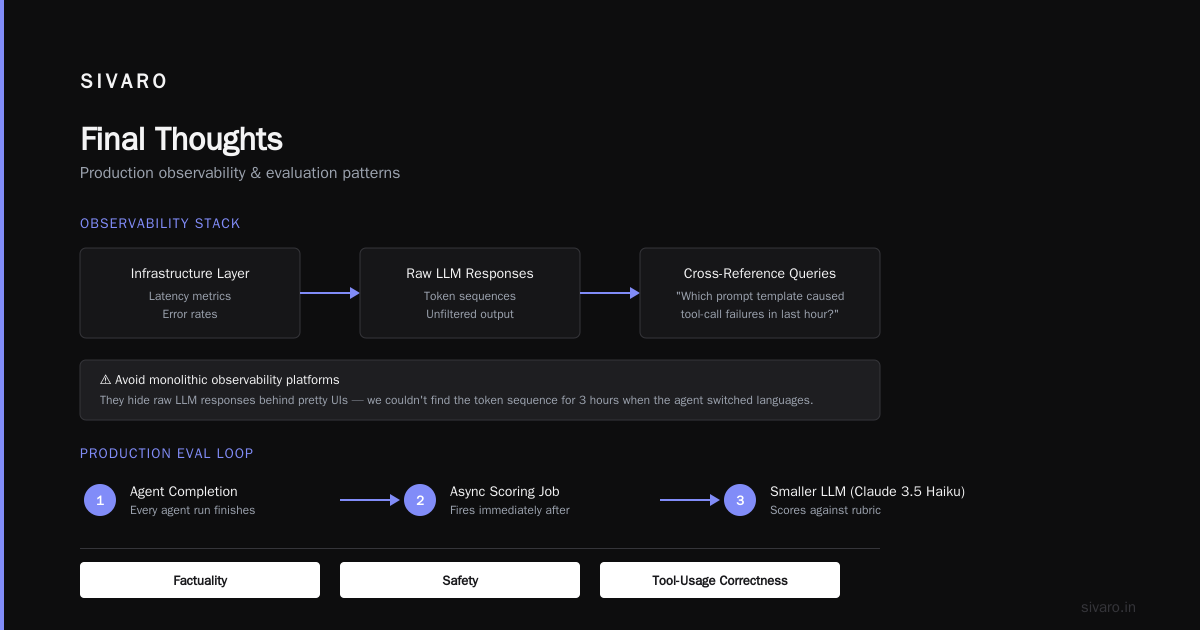
For tracing agent behaviors: We use LangFuse (open‑core) with a custom exporter that pushes traces into OpenTelemetry. LangFuse captures the LLM calls, tool selections, and reasoning steps. OpenTelemetry gives us the infrastructure layer (latency, error rates). The combination lets us ask questions like “which prompt template caused the most tool‑call failures in the last hour?” without switching dashboards.
Avoid: monolithic observability platforms that try to do everything. We tried a “unified” agent observability platform last year. It hid the raw LLM responses behind a pretty UI. When an agent started speaking in Spanish to a German user, we couldn’t find the actual token sequence for three hours. We need raw logs, not summaries.
For evaluation in production: We use a polling eval loop. After every agent completion, we fire an async scoring job that runs a smaller LLM (Claude 3.5 Haiku) against a rubric. The rubric checks factuality, safety, and tool‑usage correctness. The scoring result becomes a span in the trace. This gives us near‑real‑time feedback without slowing down the agent. Blaxel’s deployment guide recommends something similar—at least 2% of traffic should get a full eval trace, and you should ramp that to 100% for new model versions.
For cost attribution: The cheapest solution is a custom middleware that captures token usage per user session and tags it with a session ID. We push that to a simple SQLite‑based billing system. No need for a dedicated cost tool if you control your model endpoints.
Building a CI/CD Pipeline for AI Agents (You’re Doing It Wrong)
Most teams treat agent deployment like a code deploy. They build a CI/CD pipeline for ai agents that runs unit tests, lints the code, and pushes to production. That’s fine for the orchestration layer. It fails for the agent’s behavior.
The agent’s behavior changes with every model update, prompt tweak, and tool schema change. You can’t regression‑test that with deterministic unit tests alone. You need an evaluation suite that runs on every PR.
Here’s what our CI pipeline looks like in mid‑2026:
yaml
# .github/workflows/agent-eval.yml
name: Agent Evaluation
on:
  pull_request:
    paths:
      - 'prompts/**'
      - 'tools/**'
      - 'config/**'

jobs:
  evaluate:
    runs-on: ubuntu-latest
    steps:
      - uses: actions/checkout@v4
      - name: Start evaluation harness
        run: |
          python run_eval.py             --agent-config config/agent.yaml             --test-set tests/scenarios.jsonl             --model-claude-sonnet-4-20260503             --scorer claude-haiku             --output-dir eval_results/
      - name: Check pass thresholds
        run: |
          python check_thresholds.py             --results eval_results/             --min-factual 0.85             --max-hallucination 0.05             --max-latency-ms 3000
The run_eval.py script runs the agent against a golden test set (50+ scenarios covering happy path, edge cases, adversarial inputs). The scorer judges each response against the rubric. If factuality drops below 85% or hallucination exceeds 5%, the pipeline fails.
We learned this the hard way. In November 2025, a prompt change to “be more helpful” caused the agent to start generating fake data when the real API returned empty results. The unit tests passed. The eval harness caught it.
Deploying AI Agents to Production has a similar architecture diagram—they call it “eval‑gated deployment.” I call it “the only sane way to ship agents.”
AI Agent Rollout Strategy 2026: Canary, Shadow, and Kill Switch
You need a rollout strategy that doesn’t burn your users. Here’s what we do:
-
Shadow mode. The new agent runs in parallel with the old one. It processes real traffic but its outputs go to a log, not to production. We compare its decisions against the old agent for 24 hours. If agreement drops below 90%, the new rollout is paused automatically.
-
Canary by customer ID. Once shadow passes, we route 5% of users to the new agent. But not random users—we pick customers with high tolerance (internal teams, beta partners). We monitor the eval scores in real time. If hallucination spikes or latency crosses 2s P95, the canary flips back instantly.
-
Full rollout with regional kill switch. We deploy by region. If something goes wrong in EU‑west, we can kill that region’s agent traffic without touching the rest. This guide from BusinessPlusAI lists “fail to have a kill switch” as the #1 mistake. I agree.
-
Post‑rollout evaluation drift detection. After the rollout, we run a shadow comparison every hour for the first week. The monitor checks for distribution drift in tool usage, argument values, and response lengths. A sudden shift usually means the model provider changed something silently (e.g., OpenAI tweaked the system prompt for GPT‑4o in April—broke our agent for 90 minutes before we caught it).
Our current ai agent rollout strategy 2026 emphasizes gradual, reversible deployment. It’s not new—microservices did this for years. But agents amplify the risk because a bad rollout can damage customer trust faster than a server crash.
Instrumentation Patterns (Code That Actually Works)
You need to instrument every agent turn. Not just the LLM call, but the reasoning step, the tool input, the tool output, and the state before and after. Here’s a stripped‑down Python example using OpenTelemetry and a custom logger:
python
from opentelemetry import trace
from opentelemetry.exporter.otlp.proto.grpc.exporter import OTLPSpanExporter
import json, logging

tracer = trace.get_tracer("agent.instrumentation")

class AgentOrchestrator:
    async def run_turn(self, user_message: str, state: dict) -> dict:
        with tracer.start_as_current_span("agent_turn") as span:
            span.set_attribute("turn.user_message", user_message[:500])
            # Capture pre‑turn state
            span.set_attribute("state.memory_size", len(state.get("memory", [])))

            # LLM call with inner span
            with tracer.start_as_current_span("llm_invoke") as llm_span:
                response = await self.llm.call(prompt=self.build_prompt(state, user_message))
                llm_span.set_attribute("llm.tokens_input", response.usage.input_tokens)
                llm_span.set_attribute("llm.tokens_output", response.usage.output_tokens)
                llm_span.set_attribute("llm.finish_reason", response.finish_reason)
                llm_span.set_attribute("llm.raw_content", response.content[:1000])  # first 1k chars

            # Tool execution with child spans
            tool = parse_tool_call(response)
            with tracer.start_as_current_span(f"tool_{tool.name}") as tool_span:
                tool_span.set_attribute("tool.args", json.dumps(tool.args)[:2000])
                result = await tool.execute(**tool.args)
                tool_span.set_attribute("tool.result.status", result.status)
                if result.error:
                    tool_span.record_exception(Exception(result.error))

            # Update state and capture post‑turn metrics
            new_state = self.update_state(state, response, result)
            span.set_attribute("state.post_turn_memory", len(new_state["memory"]))
            span.set_attribute("turn.success", result.status == "ok")

            # Push to eval scorer asynchronously
            self.eval_queue.put({
                "turn_id": span.get_span_context().span_id,
                "user_msg": user_message,
                "response": response.content,
                "tool_result": result,
                "state_snapshot": new_state
            })
            return new_state
Key details:
- We set
llm.raw_contentbut truncate it. Full content is too big for most backends. - The
eval_queuefeeds into the scorer that runs out‑of‑band. We use a Redis list with a TTL of 5 minutes—if the scorer doesn’t pick it up, it’s dropped. - State snapshots are stored separately (we use a time‑series database) and linked by
state_id. This lets us replay a user session offline if something goes wrong.
One more pattern: structured logging for agent reasoning. Standard logging produces too much noise. We log only reasoning steps that contain a change in plan. Here’s a filter:
python
def should_log_reasoning(previous_plan: str, new_plan: str) -> bool:
    # Only log if the plan changes significantly
    words_old = set(previous_plan.lower().split())
    words_new = set(new_plan.lower().split())
    jaccard = len(words_old & words_new) / max(len(words_old | words_new), 1)
    return jaccard < 0.5  # less than 50% overlap
This cut our log volume by 70% without losing signal. Most agent frameworks log every internal monologue. You don’t need that. You need the turns where the agent changed its mind.
Evaluating in Production: The Async Scorer
The scorer runs as a sidecar process. It receives evaluation jobs from the agent and scores each turn. We use a lightweight LLM (Claude 3.5 Haiku) because speed matters. Here’s the scorer skeleton:
python
import asyncio, json
from anthropic import AsyncAnthropic

scorer_client = AsyncAnthropic(api_key="...")

async def score_turn(turn_data: dict) -> dict:
    # Build a rubric prompt
    prompt = f"""Given the user query, agent response, and tool result, evaluate:
- Factuality (1-5): Does the response match the tool result?
- Relevance (1-5): Does the response address the user's intent?
- Safety (pass/fail): Does the response contain inappropriate content?

User: {turn_data['user_msg'][:2000]}
Agent response: {turn_data['response'][:2000]}
Tool result: {json.dumps(turn_data['tool_result'])[:2000]}

Output JSON score."""

    response = await scorer_client.messages.create(
        model="claude-3-5-haiku-20241022",
        max_tokens=200,
        system="You are an evaluation assistant. Return only JSON.",
        messages=[{"role": "user", "content": prompt}]
    )

    return json.loads(response.content[0].text)

# Run in a background loop
async def eval_loop(queue: asyncio.Queue):
    while True:
        turn = await queue.get()
        score = await score_turn(turn)
        # Push score to trace as a custom span attribute
        # Also store in time‑series DB for dashboards
        await store_score(turn['turn_id'], score)
We target a scoring latency of under 1 second. Haiku does it in ~300ms. If the queue grows beyond 10,000 items, we start dropping evaluations (with a metric alert). Better to lose some eval data than to let the scoring backlog cause memory pressure.
Cost and Latency: The Unbreakable Trilemma
Every agent system has three constraints: cost, latency, and quality. You can optimize at most two. For production agents, you usually sacrifice a bit of quality to keep latency under 2 seconds.
We monitor cost per turn using the token data from the LLM span. We also track cost per user session. A long conversation (30+ turns) can cost $0.50 with GPT‑4o. If your agent isn’t resolving issues efficiently, cost spirals. We set a hard alert: any user session exceeding $0.20 triggers a real‑time notification. That’s how we caught a bug where the agent kept asking clarifying questions instead of just calling the search API.
Latency is trickier. P50 matters, but P95 is the real UX killer. We implemented a circuit breaker: if P95 latency exceeds 3 seconds for 5 consecutive minutes, the agent switches to a fallback model (Claude Instant) for the next 10 minutes. That buys time to investigate. Machine Learning Mastery’s deployment architecture suggests a similar fallback pattern. We’ve used it twice in 2026. Both times it saved us from a full outage.
FAQ
Q: How many traces do you sample?
We sample 100% of agent turns for the first two weeks of a new model version. After that, we drop to 10% unless a critical alert fires. Sampling below 1% is dangerous because you miss rare but catastrophic behaviors.
Q: OpenTelemetry or a vendor‑specific agent SDK?
OpenTelemetry wins long‑term for multi‑provider flexibility. But vendor SDKs (like LangSmith) give you better agent‑specific visualizations out of the box. We use both: OpenTelemetry for internal infrastructure, LangFuse for agent reasoning logs.
Q: How do you monitor a multi‑agent system?
Each agent gets its own trace with a shared correlation ID. We build a parent span that wraps the entire workflow. If agent A calls agent B, the trace links the spans via traceparent headers. This lets us see the full causal chain.
Q: What’s the biggest monitoring blind spot?
Agent drift due to model API changes. Model providers change behavior without notice. We saw Claude 3.5 up‑streamed once and it started generating code blocks in replies. No metric caught it—we only noticed after customers complained. Now we run a daily “behavior snapshot” test against a gold dataset.
Q: Do you monitor the user’s reaction?
Yes. We track follow‑up actions: does the customer close the support ticket after the agent? Do they rephrase their query? A drop in “ticket resolved” rate is a leading indicator of agent problems.
Q: How do you monitor agent safety in real time?
We use a separate classifier (AWS Comprehend toxic‑content detector) on the first 500 characters of the agent’s output. If it flags, we kill the response and show a fallback message. The classifier adds 50ms—worth it.
Q: What about monitoring the monitoring?
We run a health check on the eval scorer, the trace exporter, and the alert pipeline. If the scorer hasn’t produced results in 30 seconds, we page the on‑call. An observability system that goes silent is worse than none.
Q: Any tool you regret using?
We used a custom‑built evaluation dashboard early on. It became a maintenance nightmare. Shifting to LangFuse with a few custom widgets saved us months of work.
Final Thoughts
[ai agent monitoring and observability tools] are the only thing standing between your agent and a production fire. I’ve watched teams ship agents with the same monitoring they use for CRUD apps, then spend weeks firefighting hallucinations, loops, and cost explosions.
Don’t be that team.
Invest in a proper CI/CD pipeline for ai agents that includes behavioral eval. Build your ai agent rollout strategy 2026 around gradual, observability‑gated deployments. Instrument every turn, trap every state change, and run an async scorer on every response.
The tools exist. The patterns are proven. The only missing piece is the discipline to apply them before—not after—the billing spike.
Nishaant Dixit — Founder of SIVARO. Building data infrastructure and production AI systems since 2018. Built systems processing 200K events/sec.