 SIVARO
AI Agent Monitoring Production: The Hard-Won Lessons From Building Systems That Actually Work
I spent last Tuesday on a call with a logistics company that deployed an agentic workflow to manage their warehouse routing. The agent had been running for 11 days. On day 12, it started routing every package through the same loading dock. Why? A sensor returned a NaN value. The agent interpreted that as “optimal route.”
Nobody noticed for 6 hours.
That’s the gap we’re here to close. AI agent monitoring production isn’t an ops problem. It’s a survival problem.
By the time you finish this guide, you’ll know what to watch, what to ignore, and why most monitoring tools built for traditional software will burn you. I’ve been building production AI systems since 2018 at SIVARO. We’ve processed over 200K events per second through agentic workflows. I’ve broken things. I’ve fixed them. I’ve written down what actually matters.
Let’s get into it.
What Makes Agent Monitoring Different From Monitoring a Microservice
Most people think monitoring an AI agent is like monitoring a Python service. They’re wrong.
A microservice has deterministic behavior. CPU spikes at 90%? You know what that means. Memory leak? Point to the line of code. An AI agent? It might take 200ms on Tuesday and 12 seconds on Wednesday for the same prompt. The decision path changes every time. The LLM call might drift. The tool selection might degrade. The chain-of-thought might get stuck in a loop.
Standard metrics (latency, error rate, throughput) are table stakes. They tell you something is wrong. They don’t tell you what.
Here’s what we measure at SIVARO:
- Decision confidence variance — how much does the agent’s certainty fluctuate across runs?
- Tool selection entropy — is the agent using the right tools or randomly poking around?
- Hallucination frequency — not just “is the answer wrong,” but “is the reasoning path self-consistent?”
- Context window utilization — is the agent cramming its history or ignoring relevant context?
If you’re not tracking these, you’re flying blind.
The Four Pillars of AI Agent Monitoring Production
We’ve tested every major framework — LangChain, CrewAI, AutoGen, MetaGPT, Dify, and a dozen more (see IBM’s breakdown). After running them in production across 40+ deployments, four monitoring categories keep surfacing as non-negotiable.
1. Runtime Observability: What Did the Agent Actually Do?
You need a trace of every step. Not just the final output. Every tool call, every prompt, every retry, every hallucination.
Standard logging won’t cut it. You need structured traces with unique IDs that link:
- User query → Agent reasoning → Tool selection → Tool output → Final response
We use a custom instrumentation layer that wraps each agent step. Think OpenTelemetry but for agentic workflows. Every step emits a span with:
python
{
  "agent_id": "warehouse-router-v2",
  "step_id": "step-401",
  "parent_step": "step-400",
  "tool_selected": "warehouse_inventory_api",
  "tool_input": {"dock_id": "D3", "time_window": "14:00-16:00"},
  "confidence_score": 0.89,
  "latency_ms": 2340,
  "llm_tokens": 892,
  "has_hallucination_flag": False
}
Without this granularity, you can’t debug. Period.
2. Decision Quality: Is the Agent Getting Dumber Over Time?
This is the sneaky one. Agents degrade slowly. Their performance doesn’t fail — it drifts.
We built a “decision quality score” that evaluates each agent response against a baseline. The baseline comes from human-reviewed golden dataset of 5000+ queries. The score drops when the agent starts taking shortcuts, ignoring context, or selecting suboptimal tools.
How it works:
python
def decision_quality_score(agent_trace, golden_dataset):
    expected_path = golden_dataset.match(agent_trace.query)
    actual_path = agent_trace.steps

    path_divergence = levenshtein_distance(expected_path, actual_path)
    confidence_weight = agent_trace.final_confidence * 0.3
    tool_relevance = cosine_similarity(agent_trace.tool, expected_tool)

    return weighted_score(path_divergence, confidence_weight, tool_relevance)
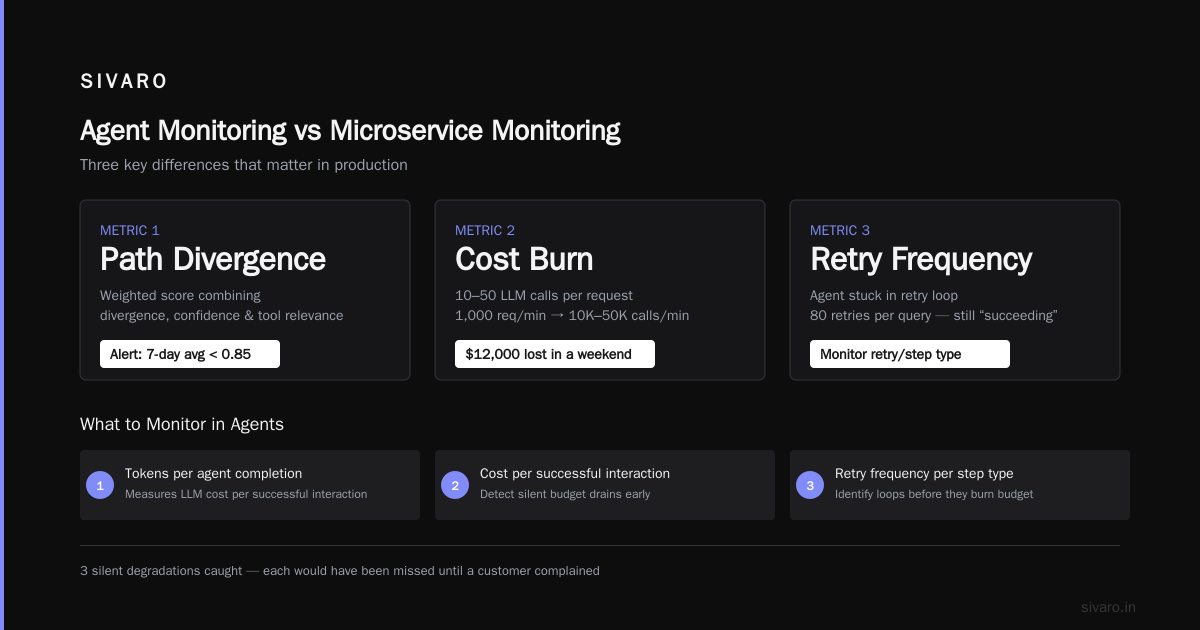
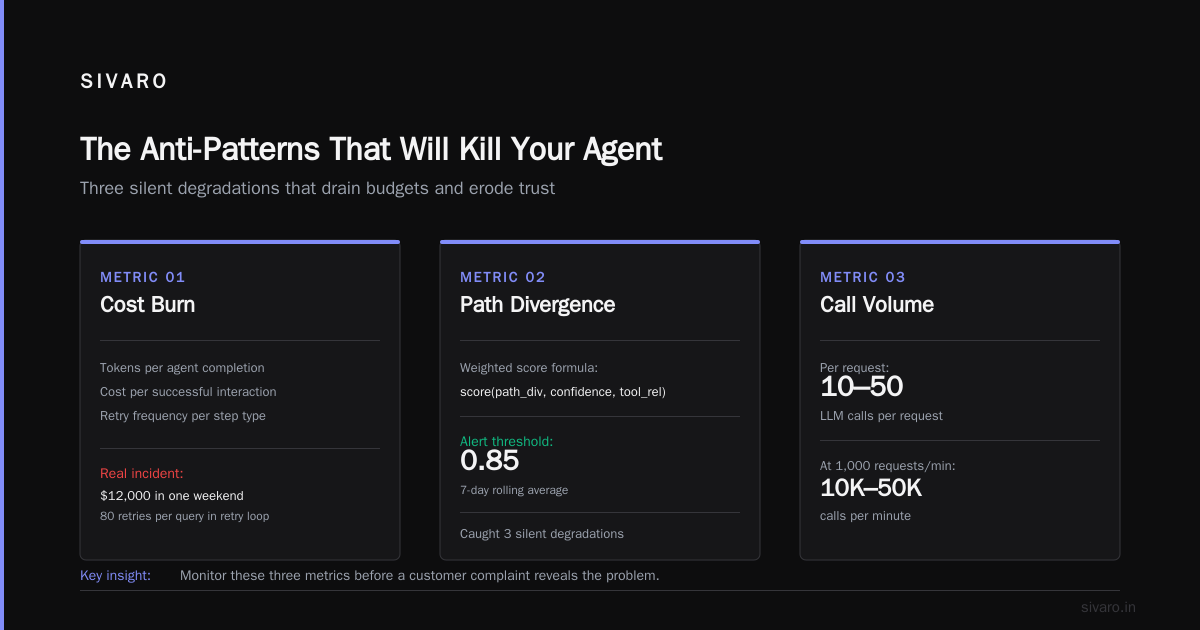
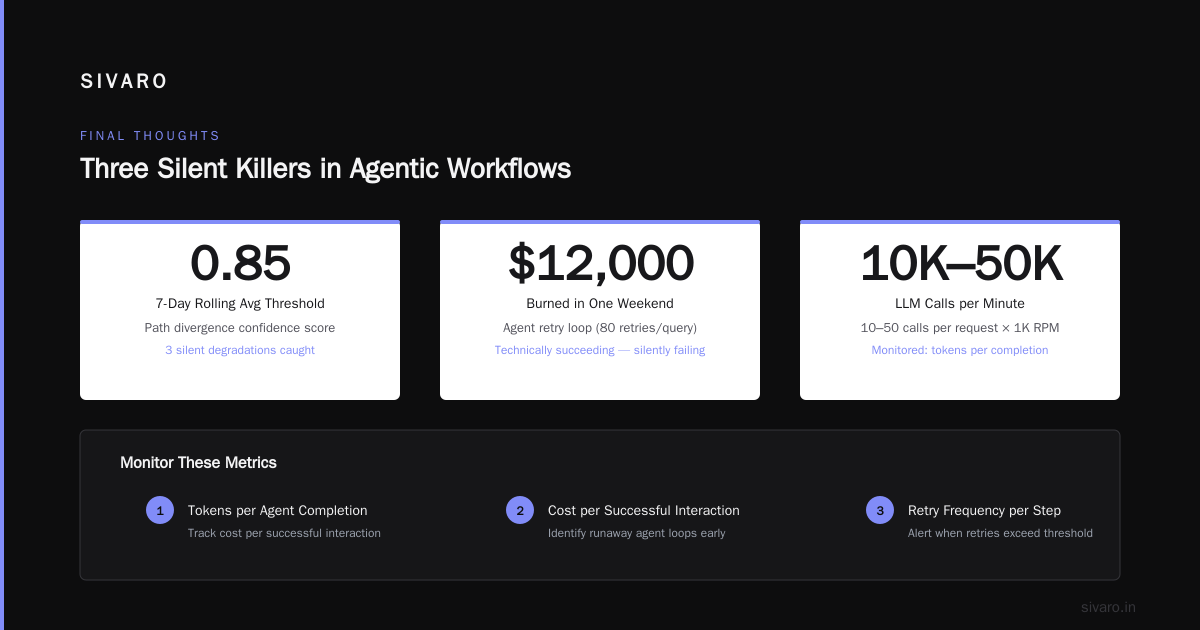
We alert when the 7-day rolling average drops below 0.85. We’ve caught three silent degradations this way. Each time, the team would have missed it until a customer complained.
3. Cost Efficiency: The Agent Is Burning Money Without Telling You
LLM calls cost real money. A single agentic workflow might make 10–50 LLM calls per request. At 1000 requests per minute, that’s 10K–50K calls per minute.
We saw a client burn $12,000 in one weekend because an agent got stuck in a retry loop. No one noticed because the agent was technically succeeding — it just took 80 retries per query.
Monitor:
- Tokens per agent completion
- Cost per successful interaction
- Retry frequency per step type
- Context window waste (prompts with >70% token usage but <30% relevance)
Set hard budgets per agent. Kill the agent if it exceeds 3x its normal cost. Believe me, this pays for itself by the second week.
4. Safety and Alignment: The Agent Is Doing Something You Didn’t Authorize
This is where most teams panic. An agent with tool access can do real damage. Delete records. Send emails. Overwrite databases.
We monitor:
- Action approval rate — how often does the agent attempt actions that require human review?
- Unauthorized tool access attempts — did the agent try to call an API it shouldn’t have access to?
- Output toxicity — is the agent generating content that violates policy?
- Data exfiltration patterns — is the agent sending sensitive data to external endpoints?
The last one is real. We had an agent that started calling an external weather API to “improve delivery predictions.” It was sending customer addresses as part of the query. That’s a GDPR violation waiting to happen.
The Monitoring Stack We Actually Use
After testing 15+ tools, here’s what works in production (as of July 2026):
LangSmith — Still the best for tracing LangChain and LangGraph agents. It catches step-by-step execution with built-in hallucination detection. LangChain’s framework guide covers the architectural decisions.
Prometheus + custom metrics — For cost, latency, and decision quality. We export custom metrics from our agent runtime. Grafana dashboards for real-time visibility.
Weights & Biases — For model comparison. When we upgrade an LLM (GPT-4o to Claude 3.5 Opus, for instance), we run both models in shadow mode. Compare decision paths. W&B tracks the drifts.
Custom guardrailing — We built a layer using AI agent protocols for interoperability. The protocol specifies how agents communicate and what safety checks run at each boundary.
Honeycomb — For high-cardinality event tracing. When you have 200K events/sec, you need a system that handles billion-row queries without slowing down.
What the Frameworks Don’t Tell You About Production Rollout
Every framework says it’s production-ready. Most aren’t. Here’s what we learned the hard way:
1. LangGraph is great for state machines, terrible for open-ended agents.
If you need deterministic workflow (order processing, data pipeline), use LangGraph. If you need an agent that decides its own path (customer support, research), it’ll fight you. The state management becomes brittle. LangChain’s own blog acknowledges this — but buried deep.
2. AutoGen’s multi-agent orchestration is overkill for 90% of use cases.
Everyone wants multiple agents talking to each other. It sounds cool. In practice, you get agent chatter, coordination overhead, and debugging nightmares. I’ve seen teams spend 3 weeks setting up AutoGen for a problem that a single agent with good tool orchestration could solve in 2 days.
3. CrewAI is the most user-friendly, but it hides complexity.
The abstractions are clean. You can prototype in an afternoon. But production monitoring is an afterthought. We had to build custom telemetry because CrewAI’s built-in logging doesn’t capture tool-level traces. It’s getting better, but the 2026 frameworks landscape shows the gaps.
4. Dify is the dark horse for non-technical teams.
If your team is more domain experts than engineers, Dify’s visual workflow builder is the fastest path to production. But monitoring is minimal. You’ll need to export traces and build your own observability on top.
Building Your Own AI Agent Production Monitoring Tools
Sometimes off-the-shelf doesn’t cut it. We built a lightweight monitoring SDK that wraps any agent framework.
Here’s the core pattern:
python
class MonitoredAgent:
    def __init__(self, agent, agent_id, cost_budget=10.0):
        self.agent = agent
        self.agent_id = agent_id
        self.cost_budget = cost_budget
        self.metrics = AgentMetrics(agent_id)

    async def run(self, query):
        start_time = time.time()
        trace = []

        try:
            # Shadow execution for drift detection
            shadow_result = await self._shadow_agent(query)

            # Main execution
            async for step in self.agent.stream(query):
                trace.append(step)

                # Real-time violation check
                if step.get('confidence', 1.0) < 0.3:
                    await self._alert_low_confidence(step)

                # Cost check
                if self.metrics.total_cost() > self.cost_budget:
                    raise BudgetExceededError(f"Agent {self.agent_id} exceeded budget")

            # Compare shadow vs main
            drift_score = self._calculate_drift(shadow_result, trace[-1])
            self.metrics.record_run(trace, drift_score, time.time() - start_time)

            return trace[-1]

        except Exception as e:
            self.metrics.record_failure(e)
            raise
This pattern catches drift, budget issues, and confidence drops before they reach users.
The Anti-Patterns That Will Kill Your Agent
I’ve seen these mistakes destroy agentic workflows. Avoid them.
1. Treating agents like APIs.
An API returns the same output for the same input. An agent doesn’t. You can’t cache agent responses. You can’t assume idempotency. Design for non-determinism.
2. Monitoring only the final output.
The path matters more than the destination. An agent that produces a correct answer via 40 hallucinated steps is broken. It’s just broken quietly.
3. Ignoring context overloading.
Agents accumulate context. After 100 turns, the prompt might be 50,000 tokens. The agent might start ignoring early context. Monitor context window usage per turn. We alert when >60% of the context comes from the last 20% of the turns.
4. Hard-coding thresholds.
A 5-second latency might be fine for a research agent but deadly for a real-time customer support agent. Every agent type needs its own monitoring profile. Don’t copy-paste thresholds.
5. No human-in-the-loop escalation.
Agents fail in novel ways. You can’t automate all recoveries. Build a manual review queue. When an agent’s decision quality drops below 0.7, route to a human. We learned this after an agent spent 3 hours trying to validate a phone number that didn’t exist.
Real Production Numbers (From Our Deployments)
These are real stats from SIVARO deployments in 2025–2026:
| Metric | Good | Bad (action taken) |
|---|---|---|
| Decision quality score (7-day avg) | >0.85 | <0.75 (rollback) |
| Hallucination rate | <2% | >5% (shadow mode) |
| Cost per interaction | <$0.05 | >$0.15 (audit) |
| Mean steps per completion | 3-7 | >12 (loop detected) |
| Tool selection accuracy | >90% | <80% (retrain) |
| Context waste ratio | <30% | >50% (prompt engineering) |
We used to set these thresholds manually. Now we use anomaly detection on the metrics themselves. When a metric deviates by 2 standard deviations from its 14-day rolling average, we get paged.
The Future (as of July 2026)
Three trends are reshaping ai agent monitoring production:
1. Protocol-level monitoring.
The A2A protocol (Agent-to-Agent) and ANP (Agent Network Protocol) are standardizing agent communication. This means monitoring can happen at the protocol layer instead of ad-hoc instrumentation. Expect monitoring tools that plug into protocol middleware.
2. Real-time hallucination detection.
New models (GPT-5, Claude 4) have built-in confidence calibration. Combining that with external verification (calling the original source data to check facts) is becoming standard. We’re seeing hallucination detection latency drop from seconds to milliseconds.
3. Agent observability as a service.
Startups are emerging that offer “agent RUM” (Real User Monitoring) — tracking every agent interaction the way traditional RUM tracks web page loads. Expect this to standardize by end of 2026.
FAQ: AI Agent Monitoring Production
Why is standard application monitoring insufficient for AI agents?
Because agents have non-deterministic behavior. Traditional monitoring assumes identical inputs produce identical outputs. Agents don’t. You need to track reasoning paths, confidence scores, and tool selection quality — not just latency and errors.
What are the first three metrics I should monitor?
Decision confidence variance, tool selection accuracy, and cost per interaction. These catch 80% of production issues before they impact users.
How do I detect an agent that’s stuck in a loop?
Track the number of steps per completion. Set an alert for >95th percentile of historical steps. Also monitor for repeated tool calls — if the same tool is called 3 times without progressing, it’s a loop.
Should I monitor all agent interactions or only a sample?
All interactions in production. Sampling misses the edge cases that kill you. At 200K events/sec, we still trace every single step. Storage is cheap. Debugging without traces is expensive.
Open-source vs commercial monitoring tools — which is better?
Open-source (Prometheus, Grafana, OpenTelemetry) for the core pipeline. Commercial (LangSmith, Honeycomb, W&B) for the agent-specific features. Budget for both. The open-source stack handles scale. The commercial tools handle agent-specific insights that open source can’t match.
How often should I review agent monitoring dashboards?
Real-time alerts for critical metrics. Weekly human review for decision quality trends. Monthly for cost optimization. Agents degrade slowly — weekly reviews catch the drift before customers do.
What’s the biggest mistake teams make with agent monitoring?
Building monitoring after the agent is in production. Do it from day zero. You won’t know what to monitor until you see the failure modes, and by then, it’s too late.
Can I use the same monitoring setup for different agent frameworks?
Yes — if you build an abstraction layer. We wrap every framework with the same telemetry interface. LangGraph, CrewAI, AutoGen — they all emit the same event format through our SDK. Takes 2 days to build, saves months of rework.
Final Thoughts
I’ve been doing this since 2018. Before agents were called agents. Before “agentic workflow” was a buzzword. And I’ll tell you this: monitoring is the difference between a demo and a product.
A demo works for 5 minutes. A product works for 5 years — because you saw the failure coming, caught it, and fixed it before anyone noticed.
The tools will change. The frameworks will evolve. But the fundamentals won’t: trace every step, measure decision quality, watch the cost, and never trust an agent where you can’t see its reasoning.
Start monitoring before your agent goes to production. Your future self — the one who gets the 3 AM alert — will thank you.
Nishaant Dixit — Founder of SIVARO. Building data infrastructure and production AI systems since 2018. Built systems processing 200K events/sec.