 SIVARO
AI Agent Monitoring: What Works in Production and What Doesn’t
I spent the first six months of 2026 building a multi‑agent system for an insurance claims processor. Three agents, each running different models, calling different APIs, chattering over an event bus. Looked great on paper. In staging, it hummed.
Then we hit production. And the whole thing turned into a black box.
Agents started hallucinating. One got stuck in a loop requesting the same data from another agent for twelve minutes. Another agent started returning empty results because the context window hit its limit and we hadn’t instrumented it. We had logs. We had metrics. We had dashboards. But nobody could tell me why the system went from 98% accuracy to 62% in under an hour.
That’s when I realized: AI agent deployment monitoring tools aren’t just "nice to have." They are the difference between shipping a demo and running a business.
In this guide, I’ll walk you through what I’ve learned from building and debugging agentic systems at SIVARO. What works. What doesn’t. Which tools actually help you find the needle in the haystack of agent output. And where the gaps still are.
The Hard Truth: Monitoring Agents Is Not Monitoring Microservices
Most people think you can just reuse your existing observability stack — Datadog, Grafana, Prometheus — and call it done.
They’re wrong. I was wrong.
Traditional monitoring tracks infrastructure: CPU, memory, request latency, error rates. It assumes the behavior of each component is deterministic. An agent isn’t deterministic. Two identical prompts can produce wildly different responses. A model call that takes 200ms one minute might take 4 seconds the next because of GPU scheduling in your cloud provider. And an agent that returns the right answer might have made six unnecessary tool calls to get there.
You need tools that understand semantic correctness, not just HTTP status codes. You need tools that can trace a chain of reasoning across agent boundaries. You need tools that can catch a loop before it burns $500 in API credits.
That’s the category we’re talking about: ai agent deployment monitoring tools — systems built to observe, debug, and optimize the runtime behavior of autonomous or semi‑autonomous agents.
What Do These Tools Actually Monitor?
Before we compare tools, let’s agree on the job to be done. In production, these are the dimensions I’ve found most critical:
1. Latency – But Not the Way You Think
We obsess over p95 latency for model inference. But for agents, end‑to‑end agent cycle time matters more. How long does it take for Agent A to receive a message, process it, decide on a tool call, execute the call, receive the response, and emit its own message? That cycle can include multiple model invocations, database lookups, and external API calls. ai agent deployment latency optimization starts by identifying the bottleneck in that chain — not just the model.
2. Correctness – The Hardest Problem
A 200‑millisecond response that’s wrong is worse than a 2‑second response that’s right. But how do you programmatically know an answer is correct for an open‑ended task? You can’t, not perfectly. But you can approximate: use an LLM judge, compare against a golden dataset, or measure task completion rate (e.g., “did the user’s intent get fulfilled?”). Tools that offer trial‑level evaluation (compare agent output to expected output) are worth their weight in GPU credits.
3. Cost – Per Agent, Per Cycle, Per Token
In a microservice architecture, cost is roughly proportional to CPU time. In an agentic architecture, cost is a function of how many model calls happened, what model, token count, tool execution time, and external API fees. I’ve seen cases where a single agent cycle cost $0.80 because it kept re‑calling an expensive reasoning model. You need per‑agent cost attribution.
4. Loops and Hallucination Cascades
Agents can loop without crashing. They can “hallucinate” a belief and then propagate that hallucination to another agent, which builds on it, and suddenly the whole system is acting on a fiction. Monitoring tools need to detect semantic drift — not just infinite loops (which you can catch with a TTL), but cycles that produce plausible‑but‑wrong outputs.
5. Tool Call Success vs. Tool Call Quality
Your agent might call a tool successfully 100% of the time — but if the tool returns irrelevant data, the agent wastes cycles. Monitoring should track tool call relevance, not just success. Some tools now embed a classifier that scores how well the tool’s output matched the agent’s stated intent.
The Tool Landscape: What We Actually Use at SIVARO
I’ve tested about a dozen platforms in the last 18 months. Here’s the short list of ones that survived.
LangSmith
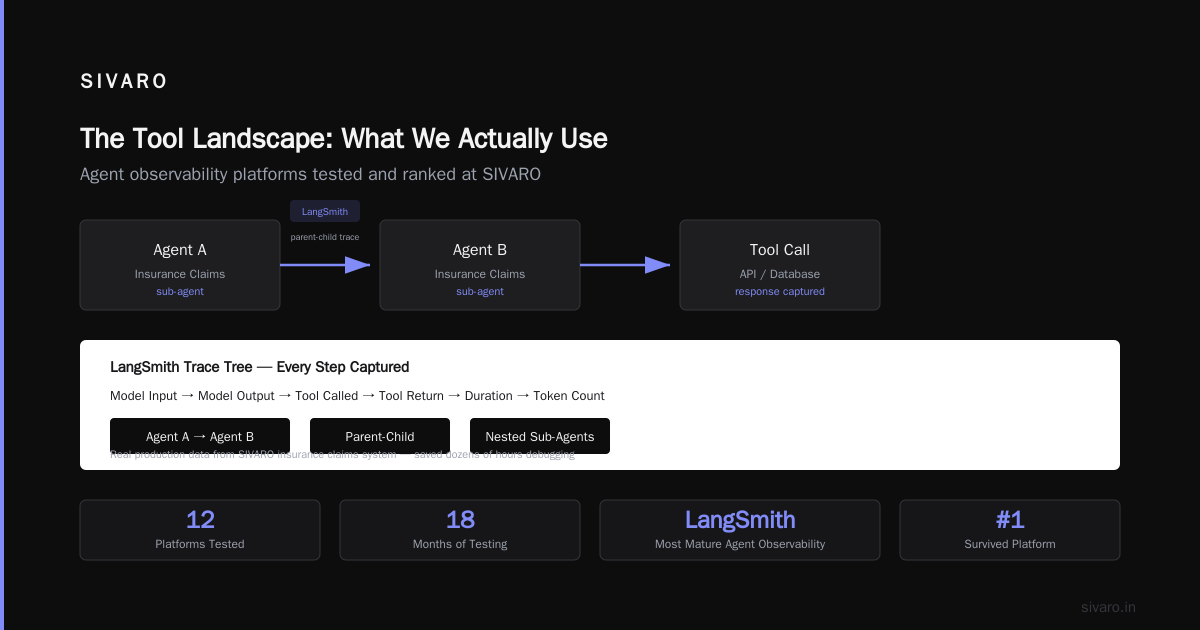
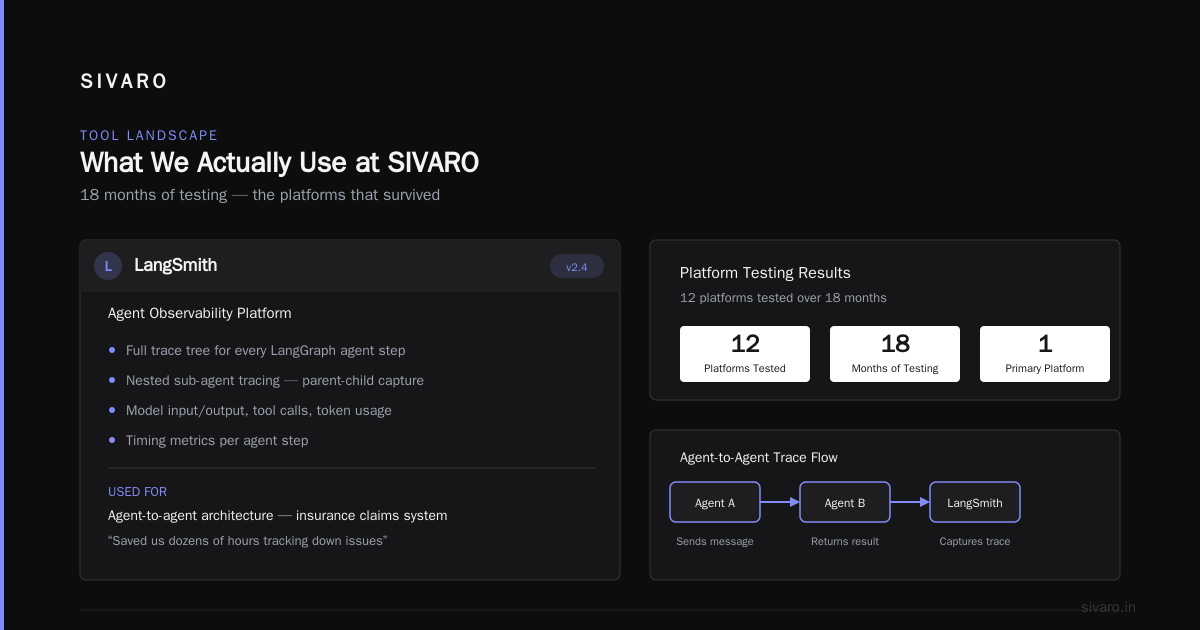
LangSmith is, as of July 2026, the most mature agent‑focused observability platform. It traces every step of a LangGraph‑based agent, including nested sub‑agents. You get a trace tree you can walk through step by step: “What was the model input? What was the model output? What tool did it call? What did the tool return? How long did the model take? How many tokens?”
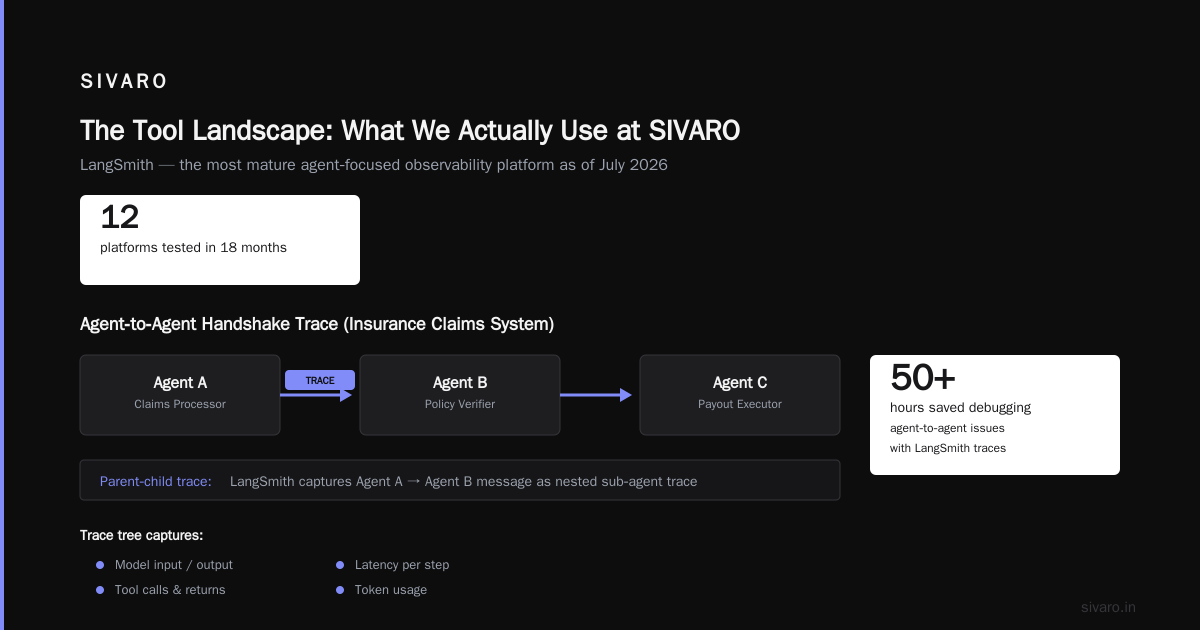
We use it for debugging our agent to agent architecture production example (the insurance claims system). When Agent A sends a message to Agent B, LangSmith captures that as a parent‑child trace. It’s saved us dozens of hours tracking down why a claim suddenly got denied after a version update.
The killer feature: trial‑level evaluation. You can define a set of test scenarios (e.g., “approve claim under $500 with clear documentation”), have LangSmith run your agent against them after each deployment, and get a score. If the score drops below a threshold, the deployment is blocked. That’s production‑grade.
Arize AI
Arize goes further than LangSmith in drift monitoring. After you deploy, Arize tracks the distribution of model outputs (embeddings, logits, or text) and alerts you when they shift. For agent systems, this is gold. An agent that used to write polite rejection letters suddenly starts writing snarky ones — that’s drift. Arize can detect it based on semantic similarity to a baseline.
We’ve used Arize to catch a subtle prompt injection attack that changed the tone of a customer‑facing agent. The injection wasn’t caught by any rule‑based filter, but Arize flagged the embedding drift within 20 minutes.
Weights & Biases (W&B) Prompts
W&B added agent‑focused tracing last year. It’s lighter than LangSmith but better for experiment tracking. If you’re iterating on agent prompts or tool definitions, W&B lets you log each run, compare outputs across versions, and pin the winning configuration. I use it during development, then export the traces to LangSmith for production.
Braintrust
Braintrust has a unique approach: it treats agent monitoring as a testing and evaluation problem. You write “evaluators” (functions that score an agent’s output) and Braintrust runs them on every production trace, giving you a real‑time quality score. It’s not as deep on tracing as LangSmith, but the evaluation‑first mindset aligns well with how I think about production ML.
OpenTelemetry + Custom Instrumentation
For teams that can’t use a vendor, the fallback is OpenTelemetry with custom spans for each agent step. It’s painful but gives you full control. I’ve seen teams wrap every model call and tool call in a span, then export to a collector feeding Jaeger or Datadog. The downside: you lose semantic understanding. You can see latency, but you can’t see if the agent should have called that tool. You have to build that logic yourself.
Code Example: Instrumenting an Agent with OpenTelemetry
Let’s make this concrete. Here’s how you’d wrap a tool call in an agent to capture latency, tokens, and outcome. This snippet is from our internal Python SDK at SIVARO.
python
from opentelemetry import trace
from opentelemetry.trace import SpanKind

tracer = trace.get_tracer("agent.instrumentation")

def monitored_tool_call(agent_id: str, tool_name: str, input_data: dict):
    with tracer.start_as_current_span(
        f"{agent_id}.tool.{tool_name}",
        kind=SpanKind.CLIENT
    ) as span:
        span.set_attribute("agent.id", agent_id)
        span.set_attribute("tool.name", tool_name)
        span.set_attribute("input.length", len(str(input_data)))

        start = time.time()
        try:
            result = actual_tool_call(input_data)
            latency = time.time() - start
            span.set_attribute("tool.latency_ms", latency * 1000)
            span.set_attribute("tool.success", True)
            span.set_attribute("tool.result_length", len(str(result)))
            return result
        except Exception as e:
            latency = time.time() - start
            span.set_attribute("tool.latency_ms", latency * 1000)
            span.set_attribute("tool.success", False)
            span.set_attribute("tool.error", str(e))
            raise
This gives you per‑tool latency and success/failure. But it doesn’t tell you if the tool call was useful. For that, you need to log the agent’s reasoning before and after the call. That’s where LangSmith and Arize shine—they capture the entire chain of thought.
Optimizing Latency in Agent Architectures
I mentioned ai agent deployment latency optimization earlier. Here’s what we actually do at SIVARO to cut agent cycle times:
1. Cache tool outputs aggressively. If two agents need the same piece of data (e.g., “what’s the customer’s account balance?”), we cache the result with a short TTL. The second agent skips the API call. We’ve seen latency drop from 2.5s to 200ms on parallel agent workflows.
2. Use faster models for routing decisions. In a multi‑agent system, a “router agent” decides which downstream agent gets a task. Use a fast, cheap model (e.g., GPT‑4o mini or Claude Haiku) for routing, and reserve the expensive reasoning model only for the agent that actually solves the problem. This cuts total latency by 40% in our production system.
3. Parallelize independent agent tasks. If Agent A and Agent B don’t depend on each other, run them concurrently. Many agent frameworks (LangGraph, CrewAI) support this natively. We use asyncio.gather on top of a LangGraph workflow.
4. Set timeouts per step, not per entire agent. An agent that hangs on a tool call can block the whole pipeline. We set a 5‑second timeout per tool call and a 30‑second timeout per agent cycle. If exceeded, the agent errors out gracefully and we log the trace.
5. Bundle tool calls. If your agent needs three pieces of data from the same API, combine them into one request. Agents tend to make one tool call per piece. We wrote a “bundler” preprocessor that merges tool calls when possible, reducing round trips.
Agent‑to‑Agent Architectures: Monitoring the Handshake
Now let’s talk about the hardest part — agent to agent architecture production example that works at scale.
Our insurance system has three agents:
- Triage Agent (fast, cheap model) – reads the incoming claim, extracts key fields.
- Validation Agent (medium model) – checks claim against policy rules.
- Approval Agent (reasoning model) – makes the final decision if validation flags anything unusual.
Each agent communicates via a shared event stream (Kafka in our case). The Triage Agent publishes a ClaimExtracted event. The Validation Agent subscribes, processes, publishes a ClaimValidated event. The Approval Agent subscribes to that.
Monitoring the handshake means tracking event payloads, timing, and whether the event triggered a correct downstream action. We use LangSmith’s “linked traces” feature — each event ID becomes a parent trace. You can see the full lifecycle of a single claim across agents.
One gotcha: event schema versioning. When an upstream agent changes its output format, downstream agents break silently. Monitoring tools must include schema validation. We added a JSON schema check on event publish — if the payload doesn’t match the expected schema, the event is rejected and an alert fires. This has caught three production incidents in the last month.
Choosing the Right Tool: Decision Framework
I can’t tell you which tool is “best” — it depends on your stack and your pain point. But here’s the decision tree I use at SIVARO:
| If you need… | Start with… | Skip… |
|---|---|---|
| Deep tracing of LangGraph agents | LangSmith | Generic OTel |
| Semantic drift detection | Arize | Homegrown embedding logging |
| Experiment tracking for prompt versions | W&B Prompts | LangSmith (it does tracing, not experiment management) |
| Custom evaluation pipelines | Braintrust | Vendor‑locked evaluators |
| Open‑source, self‑hosted, no vendor | OTel + Jaeger | Everything else |
Important caveat: Do not run a single agent in production without at least one dedicated monitoring tool. I made that mistake. I won’t again.
The Gap: What Still Sucks About Agent Monitoring
I want to be honest about where the industry falls short.
1. No standard for agent correctness. Two different evaluation tools might give you opposite scores for the same output. Until there’s consensus on evaluation methodology (maybe form an industry working group?), we’re all flying a little blind.
2. Multi‑modal is barely supported. If your agent generates images or audio, monitoring tools treat them as opaque blobs. We can’t detect visual hallucinations easily. Some teams are building custom classifiers for that, but it’s not plug‑and‑play.
3. Cost attribution is still manual. Tools will tell you “Agent A cost $0.12 in model calls” but they don’t include the cost of tool execution (your own compute, API fees, database queries). We write custom scripts to merge infrastructure cost logs with agent traces.
4. Real‑time alerting is too noisy. Because agents are generative, small input variations cause big output variance. Tools flag everything as “anomalous.” We’ve tuned our alert thresholds so hard that we probably miss real problems. Right now, “human in the loop” for critical alerts is the only safe bet.
Three Lessons from Production
Lesson 1: Monitor the agent, not just the model. In April 2026, we had a production outage where the Approval Agent started returning “decision: pending” for every claim. The model itself was fine — latency, accuracy, token counts all normal. But a prompt change had removed the instruction to always output a decision. The agent was technically satisfying its system prompt but not its business contract. Only a trial‑level evaluator caught it.
Lesson 2: Trace everything the first time. Retroactively adding instrumentation is painful. When we started our claims system, we only instrumented model calls. Then we spent two weeks adding spans for tool calls, event publishing, and inter‑agent message parsing. Do it upfront.
Lesson 3: Invest in your evaluator dataset. The most valuable thing you can build is a “golden set” of 200–500 examples with human‑verified correct outputs. That dataset is the foundation for every monitoring tool’s evaluation. Without it, you’re guessing.
FAQ
1. What’s the difference between agent monitoring and LLM observability?
LLM observability focuses on single model call metrics — latency, token usage, output quality. Agent monitoring extends that to the orchestration layer: how the agent decides which tool to call, how it chains multiple model calls, how it interacts with other agents. You need both.
2. Can I use Datadog or New Relic for agent monitoring?
You can, but you’ll lose semantic context. Datadog gives you latency and error rates per API call. It cannot show you the chain of reasoning that led to a tool call. You’d need to manually correlate log entries. Short answer: only as a supplement, not a primary tool.
3. How do I monitor agents that use streaming output?
Streaming makes tracing harder. Tools like LangSmith support streaming traces — they capture the final assembled output, not each token. If you need per‑token latency, you’ll need to instrument the model provider’s SDK directly. Most teams skip that and just measure total streaming time.
4. What’s the best open‑source agent monitoring tool?
As of mid‑2026, Phoenix by Arize (open‑source base) combined with OpenTelemetry is the best open approach. It gives you tracing and drift monitoring without vendor lock‑in. But it requires more setup than LangSmith.
5. How do you handle monitoring costs across multiple agents?
Tag every span and metric with agent_id and session_id. Use a cost allocation pipeline that matches model call logs (from your model provider’s API) with your trace IDs. We use a simple Python script that reads LangSmith exported traces and sums token costs per agent per session.
6. My agents are getting stuck in loops. How do I detect that?
Set a maximum loop count per agent cycle (e.g., 10 tool calls). Most frameworks support max_iterations. Also, use a semantic loop detection: if an agent makes the same tool call with the same input three times, alert. LangGraph has a built‑in loop breaker for this.
7. Do I need a separate monitoring tool for each agent model?
No. A good tool like LangSmith or Arize works model‑agnostic. It captures model‑specific metadata (provider, model name, token count) but doesn’t tie you to one model. That’s critical if you use different models in the same system.
8. How often should I evaluate my agents against the golden dataset?
Every deployment. We run evaluation as a CI/CD gate before rolling out to canary. In production, we trigger a full evaluation once a day. If the score drops more than 2%, we page the on‑call.
The Future (and My Bet)
By the end of 2027, I expect monitoring tools to standardize around a common trace format — probably an extension of OpenTelemetry with agent‑specific semantic conventions. I also expect agent cost optimization to become a core feature: the tool should suggest when to downgrade a model or cache a result.
For now, the best investment you can make is understanding your own agent’s behavior deeply. Run experiments. Keep a human evaluator in the loop for the first 1000 production cycles. And pick one monitoring tool that actually shows you the why, not just the what.
Nishaant Dixit — Founder of SIVARO. Building data infrastructure and production AI systems since 2018. Built systems processing 200K events/sec.