 SIVARO
AI Agent Observability and Monitoring in Production
The demo worked flawlessly.
My agent chain parsed a support ticket, queried three databases, wrote a Python script to fix the data, and emailed the customer — all in under four minutes. The stakeholders applauded. We deployed to production that Friday.
By Monday, the same agent had:
- Hallucinated a SQL query that joined the wrong tables, costing us $2,300 in compute
- Sent a customer an email with a fabricated refund amount (the customer noticed before we did)
- Silently failed 14 times in a row without logging a single meaningful error
We had zero idea what happened inside that black box. I remember staring at our logs dashboard — every entry said "status": "success" — while the customer support team was screaming about emails that never got sent.
That's when I learned the hardest lesson of production AI: you cannot debug what you cannot see.
This article is about ai agent observability and monitoring in production — what it actually takes to understand, debug, and trust agentic systems once they hit real traffic. No theory. Just what worked, what didn't, and what SIVARO ships to every client that asks us to put an AI agent into production.
Why Traditional Monitoring Is Useless for AI Agents
Let me be blunt: APMs like New Relic and Datadog were built for deterministic systems. A request comes in, a server processes it, a response goes out. You measure latency, error rates, throughput. Done. Perfect.
AI agents break every one of those assumptions.
An agent doesn't make one call. It makes dozens. Each LLM invocation is non-deterministic. The same prompt can produce different outputs at different temperatures. The agent might decide to call a tool, or it might decide to rewrite the prompt and try again. Or it might loop for twenty minutes and never finish.
Traditional metrics can't capture the core problem with agentic systems: the system's behavior emerges from a chain of decisions, and failures are cumulative. One slightly-off tool call gets passed to the next LLM call, which produces a slightly-derailed response, which causes the agent to make a completely wrong decision at step 9.
Your APM sees: latency: 2400ms, status: 200.
Your user sees: an email about a refund they never requested.
The gap between those two observations is where production incidents live.
Start With the Right Questions
Before you build any dashboards, define what "observability" means for your specific agent.
At SIVARO, we work with each client to answer four questions:
- What is the agent trying to accomplish? (The goal, not the task)
- What decisions does it make along the way? (Tool selection, prompt rewrites, data retrieval)
- What interventions might be needed? (Human handoff, retry logic, kill switch)
- What does failure look like? (Wrong output, hallucinated data, loop, timeout)
Every observability system we've built sits on top of those answers. Skip this and you'll be collecting data that doesn't answer anything.
Most teams don't like this step. They want to install a tracing tool and flip a switch. That speed leads to what I call the "pretty dashboard problem" — visuals that look impressive and explain nothing.
I wrote a deeper piece about how to build effective AI agents — the framework is useful here because it breaks agents down into building blocks. Observability should map to those same blocks.
Trace Everything. But Structure the Traces.
Your best starting point is not a metric. It's a trace — a complete record of every step the agent took and every decision it made.
At SIVARO, we maintain a decision log that looks something like this:
python
{
    "trace_id": "8f2a3c9e",
    "timestamp": "2026-08-03T14:22:01Z",
    "agent": "support-refund-classifier",
    "session_id": "chat_19skd",
    "steps": [
        {
            "step_id": 1,
            "type": "llm_call",
            "model": "claude-3-7-sonnet",
            "input_tokens": 1240,
            "output_tokens": 342,
            "reasoning": "User reports unauthorized charge. Classifying as refund request.",
            "decision": "call_tool:get_refund_eligibility",
            "confidence": 0.61
        },
        {
            "step_id": 2,
            "type": "tool_call",
            "tool": "refund_engine",
            "input": {
                "user_id": "u_8472",
                "charge_id": "ch_10923"
            },
            "output": {
                "eligible": False,
                "reason": "charge_older_90_days"
            },
            "duration_ms": 45
        },
        {
            "step_id": 3,
            "type": "llm_call",
            "model": "claude-3-7-sonnet",
            "input_tokens": 2200,
            "output_tokens": 180,
            "reasoning": "Refund not eligible. User is frustrated. Considering alternative resolutions.",
            "decision": "escalate_to_human",
            "confidence": 0.78
        }
    ]
}
That's the minimum viable trace. We also capture:
- Token usage for every LLM call
- The full prompt (truncated if massive) — you cannot debug output without input
- Reasoning traces from models that expose chain-of-thought (if available)
- Tool response validation — whether the tool output matched the schema the LLM expected
- The "why" field — LLMs should log the reasoning behind each decision, not just the decision
We've found that teams that skip the "why" field spend 3x longer debugging. You can't infer intent from action alone. Agents fail in ways that are hard to predict — the reasoning trail is your best forensic tool.
Don't Forget the State Machine
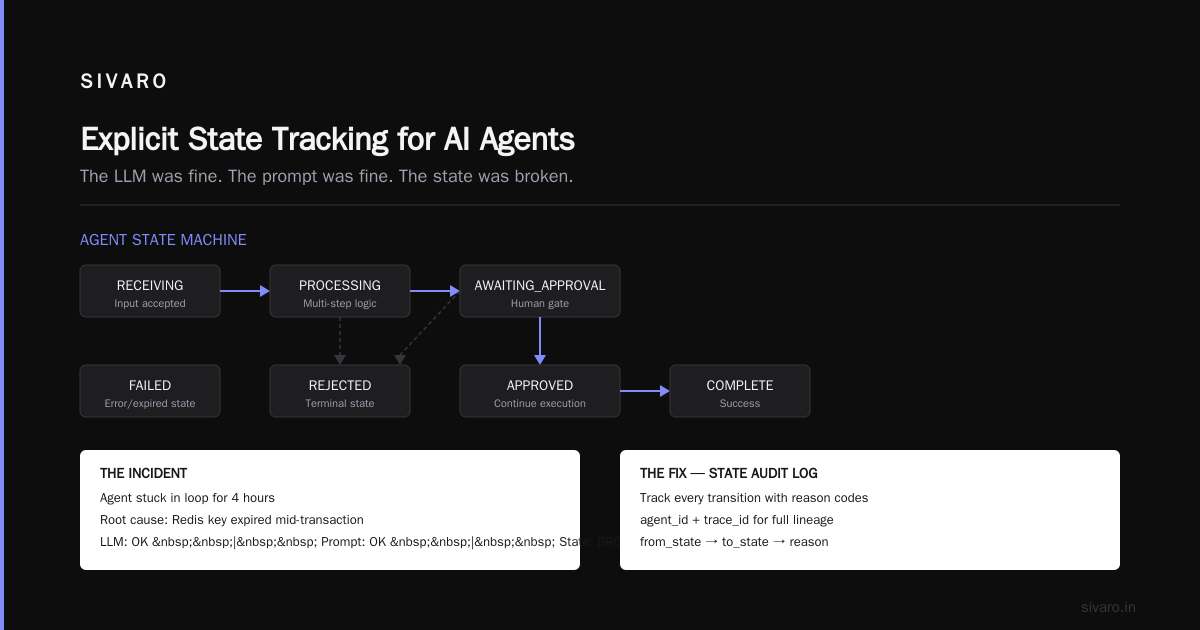
Here's the thing nobody tells you in ML class: most production agent failures are state errors, not LLM errors.
Your agent follows a workflow. The workflow has states: awaiting_input, fetching_data, generating_output, awaiting_approval. If state gets corrupted — a write conflict, a webhook retry, a timeout — the agent's behavior becomes undefined.
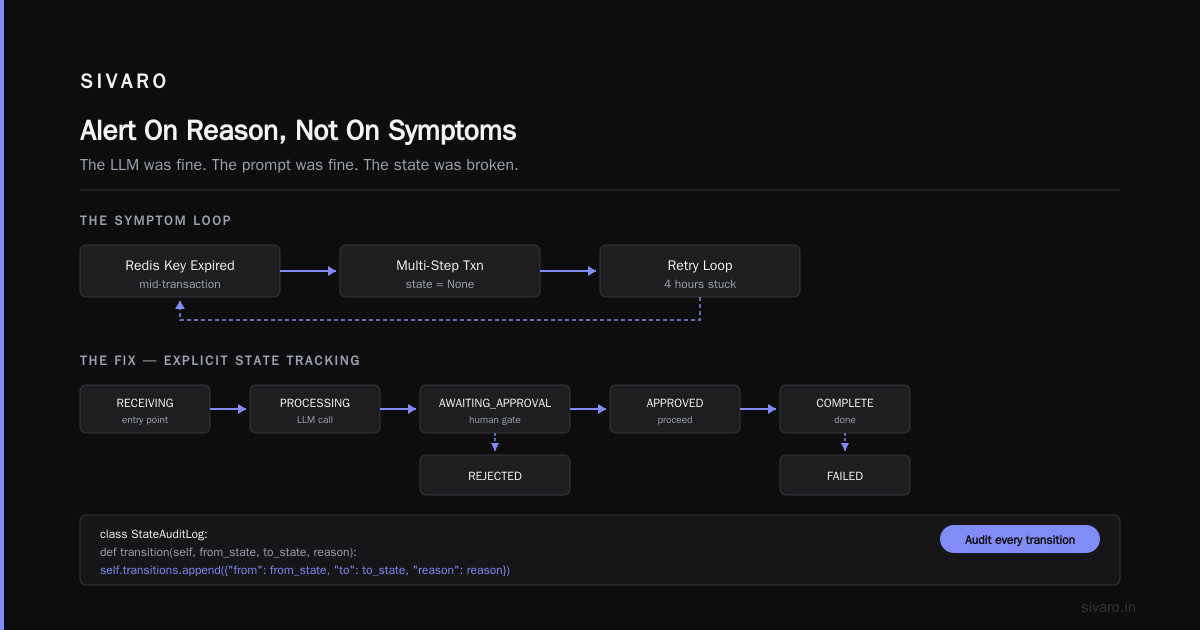
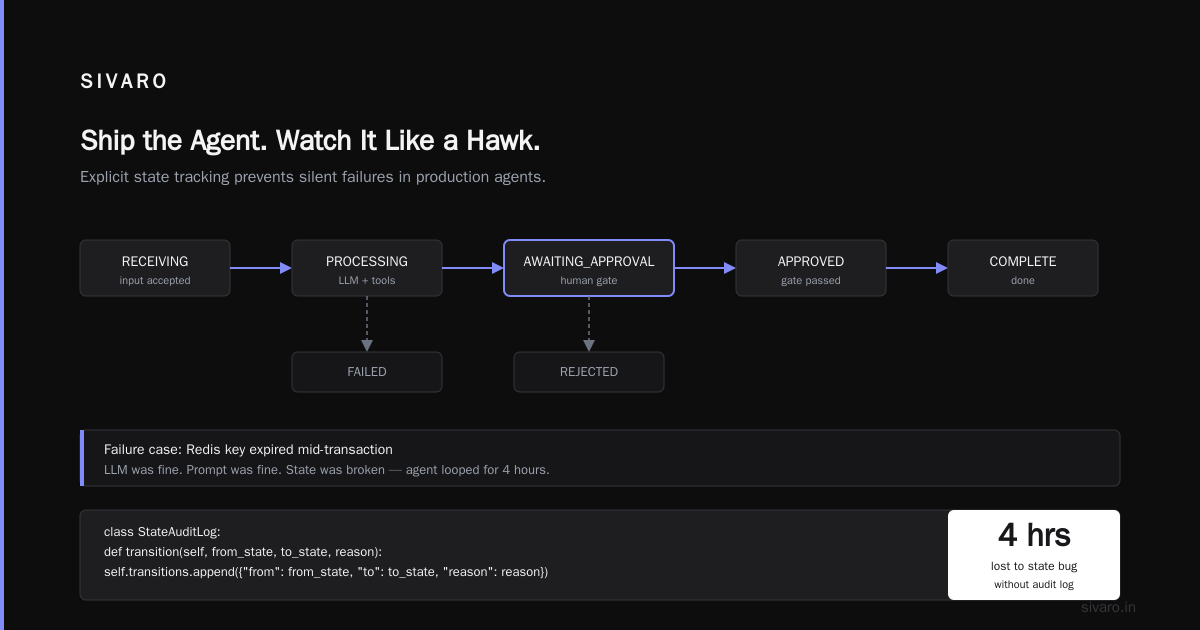
We once debugged a system where one agent was stuck in a loop for four hours because a Redis key expired midway through a multi-step transaction. The LLM was fine. The prompt was fine. The state was broken.
Build explicit state tracking:
python
# State machine monitoring for approval-gated agents
from enum import Enum

class AgentState(Enum):
    RECEIVING = "receiving"
    PROCESSING = "processing"
    AWAITING_APPROVAL = "awaiting_approval"
    APPROVED = "approved"
    REJECTED = "rejected"
    COMPLETE = "complete"
    FAILED = "failed"

class StateAuditLog:
    def __init__(self, agent_id, trace_id):
        self.agent_id = agent_id
        self.trace_id = trace_id
        self.transitions = []

    def transition(self, from_state, to_state, reason):
        self.transitions.append({
            "from": from_state,
            "to": to_state,
            "reason": reason,
            "timestamp": datetime.utcnow()
        })
        # Alert if we detect a loop
        if self.count_recent_transitions(to_state, seconds=30) > 5:
            alert_team("agent_loop_detected", self.agent_id, self.trace_id)
Monitor state transitions closely. Alert on impossible transitions — moving from AWAITING_APPROVAL to COMPLETE without going through APPROVED indicates a bug or an enforcement gap.
Evals Are Your Safety Net. Here's How We Structure Ours.
You can't watch every action an agent takes. That's the point of an agent — it operates autonomously. So you need automated evaluation layers.
We use three layers:
- Per-step validators — cheap checks that run after each step
- End-of-task evals — expensive, thorough checks that run after the agent finishes
- Production monitoring filters — ongoing, sampling-based checks on real traffic
Here's the critical insight: your eval set is your product spec. The quality of your agent is directly proportional to the quality of your eval cases. The eval catches what your checks miss.
We wrote a practical guide to designing AI agents that covers this — it's worth reading if you're structuring evals from scratch.
Per-step validators should be cheap enough to run on every step. End-of-task evals can be expensive — they run once per task. Production monitoring filters run on a sample until you trust them enough to gate traffic.
The Dev/Prod Gap Is the Real Enemy
Here's a pattern I see constant: an agent works perfectly in development, scores 98% on offline evals, and then falls apart in production.
Why?
Because development environments are clean. Production is messy.
In development:
- The data is curated
- The API endpoints are mocked
- The latency is consistent
- No rate limits
- No competing systems
In production:
- Data has typos
- Third-party APIs return erratic responses
- Upstream systems are down
- The LLM provider has a rate limit or an outage
- The customer types something you never anticipated
The AI agent production vs dev environment gap is the most under-discussed problem in the space. I've seen teams spend months perfecting an LLM pipeline on notebooks, and then watch their eval scores drop 30 points on real traffic. The variance is jarring.
Your observability system must monitor the production environment, not just the agent. Because the agent isn't failing — the environment is.
Track:
- External API drift — did a service your agent depends on change its response schema?
- Latency percentile shifts — did p95 latency double because the upstream API degraded?
- User behavior variance — are people asking for things your agent's training data never covered?
We built a production "environment monitor" that separately tracks agent behavior and the environment it operates in. You can't debug what you don't measure.
Build a Feedback Loop. Not a Log Dump.
Logs are passive. You look at them when something breaks. For AI agents to work in production, you need active feedback.
Here's the system we've used successfully:
python
# Production feedback loop for agent corrections
class AgentFeedbackLoop:
    def __init__(self, agent_id):
        self.agent_id = agent_id
        self.corrections = []

    def record_correction(self, trace_id, correction_reason, corrected_output):
        """When a human or automated system corrects the agent's output."""
        self.corrections.append({
            "trace_id": trace_id,
            "correction_reason": correction_reason,
            "original_output": self.get_original_output(trace_id),
            "corrected_output": corrected_output,
            "timestamp": datetime.utcnow()
        })
        # Automatically create a training example from the correction
        self.create_retraining_example(trace_id, correction_reason)

    def create_retraining_example(self, trace_id, reason):
        # Use the correction as a negative example in your eval set
        # This is how production feedback improves your agent over time
        eval_set.append({
            "input": self.get_trace_input(trace_id),
            "expected_output": self.corrections[-1]["corrected_output"],
            "reason_for_correction": reason
        })
Two insights here:
First: feedback should generate training data. Every time a human corrects an agent, you now have a labeled example. Add it to your eval set. This is the cheapest way to improve agent quality over time.
Second: track correction rate over time. Every team I've worked with sees a spike in corrections during the first weeks of production. That's expected. The problem is when corrections stay flat or increase — it means your agent isn't learning or the feedback loop is broken.
If your agent does a task long enough, you can deploy it to production with confidence — but only if you have a feedback loop that catches its mistakes. Otherwise, you're deploying a blind system.
Monitoring Tool Selection: The Layers of the Onion
We don't use one tool. We use five.
Because different layers of the agent stack need different instrumentation:
Layer 1: LLM API Gateway — OpenLLMetry, Langfuse, WandB — captures raw LLM calls, tokens, latency, cost
Layer 2: Workflow Orchestrator — LangGraph, CrewAI with tracing built-in — validates state transitions, step counts, loops
Layer 3: Infrastructure — Datadog, New Relic, Grafana — container metrics, memory, CPU, network
Layer 4: Business Metrics — custom dashboard in your BI tool — success rate per task type, refund amounts, customer satisfaction
Layer 5: Security — GuardrailsAI, custom flagging — PII detection, prompt injection attempts, data leakage
Each layer answers a different question. Layer 1 answers "Did the model do what we asked?" Layer 2 answers "Did the workflow execute correctly?" Layer 3 answers "Is the infrastructure healthy?" Layer 4 answers "Is the business being served?" Layer 5 answers "Is this safe?"
That's about 60% of the work. The remaining 40% is the human layer — how your team actually works with these tools.
Alerting: Alert On Reason, Not on Symptoms
Here's where most monitoring setups fail.
Teams set alert thresholds. If latency exceeds 3 seconds, page someone. If the error rate exceeds 2%, page someone. This creates a noise problem. At 2am, you get 47 alerts, most of them false, and you ignore everything until the real issue hits.
Alert on why something is wrong, not on the metric itself.
For example:
- Instead of
error_rate > 5%, alert onerror_rate increase by 3 standard deviations over baseline for 15 minutes - Instead of
agent_response_time > 3s, alert onconsecutive external API failures > 3 - Instead of
token_usage > 100K, alert onrepeated same-tool calls without state change
The rationale is simple: AI agents are probabilistic. Variance is normal. Outliers are what matter. You need to distinguish between the agent working as designed (with normal variance) and the agent breaking (with distribution shift).
We learned this the hard way. Our first alerting setup paged us every time an agent made a tool call that returned an edge case. We burned through four on-call engineers before we fixed the alerting.
Anthropic's approach to building effective agents emphasizes optimization on real-world performance. Alerting should likewise focus on production reality, not simulation performance.
What To Do When the Agent Fails: The Runbook
You're not going to prevent all failures. The question is what you do when they happen.
Every production agent needs a runbook for the top failure modes:
Failure Mode 1: LLM Output Is Garbage — The model produces a response that doesn't match the expected format. Your parser fails. What do you do? Retry the call? Regenerate with a different temperature? Fail gracefully and offer the user a fallback?
Failure Mode 2: Agent Enters a Loop — The agent repeats the same sequence of steps without making progress. Your detection logic fires. Do you kill the agent? Hand off to a human? Let it run but add a timeout?
Failure Mode 3: Tool Call Fails — The API you're calling is down. Do you retry with exponential backoff? Do you skip the tool and proceed with partial data? Do you abort the entire agent task?
Failure Mode 4: Security or Safety Issue — The agent gets a prompt injection. Maybe it ignores your system prompt. Or it tries to access a restricted resource. Do you have a red flag mechanism?
Failure Mode 5: Cost Blowout — The agent makes an unexpectedly large number of LLM calls, blowing through your budget. Do you have a hard per-task cost limit? We set hard caps and alert when any task exceeds them.
Your monitoring setup should make each of these scenarios obvious. The dashboard should show you, at a glance, which failure mode is happening. It shouldn't require a two-hour forensic investigation.
The Human-in-the-Loop: Intervention Points
Here's my honest position: no production AI agent should be completely autonomous. Not for important tasks. Not yet.
The right design is a supervisory loop. The agent does the work. A monitoring layer watches. Humans get pinged for edge cases, escalations, and anything that crosses a confidence threshold.
We call this "the 80/20 rule." Let the agent handle the 80% of tasks that are routine. Escalate the 20% that require judgment.
Your monitoring should make escalation automatic, not manual. When the agent encounters a situation it can't handle, it should hand off to a human with full context. No human should have to chase down the agent's history.
Here's the code we use for escalation:
python
def escalate_to_human(agent, trace, reason):
    # Generate a human-readable summary
    summary = {
        "user_goal": trace.user_goal,
        "agent_actions": trace.steps,
        "failure_point": trace.last_step,
        "failure_reason": reason,
        "current_state": trace.current_state,
        "suggested_human_action": trace.get_suggested_intervention()
    }

    # Open a ticket in the support system
    ticket_id = create_support_ticket(summary)

    # Send notification to the on-call team
    notify_slack(f"Agent {agent.name} escalated to human. Ticket: {ticket_id}")

    # Pause the agent's workflow until human decision
    agent.pause(ticket_id)
    return ticket_id
The human needs:
- The full context (what was the goal, what did the agent do?)
- The specific decision point (where did the agent's reasoning diverge?)
- A suggested action (what should the human check or do?)
Without that context, the human is just another debugger. And if you're going to have humans debug the agent, you might as well have them debug the original problem.
Metrics That Matter: A Short Checklist
Here's my concise list of what to track for every agent in production. Not the metrics your vendor dashboard shows — the metrics that actually tell you whether your agent is working:
Quality Metrics
- Task completion rate — what percentage of agent tasks result in a successful outcome (defined as the user's goal met)?
- Correction rate — how often does a human or downstream system need to fix the agent's output?
- Error rate by step type — which step does the agent fail at most often? (LLM call, tool call, data retrieval?)
Operational Metrics
- Latency percentile (p50, p95, p99) — how slow is the agent, per step and per complete task?
- Step count distribution — how many steps does the agent typically take? A median of 8 is fine. A tail of 300 is a red flag.
- Loop frequency — how often does the agent enter a repetition pattern?
Cost Metrics
- Token usage per task type — how much does each task type cost, on average?
- Cost per successful task — including retries, escalations, and failures. This is the number your finance team actually cares about.
- API call failure rate — what percentage of calls to external providers fail? (Rate limits, 5xx, etc.)
Business Metrics
- User satisfaction score — how do users rate the agent's interactions?
- Task abandonment rate — how often do users give up and contact a human?
- Escalation rate — what percentage of tasks need human intervention?
I recommend you track each of these at least once a day, and alert on significant deviations.
Making the Business Case: Your Stakeholders Need to See the Metrics
Observability is not just for your engineering team. It's for your product team, your operations team, and your executives.
When I work with clients, one of the first things we do is build what I call "the business metrics page" — a dashboard that answers the question: "Is this AI agent creating business value?"
That page includes:
- Tasks completed by the agent
- Cost per task
- Average resolution time
- User satisfaction scores
- Error rates
- Escalation rate
The best part: if the metrics are good, you don't need to sell the agent. The metrics sell it.
We shipped a fraud detection agent for a payments client in early 2026. Two weeks after deployment, their business metrics page showed:
- 3,400 fraud cases reviewed by the agent per day (up from 2,000 by humans)
- 12% reduction in manual review time
- Cost per review down from $1.20 to $0.18
The agent was profitable from week two. And the metrics made it undeniable. If we hadn't had that data, the client would have been fighting their internal skeptics for months.
The Future of Agent Monitoring (and Why It Matters Now)
We're mid-2026. The AI agent ecosystem has moved from "can we build it?" to "can we run it in production?" The companies that figure out observability will be the ones that survive the agentic gold rush.
Here's what I'm seeing:
- Prompt versioning is becoming as important as code versioning. When you change a prompt, you change the behavior of your system. You need to track those changes the same way you track code changes.
- Multi-agent workflows need system-level tracing. When agent A calls agent B, which calls agent C, you need to trace the entire tree, not just individual agents.
- Agent evaluation is moving from offline to online. You can't just test on canned examples anymore. You need real-time feedback from production traffic. This is where production data becomes your label set — see the Amazon Bedrock case study in that article about collecting user feedback for eval sets.
But here's my bigger point: the tools will change. The fundamentals won't.
The fundamentals are:
- Trace everything. You cannot debug what you cannot see.
- Define the "why." Log reasoning, not just actions.
- Build a feedback loop. Every correction is training data.
- Measure business outcomes, not just technical metrics.
- Keep humans in the loop for the hard cases.
If you get those five things right, you can run any agent in production. If you skip them, you'll be debugging at 2am with your stakeholders asking questions you can't answer.
FAQs
What's the biggest mistake teams make with AI agent observability?
They treat it like an afterthought. They build the agent first and then bolt on monitoring. You need observability from day one — baked into the agent architecture, not attached later.
Do we need different observability for LLM tracing vs. traditional tracing?
Yes. LLM tracing captures more than just request/response. It captures tokens, reasoning, confidence, and decision points. Traditional tracing captures latency, errors, and status codes. You need both.
How much does observability add to the cost of running agents?
Observability adds about 10-15% overhead in token usage and infrastructure cost. But it saves much more. In our experience, teams without observability spend 3-5x more time debugging. It's not a cost — it's an investment.
What's the best open-source observability tool for AI agents?
Langfuse is solid. OpenLLMetry is also good. But tools change fast. What matters more is setting up the right instrumentation and evaluating your approach. The tool is secondary; the data model is primary.
How do you ensure your observability doesn't leak sensitive data?
Careful. LLM traces can contain sensitive data. You need to redact PII, filter out credentials, and be careful about what you capture. We use redaction libraries and custom filters to mask sensitive fields before storing traces.
How do you balance observability with user privacy?
You can't just record every interaction. You need to decide what percentage of traffic to sample, which fields to capture, and how to anonymize data. We build privacy controls into the observability system from the start.
Conclusion: Ship the Agent. Watch It Like a Hawk.
I've seen the pattern too many times: teams build an agent, demo it, celebrate, deploy it, and then watch it quietly fail in production because nobody can see what it's doing.
Don't do that.
Invest in ai agent observability and monitoring in production before you ship. Not after. Before.
The good news: the fundamentals are simple. Trace everything. Log the "why." Build a feedback loop. Measure business outcomes. Keep humans in the loop.
I've been building production AI systems since 2018, and I can tell you this: the teams that win the agent race are not the ones with the smartest models. They're the ones that can see what their models are doing. And once you can see, you can fix. And once you can fix, you can scale.
The lessons from production AI deployments are clear: observability is not a luxury. It's a requirement.
You can't debug what you can't see.
Go build.
Nishaant Dixit — Founder of SIVARO. Building data infrastructure and production AI systems since 2018. Built systems processing 200K events/sec.