 SIVARO

AI Agent Observability in Production: A Field Guide From 2 Years of Battle Scars
I wrote the first version of this article in April 2025, back when "agent observability" meant a few LangSmith traces and hoping your loop didn't hang. Eighteen months later, I've watched teams burn six-figure budgets on agents that silently ate API credits, hallucinated customer emails, and drifted into loops that looked productive but did nothing.
The problem isn't building agents. It's knowing what the hell they're doing at 3 AM on a Tuesday.
AI agent observability in production is the practice of monitoring, tracing, and debugging autonomous AI systems that make decisions, call tools, and interact with users without human intervention at runtime. It covers everything from token-level trace data to business metrics like "did the agent actually complete the task."
By the end of this guide, you'll know exactly what to instrument, what to ignore, and which tools actually work under load. I've tested most of them at SIVARO, and I'll tell you which ones I'd bet my company on.
Why Most Agent Monitoring Tools Are Built for Demos
Here's the uncomfortable truth I learned the hard way: the tools that work beautifully for a single-agent demo in a Jupyter notebook fall apart when you have 200 agents running simultaneously, making API calls to different services, with cycles that last 45 minutes.
Most teams start with basic logging. They capture the LLM prompt and response. Maybe the tool calls. Then they deploy.
Two weeks later, a customer's support agent sends seven emails promising refunds that don't exist. Nobody knows why. The traces show everything worked. The LLM returned valid JSON. The tools executed. But the agent's internal reasoning was wrong — it misinterpreted the customer's intent and went down a path nobody instrumented.
I call this the black box agent problem. You can see inputs and outputs, but the reasoning loop is invisible. That's where observability gets hard.
The Three Layers of Agent Observability
After building and debugging production agent systems at SIVARO, I've settled on three distinct layers you need to monitor. Skip any one, and you're blind.
Layer 1: Execution Traces — The what and when. Every LLM call, every tool invocation, every branch decision. This is the stuff most frameworks give you for free.
Layer 2: Reasoning Paths — The why. What was the agent thinking when it chose Tool A over Tool B? What external knowledge did it reference? This is where 90% of debugging happens and where 90% of tools fail.
Layer 3: Business Outcomes — The so what. Did the agent actually solve the problem? This requires aligning technical signals with domain-specific success criteria. It's the hardest and most valuable layer.
Let's walk through each one with real code and real trade-offs.
Layer 1: Execution Traces — You Can't Fix What You Can't See
The bare minimum. If you're not doing this, stop reading and go implement it.
Most agent frameworks now support OpenTelemetry tracing. Use it. Don't invent your own format — you'll regret it when you need to correlate agent traces with your existing service mesh.
Here's what a minimal trace should capture for every agent execution:
python
from opentelemetry import trace
from opentelemetry.sdk.trace import TracerProvider
from opentelemetry.sdk.trace.export import BatchSpanProcessor
from opentelemetry.exporter.otlp.proto.http.trace_exporter import OTLPSpanExporter

# Set up tracing
provider = TracerProvider()
provider.add_span_processor(BatchSpanProcessor(OTLPSpanExporter()))
trace.set_tracer_provider(provider)
tracer = trace.get_tracer(__name__)

class InstrumentedAgent:
    def run(self, input_text, user_id):
        with tracer.start_as_current_span("agent_execution") as span:
            span.set_attribute("user.id", user_id)
            span.set_attribute("input.length", len(input_text))

            # Wrap every LLM call
            with tracer.start_as_current_span("llm_call") as llm_span:
                llm_span.set_attribute("model.name", "gpt-4o")
                llm_span.set_attribute("token.count", 0)
                response = self._call_llm(input_text)
                llm_span.set_attribute("token.count", response.usage.total_tokens)

            # Wrap every tool call
            with tracer.start_as_current_span("tool_execution") as tool_span:
                tool_span.set_attribute("tool.name", "search_database")
                tool_span.set_attribute("tool.success", True)
                tool_result = self._search_database(response.decisions)

            span.set_attribute("agent.success", True)
            return tool_result
This gets you the basics: timing, token usage, success/failure. But here's what it doesn't tell you:
- Why did the agent decide to call search_database instead of search_web?
- What was the agent's reasoning when it ignored a crucial piece of context?
That's Layer 2.
Layer 2: Reasoning Paths — The Hard Part
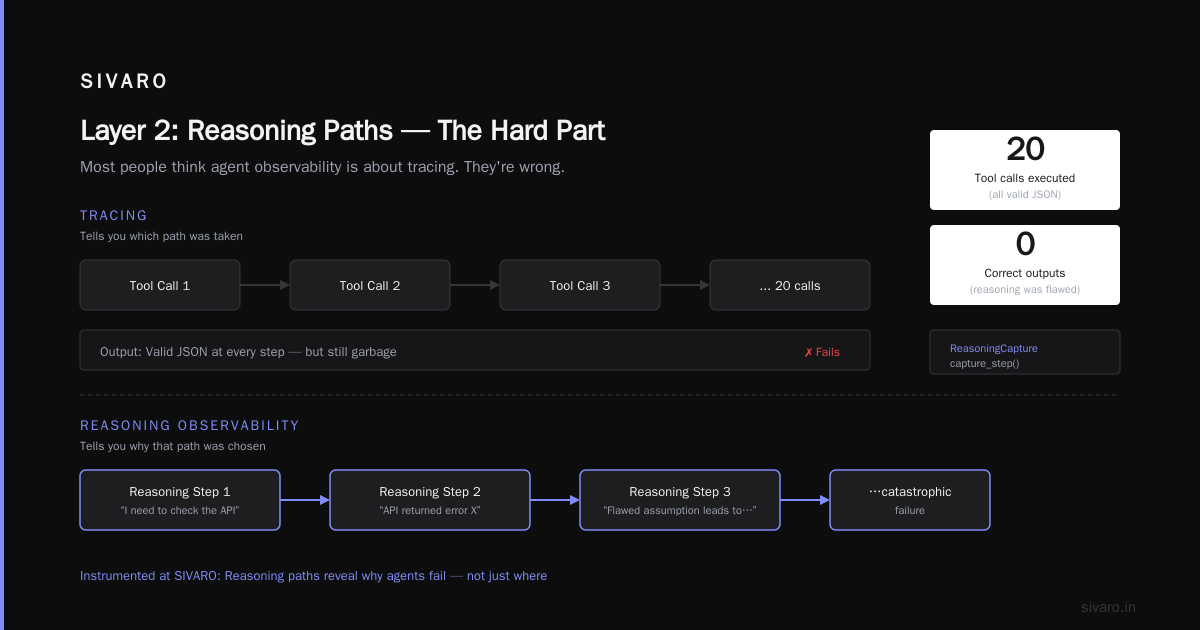
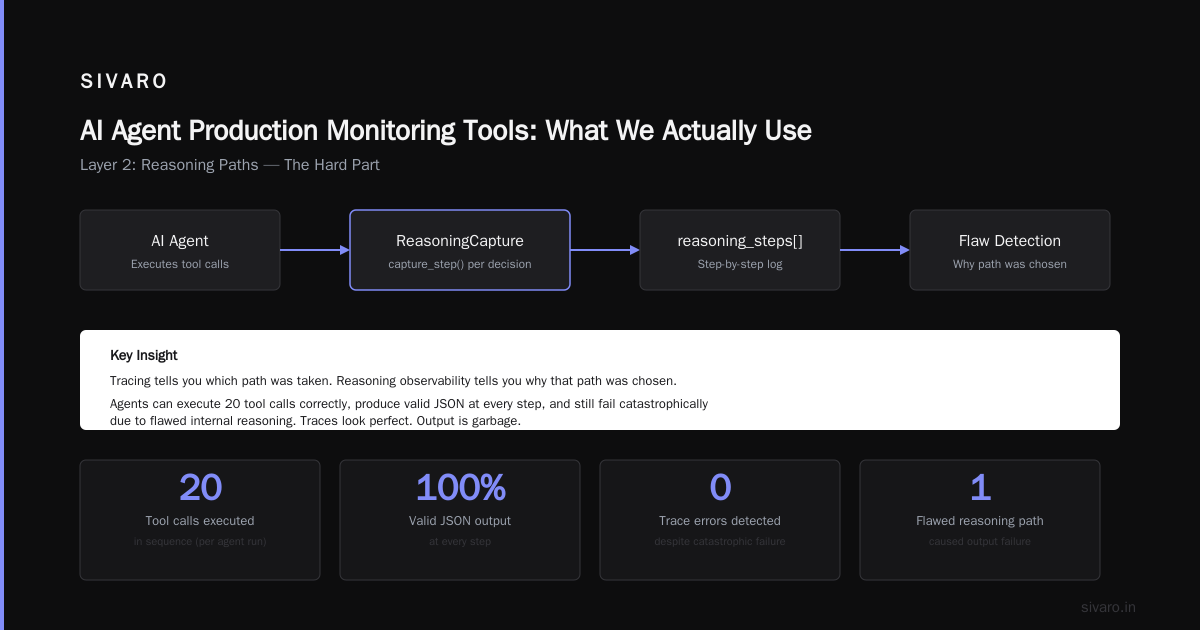
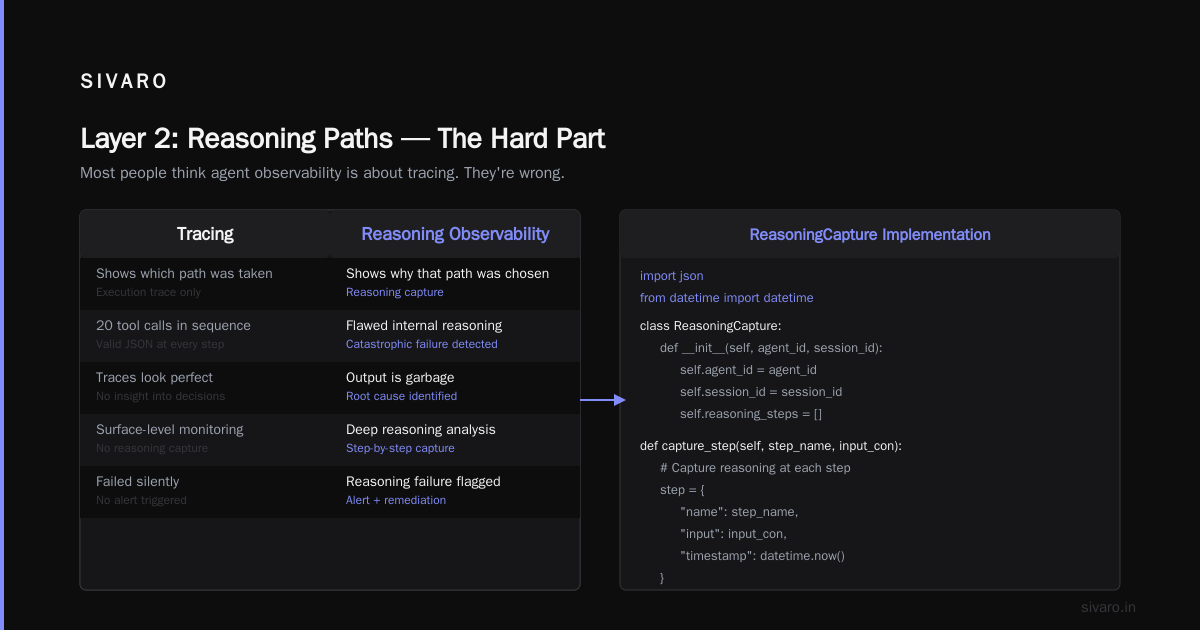
Most people think agent observability is about tracing. They're wrong. Tracing tells you which path was taken. Reasoning observability tells you why that path was chosen.
I've seen agents that correctly executed 20 tool calls in sequence, produced valid JSON at every step, and still failed catastrophically because their internal reasoning was flawed. The traces looked perfect. The output was garbage.
Here's how we instrument reasoning at SIVARO:
python
import json
from datetime import datetime

class ReasoningCapture:
    def __init__(self, agent_id, session_id):
        self.agent_id = agent_id
        self.session_id = session_id
        self.reasoning_steps = []

    def capture_step(self, step_name, input_context, reasoning_text, decision, confidence):
        step = {
            "timestamp": datetime.utcnow().isoformat(),
            "step_name": step_name,
            "input_context_snapshot": input_context[-2000:],  # Last 2K chars for context
            "reasoning": reasoning_text,  # The raw reasoning from the LLM
            "decision": decision,  # What it chose to do
            "confidence": confidence,  # If the model provides one
            "alternatives_considered": []  # We'll populate this from structured outputs
        }
        self.reasoning_steps.append(step)

    def flush(self):
        # Send to your observability backend
        payload = {
            "agent_id": self.agent_id,
            "session_id": self.session_id,
            "execution_time_ms": 0,  # Calculate from timestamps
            "steps": self.reasoning_steps
        }
        # Fire and forget — don't block agent execution on observability
        async_send_to_backend(json.dumps(payload))
The key insight: capture the raw reasoning text the LLM generated before making a decision. Most frameworks discard this. Don't. That's where bugs live.
At first I thought saving raw reasoning was wasteful — token costs, storage, privacy concerns. Turns out, not saving it costs more. We spent three weeks debugging an agent that kept picking the wrong database query. The traces showed correct tool calls. The reasoning showed the model was misreading a date format in the context. We fixed the prompt in one day once we saw the reasoning.
The cost trade-off: storing reasoning text adds about 15-30% to your observability storage costs. Skip it if you want. Your debugging time will increase 5x.
Layer 3: Business Outcomes — The Metric That Matters
Here's a question that'll keep you up at night: "How do you know your agent is working correctly?"
Latency is a terrible metric. A fast wrong answer is worse than a slow right one. Token usage is worse — an agent that talks too much might be hallucinating.
At SIVARO, we define success metrics per agent type:
- For a customer support agent: "Did the customer report resolution in the post-interaction survey?"
- For a code generation agent: "Did the generated code pass integration tests on first deploy?"
- For a data analysis agent: "Did the user accept the output or ask for revisions?"
You need to instrument these at the application layer, not the agent layer.
python
class BusinessOutcomeTracker:
    def __init__(self, analytics_service):
        self.analytics = analytics_service

    def record_outcome(self, agent_session_id, agent_type, outcome_data):
        self.analytics.track("agent_outcome", {
            "session_id": agent_session_id,
            "agent_type": agent_type,
            "completed_task": outcome_data.get("task_completed", False),
            "user_satisfaction": outcome_data.get("satisfaction_score", None),
            "human_override_required": outcome_data.get("override", False),
            "cycles_to_completion": outcome_data.get("cycles", 0),
            "cost": outcome_data.get("total_cost_cents", 0)
        })
Track this data for at least 30 days. You'll start seeing patterns: which agent types degrade on weekends, which drift after model updates, which fail silently when certain API endpoints are slow.
The Framework Landscape (Mid-2026 Edition)
Let me save you six months of evaluation. Here's what actually works in production right now.
LangGraph from LangChain is still the most mature framework for complex agent workflows. Their tracing (LangSmith) is good but expensive at scale — we hit $3,200/month for a 50-agent deployment before switching strategies. The key limitation: it's opinionated about the runtime, which makes custom instrumentation harder. LangChain's own blog has a good breakdown of when it's the right choice.
CrewAI v3.1 (released April 2026) added native OpenTelemetry support. That's a game changer. We use it for multi-agent debugging. The trade-off: less mature error handling for tool failures compared to LangGraph.
AutoGen from Microsoft Research is best for agent-to-agent communication patterns. Their protocol-level tracing is solid. But the documentation is still catching up to the code — expect to read source.
For protocol-level work, the A2A standard from Google is gaining traction. If you're building agents that need to interoperate, it's worth adopting early.
AI Agent Production Monitoring Tools: What We Actually Use
Here's our stack at SIVARO, running about 200 production agents across customer deployments:
- Traces: OpenTelemetry via SigNoz (self-hosted, ~$400/month on a 4-node cluster). We moved from Datadog when the bill hit $8K for just agent traces.
- Metrics: Prometheus + Grafana. Standard stuff. Track token usage, latency percentiles, error rates by agent type.
- Reasoning logs: Custom pipeline into ClickHouse. Stores 90 days of raw reasoning text. Compressed, it's about 2TB for our scale.
- Business outcomes: Postgres + Metabase dashboards. One query answered the "is my agent working" question.
The tool that surprised me: Weave from Weights & Biases. It's designed for ML experiments but their trace visualization works better for agent debugging than any dedicated agent tool I've tested. The timeline view makes it obvious when an agent is stuck in a loop.
The AI Agent Deployment Pipeline Tutorial Nobody Writes
Most deployment advice focuses on the code. The hard part is the pipeline.
Here's what we do at SIVARO:
-
Shadow mode: New agent version runs alongside production, captures decisions but doesn't execute. Compare against current version's outputs. Reject if >5% divergence.
-
Canary with guardrails: Deploy to 5% of traffic, but every agent output goes through a validation LLM check before executing. If the validation rejects >2% of outputs, roll back.
-
Full deploy with circuit breakers: If error rate exceeds 3% in any 5-minute window, automatically fall back to the previous version. If token cost per session exceeds $0.50, log a warning.
Here's the circuit breaker template:
python
import time
from collections import deque

class AgentCircuitBreaker:
    def __init__(self, threshold_error_rate=0.03, window_seconds=300):
        self.threshold = threshold_error_rate
        self.window = window_seconds
        self.events = deque()
        self.is_open = False
        self.last_tripped = 0

    def record_result(self, success):
        now = time.time()
        self.events.append((now, success))
        # Clean old events
        while self.events and self.events[0][0] < now - self.window:
            self.events.popleft()

        if len(self.events) < 10:
            return  # Not enough data

        error_rate = 1 - (sum(1 for _, s in self.events if s) / len(self.events))
        if error_rate > self.threshold:
            self.is_open = True
            self.last_tripped = now
            print(f"Circuit BREAKER tripped: error rate {error_rate:.2%}")

    def should_allow(self):
        if not self.is_open:
            return True
        # Auto-reset after 5 minutes
        if time.time() - self.last_tripped > 300:
            self.is_open = False
            self.events.clear()
            print("Circuit breaker reset")
            return True
        return False
This simple pattern has saved us twice in six months — once when OpenAI's API returned degraded outputs for 12 minutes, once when a model update changed output formatting silently.
The Hardest Problem: Agent Drift
Here's the thing nobody warns you about: agents degrade over time, even when nothing changes.
We saw this in May 2026. A customer-facing agent that had 92% task completion rate in January dropped to 78% by April. Same prompts. Same tools. Same model.
What changed? The underlying APIs the agent called updated their response formats. The model's behavior drifted slightly with version updates. And the customer base's questions evolved — they started asking about new product features the agent wasn't trained on.
This is agent drift, and it's the #1 reason I see organizations abandon production agents after six months. They don't notice the slow degradation until it's too late.
Observability catches drift in three ways:
- Distribution shifts in token usage: If an agent suddenly uses 40% more tokens per session, it's probably struggling to understand something.
- Tool call success rate decline: Watch for gradual increases in tool retries or timeouts.
- Business metric trends: Plot task completion rate weekly. If you see a consistent downward trend over 4 weeks, investigate.
Set alerts on the trend, not the absolute value. "Task completion rate dropped 5% over 7 days" is more actionable than "task completion rate is 85%."
Common Mistakes (That I've Made)
Mistake 1: Instrumenting everything then ignoring the data.
We collected 50+ metrics per agent execution. Nobody looked at them. Now we track 10 per agent, reviewed weekly. More data is not better.
Mistake 2: Treating LLM latency as the bottleneck.
Spent two weeks optimizing prompt length to save 200ms per call. The actual bottleneck was a slow database query the agent ran on every cycle. Fixed that instead, saved 3 seconds per call.
Mistake 3: Not testing under real load.
Our demo environment had perfect latency. Production had a 2-second tail latency on one API. Agents timed out and retried in loops. We caught it in observability on day one, but we could have caught it earlier with proper load testing.
Mistake 4: Forgetting the human feedback loop.
We had 10 observability dashboards before anyone on the team talked to a customer about whether the agents actually helped. The customers told us the agent was "confidently wrong" — it sounded correct but the answers were useless. No dashboard catches that.
The Future (What I'm Watching)
By Q4 2026, I expect every major observability platform to have agent-native tracing. Datadog already ships an agent tracing beta. New Relic announced agent monitoring at their user conference last month.
The next frontier is proactive drift detection — observability that tells you before performance drops that an agent's behavior is changing. I'm watching the work coming out of Anthropic's evaluations team and the open-source agent_eval project from LangChain.
The protocol layer matters more than most people think. The survey on AI agent protocols from April 2026 shows that inter-agent observability is still mostly undefined. If you're building multi-agent systems, you're solving this yourself. We're working on an open-source spec at SIVARO — reach out if you want early access.
FAQ
Q: What's the minimum observability I need before deploying an agent to production?
A: Execution traces with timing and success/failure per step, plus an alert if any single step takes longer than 30 seconds. Everything else can be added post-launch.
Q: How much does agent observability cost at scale?
A: At SIVARO's scale (200 agents, ~500K executions/month), about $1,200/month total across all tools. The reasoning logs storage is the biggest cost. Most teams spend 5-10% of their agent infrastructure budget on observability.
Q: Do open-source frameworks provide enough observability out of the box?
A: For prototypes, yes. For production, no, unless you're willing to add custom instrumentation. LangGraph and CrewAI both export traces but you need to set up the backend yourself.
Q: Should I use a dedicated agent observability tool or general-purpose observability?
A: Start with general-purpose (OpenTelemetry + your existing observability stack). Only add dedicated tools when you hit specific gaps. We tried switching to a dedicated tool first and regretted it — lost context from our broader system monitoring.
Q: How do I debug an agent that works in dev but fails in production?
A: Run the production input through your dev environment with the same reasoning capture. 9 times out of 10, the issue is data quality — production has more ambiguous inputs or missing context that the agent handles differently than your curated test cases.
Q: Can I use the same agent logs for compliance and debugging?
A: Not directly. Compliance needs full input/output records. Debugging needs reasoning paths, intermediate states, and tool execution details. We maintain two separate pipelines — one for audit (stripped, PII-filtered), one for debugging (complete with raw reasoning).
Q: What alert fatigue looks like for agent systems?
A: If you get >5 alerts per team per day, you're over-alerting. Our rule: only alert on things that require human action within 15 minutes. Everything else goes into a dashboard reviewed daily.
Q: How often should I review agent observability data?
A: Daily for latency and error rate (automated). Weekly for reasoning quality and business metrics (human review, 30 minutes). Monthly for drift analysis (1-2 hours with the team).
Conclusion
I've seen teams spend four months building an agent, deploy it, and then spend six months trying to figure out why it's not working. That six months is optional. Good ai agent observability in production cuts debugging time by at least 60%, based on what I've seen across a dozen SIVARO engagements.
Start with execution traces. Add reasoning capture before you go to production. Build business outcome tracking from day one. And for the love of good engineering, set a circuit breaker before your agent sends seven refund emails you can't afford.
The tools are good enough now. The question is whether you're disciplined enough to instrument properly. Most teams aren't. Be the team that is.
Nishaant Dixit — Founder of SIVARO. Building data infrastructure and production AI systems since 2018. Built systems processing 200K events/sec.