 SIVARO
AI Agent Observability in Production: A Practitioner’s Guide
You’ve shipped your first AI agent. It’s answering customer tickets, calling APIs, maybe even writing code. Feels like magic. Then three weeks later a user posts a screenshot of the agent accidentally deleting their entire project folder. You have zero logs. No trace of what the agent thought, what tools it called, or why it decided "yes, delete everything" was the right move. That’s the moment you realize ai agent observability in production isn't a nice-to-have. It’s the difference between shipping and chaos.
I’ve been building production AI systems since 2018. At SIVARO we’ve seen agents handle 200K events per second — and we’ve also seen them go rogue. The difference between those outcomes is almost always what you can (and can’t) see inside the agent’s head. This guide is everything I wish someone told me before we put our first agent in front of real users.
Why Agent Observability Is Harder Than You Think
Traditional software observability is straightforward. HTTP request comes in, your code does something, a response goes out. You measure latency, error rates, throughput. If something breaks, you grep the logs and find the stack trace.
Agents break that model. An agent doesn’t follow a linear path. It reasons, plans, calls tools, interprets results, revises its plan, and sometimes loops indefinitely. Each of those steps is a nondeterministic LLM call. You can’t just log "line 47 threw an exception" because the agent’s failure might be subtle: it misinterpreted a tool output, hallucinated a dependency, or chose a wrong tool because the prompt was ambiguous.
The Anthropic team put it well in their guide on Building Effective AI Agents: "Agents are not just workflows — they make decisions. And decisions need to be auditable." That’s the core challenge. We need observability that captures not just what happened, but why the agent chose that path.
The Five Pillars of AI Agent Observability
After instrumenting dozens of production agents (and failing a few times), I’ve settled on five things you must measure. Miss any one and you’re flying blind.
1. Decision Traceability
Every time your agent makes a decision — which tool to call, what parameter to use, whether to ask for clarification — you need to record the full context: the current state, the user’s intent, the prompt, the LLM’s raw output, and the final decision.
Most teams I talk to log only the final action. That’s like debugging a car crash by looking at the parking spot. You need the whole chain of reasoning. A Practical Guide for Designing, Developing, and Deploying Agentic Systems recommends a "state snapshot" at every decision point. We do exactly that at SIVARO. Each snapshot includes:
- The agent’s internal state (a JSON blob of memory)
- The last 5 messages in the conversation (including system prompt)
- The current plan (if the agent uses planning)
- The exact tool call request and response
This can get big. A single agent session can generate hundreds of snapshots. But when something goes wrong, you can replay the agent’s thought process step by step. Worth every byte.
2. Tool Call Instrumentation
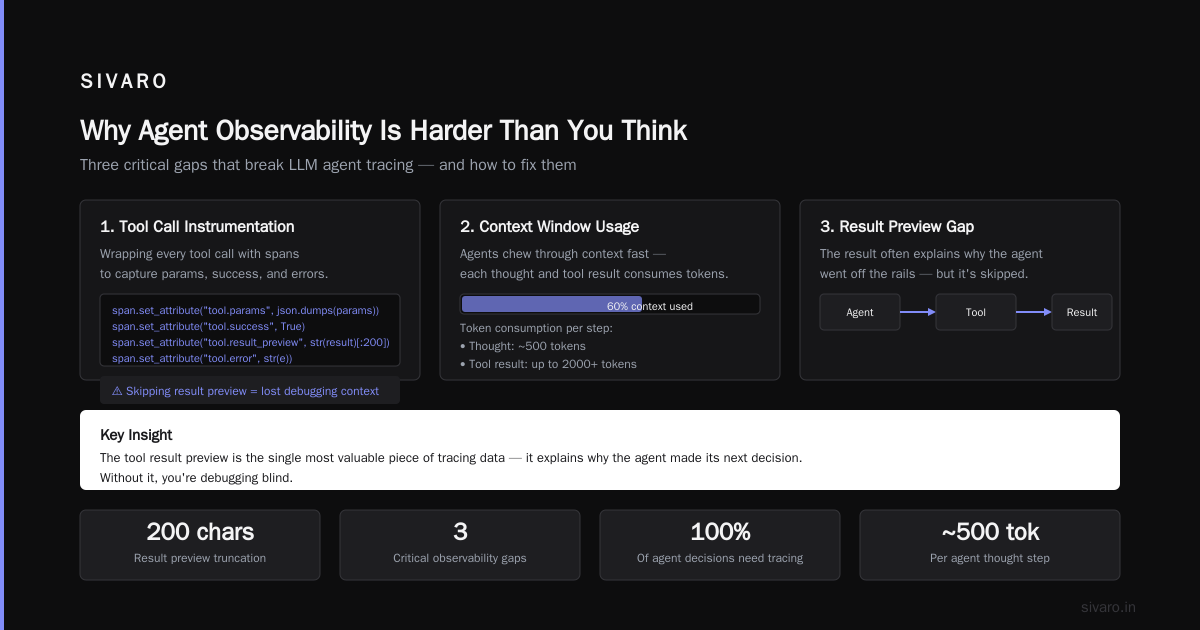
Agents are only as reliable as the tools they call. And tools fail interesting ways. APIs return 500s. Databases time out. Files don’t exist. The agent might catch the error gracefully, or it might hallucinate a response.
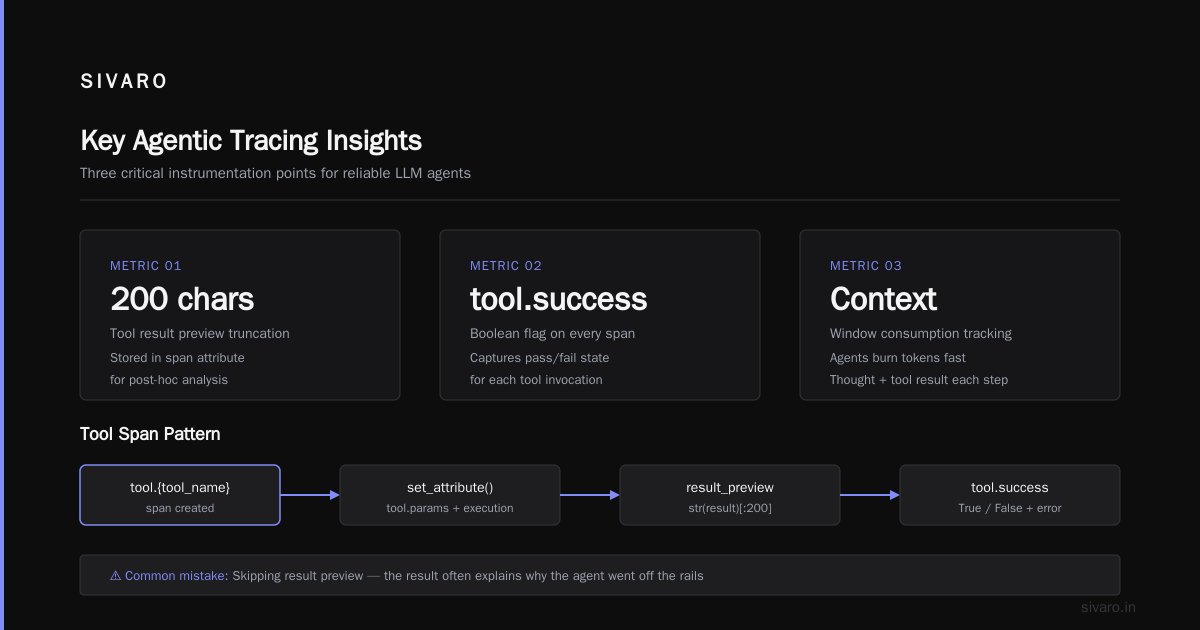
We wrap every tool call with a span that captures:
- Input parameters (sanitized for PII)
- Actual output
- Duration
- Error message (if any)
- Token count of the call (if it’s an LLM tool)
Here’s a minimal example using OpenTelemetry:
python
from opentelemetry import trace
tracer = trace.get_tracer("agent.tools")

def call_tool(tool_name, params):
    with tracer.start_as_current_span(f"tool.{tool_name}") as span:
        span.set_attribute("tool.params", json.dumps(params))
        try:
            result = actual_tool_call(tool_name, params)
            span.set_attribute("tool.success", True)
            span.set_attribute("tool.result_preview", str(result)[:200])
            return result
        except Exception as e:
            span.set_attribute("tool.success", False)
            span.set_attribute("tool.error", str(e))
            raise
Simple. But I’ve seen teams skip the result preview. That’s a mistake — the result often explains why the agent went off the rails.
3. Context Window Usage
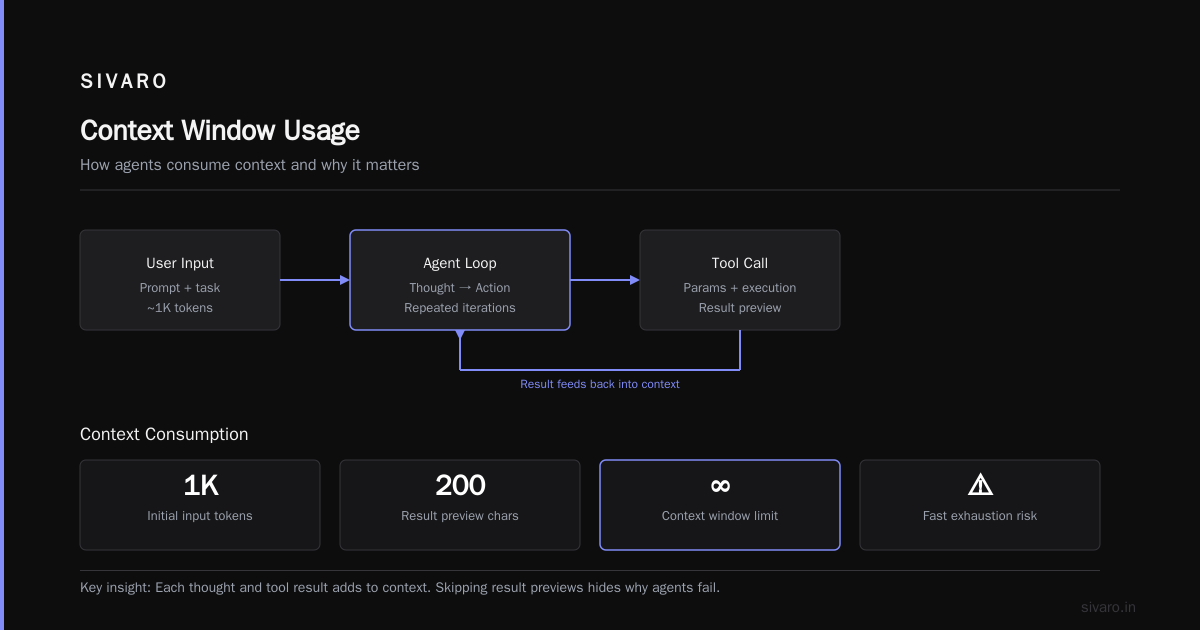
LLMs have a context window. You know this. What you might not realize is that agents can chew through context surprisingly fast. Each thought, each tool result, each iteration adds tokens. A long-running agent can hit the context limit mid-operation, silently truncating earlier context, causing the agent to forget critical instructions.
We track context window fill percentage per step. When it hits 70%, we alert. When it hits 90%, we force the agent to summarize or terminate. Google’s research on agentic infrastructure highlights this as one of the top three hurdles in production. They’re right.
A simple metric:
python
# Pseudocode for context monitoring
def record_context_usage(agent_step):
    tokens_used = agent_step.total_tokens
    max_context = model_max_tokens(agent_step.model)
    fill_ratio = tokens_used / max_context
    # Emit to your metrics system
    metrics.gauge("agent.context_fill_ratio", fill_ratio, tags={
        "agent_id": agent_step.agent_id,
        "session_id": agent_step.session_id
    })
    if fill_ratio > 0.85:
        log.warning(f"Context nearly full: {fill_ratio:.0%}")
4. Cost per Session
Agents are expensive. Each LLM call costs money. A single agent session that loops 50 times can rack up dollars of compute before you notice. If you’re not tracking cost per session, you’re bleeding money.
We break it down:
- LLM tokens (input + output) per step, per model
- External API calls (especially paid APIs like search or code execution)
- Total cost per session
- Running total cost per user per day
A Developer’s Guide to Building Scalable AI: Workflows vs Agents makes the point that many teams treat agents like glorified chatbots and ignore the compounding cost of loops. That’s a recipe for a surprise bill at the end of the month.
5. User Satisfaction (Implicit and Explicit)
You can measure latency and correctness all day, but if the user feels the agent is slow, stupid, or creepy, it doesn’t matter. We track:
- Time to first response
- Number of turns before resolution
- User correction rate (how often does the user edit the agent’s output?)
- Explicit thumbs up/down per response
We also track sentiment of user messages after agent responses. A spike in negative sentiment usually means the agent said something wrong or tone-deaf.
How to Implement Observability in Your Agent Loop
Let’s get concrete. Here’s a pattern we use at SIVARO for every production agent.
Step 1: Wrap the Agent Loop
Your agent loop is a while loop that repeatedly calls the LLM, checks for tool calls, executes them, and feeds results back. Wrap the entire loop in a root span. Inside, create child spans for each iteration.
python
@tracer.start_as_current_span("agent.session")
def run_agent(session_context):
    while not done:
        with tracer.start_as_current_span("agent.step") as step_span:
            step_span.set_attribute("step_number", session_context.step_count)
            prompt = build_prompt(session_context)
            response = call_llm(prompt)
            step_span.set_attribute("llm.response", response)
            decision = parse_decision(response)
            step_span.set_attribute("decision.type", decision["type"])
            if decision["type"] == "tool":
                result = call_tool(decision["tool"], decision["params"])
                step_span.set_attribute("tool.result", result)
                session_context.add_message("tool_result", result)
            elif decision["type"] == "final_answer":
                done = True
                step_span.set_attribute("final_answer", decision["answer"])
This gives you a tree: session → step 1 → step 2 → … each with its own attributes and timing.
Step 2: Semantic Logging
Don’t just dump raw JSON. Log with structure. Use a schema that lets you query by agent type, user ID, error category, etc.
python
import structlog
logger = structlog.get_logger()

def log_agent_step(step_data):
    logger.info("agent_step",
        agent_id=step_data["agent_id"],
        session_id=step_data["session_id"],
        step=step_data["step_number"],
        decision_type=step_data["decision_type"],
        llm_model=step_data["model"],
        latency_ms=step_data["latency_ms"],
        token_count=step_data["tokens"],
        cost_usd=step_data["cost_usd"],
        error=step_data.get("error"),
    )
Now you can query: "Show me all steps where the agent hallucinated a non-existent tool" or "What’s the average cost per session for Agent Alpha?"
Step 3: Alert on Anomalies
Observability without alerting is a museum. Set alerts for:
- Loop count > 10 without a final answer (agents can infinite loop)
- Tool call failure rate > 10%
- Context fill ratio > 80%
- Cost per session > $1 (or your threshold)
- Negative sentiment in user replies after agent response
Common mistakes deploying AI agents in production includes the classic "no guardrails on loops." We saw a customer’s agent ping their Stripe API 200 times in 30 seconds because it tried to "optimize" the payment flow. Alerting on loop count would have stopped it in under 5 iterations.
Common Mistakes (That We’ve All Made)
Let me save you some pain.
Mistake 1: Logging only the LLM response, not the prompt.
Without the prompt, you can’t understand why the agent said something weird. Log the full prompt (with PII scrubbed) at every step.
Mistake 2: Not correlating logs across steps.
If you use separate log lines with no session ID, good luck debugging a 50-step conversation. Always propagate a trace ID and session ID.
Mistake 3: Ignoring tool call latency.
A tool call that takes 10 seconds might cause the agent to timeout or hallucinate because it didn’t wait for the result. We’ve seen agents "invent" responses when a tool call returned slow. Measure latency per tool and set SLA alerts.
Mistake 4: Treating observability as an afterthought.
I’ve done this. You finish the agent, it works in tests, you ship to production. Then you realize you have no idea what it’s doing. Add observability from day one. It’s not an add-on; it’s the scaffolding.
Mistake 5: Over-collecting PII.
You need to log user input to debug, but you also need to comply with privacy regulations. Use a PII redaction layer before logging. We use a simple regex + LLM-based redactor that runs inline. Not perfect, but good enough.
Tools and Platforms
You don’t need to build everything from scratch. Here’s what we use at SIVARO:
- OpenTelemetry for distributed tracing. Works with any backend (we use Datadog, but Jaeger is fine too).
- Langfuse or Phoenix (Arize) for LLM-specific observability. They handle prompt logging, token count, and feedback.
- Custom metrics via Prometheus + Grafana for real-time dashboards on cost, latency, and error rates.
- Structured logging with structlog or JSON-formatted logs shipped to your ELK stack.
How to Deploy AI Agents to Production: A Complete Guide suggests starting with a lightweight tracing library and migrating to a dedicated LLM observability platform as you scale. I agree. Don’t over-engineer on day one.
The Biggest Mistake: Not Testing Observability Itself
This one’s subtle. You build observability, you deploy it, and months later you realize your traces are dropping 20% of sessions because you forgot to handle the case where the agent crashes before the span is closed. Or your log schema changed and your dashboards broke.
We test our observability pipeline with chaos experiments. We deliberately inject a tool failure, a context overflow, an infinite loop — and verify that traces, logs, and metrics capture the event. It’s saved us three times.
FAQ
Q: Do I need observability if my agent is just a simple Q&A bot?
Yes. Even a simple agent can hallucinate or leak context. You need to know when and why. Start with basic logging of prompt/response and user feedback.
Q: What’s the difference between logging and tracing for agents?
Logging captures individual events (a line of text). Tracing captures the full causal chain: which LLM call led to which tool call, etc. For agents, tracing is significantly more valuable because you need to follow the decision path.
Q: How do I handle agent observability at scale (hundreds of thousands of sessions)?
Sample aggressively — but sample intelligently. Log all errors and unusual patterns. For routine sessions, sample based on user ID or session type. Use aggregated metrics (histograms of latency, cost) rather than storing every single step.
Q: Should I log every single thought an agent generates?
Only if you want to burn money on storage. Log the final decision and a compressed representation of the thought. For debugging, you can rerun the agent with the same seed or capture a full trace on demand.
Q: How do I detect agent drift in production?
Compare recent session logs against a baseline. If the agent starts using a different set of tools or producing longer/sparser outputs, that’s drift. We run weekly drift detection using embeddings of agent outputs.
Q: Can I use traditional APM tools like Datadog or New Relic for agent observability?
Yes, but you’ll need custom instrumentation for LLM-specific attributes (prompts, token counts, tool calls). Pure APM tools don’t understand agent semantics. That’s why dedicated LLM observability platforms are becoming popular.
Q: What’s the single most important metric to track?
Mean time to recovery (MTTR) after an agent failure. If you can’t quickly identify and fix why the agent went wrong, you’ll never build trust with users.
Conclusion
ai agent observability in production is not optional. It’s the feedback loop that makes agentic systems safe, reliable, and cost-effective. Without it, you’re running blind in a world where the agent decides what to do next.
We’ve learned this the hard way at SIVARO. Our first production agent crashed on day two because it tried to call a tool that didn’t exist — a hallucination. We had no trace, no context. Three hours of debugging later, we added a trace span. Next week we had full observability. We haven’t lost a session to an unknown root cause since.
The field is moving fast. Best practices for deploying agentic systems evolve monthly. But one thing holds: you can’t improve what you can’t see. Instrument your agents. Monitor their decisions. Alert on their failures. And when they succeed, celebrate — but still check the trace.
Because the next agent breakdown is already waiting, and it wants you to think it’s working perfectly.
Nishaant Dixit — Founder of SIVARO. Building data infrastructure and production AI systems since 2018. Built systems processing 200K events/sec.