 SIVARO
AI Agent Observability in Production: The Hard-Won Truths
We built our first production AI agent in early 2025. A customer-facing system that routed support tickets, enriched them with context, and fired off actions in Salesforce.
It worked great in staging. For about three hours.
Then it started calling the wrong APIs. Then it stopped calling them at all. Then it hallucinated a response to a paying customer that said "your subscription has been cancelled" — when it hadn't.
That's when I learned the difference between watching an agent and observing an agent.
Most people think observability for AI agents is the same as observability for microservices. It's not. Microservices fail deterministically — a pod crashes, a database times out, a queue fills up. AI agents fail probabilistically. They don't crash. They drift. They make wrong decisions with total confidence.
This guide covers what we've learned running AI agents in production at SIVARO — what tools actually work, what patterns prevent disaster, and how to build observability that catches failures before customers do.
What "AI Agent Observability Production" Actually Means
Let's get specific.
AI agent observability in production is the practice of monitoring, tracing, and debugging autonomous systems that make decisions and execute actions — in real time, against real data, with real consequences.
It's not logging. Logging tells you what the agent said it did. Observability tells you what the agent actually did, why it did it, and whether it should have done it at all.
The difference matters because agents introduce a new category of failure: the correct operation that produces the wrong outcome. The code didn't bug out. The model didn't crash. The agent just... chose poorly. And unless you're watching every step of the reasoning trace, you won't know until the customer complains.
I've seen teams ship agents into production thinking "we'll just watch the error rate." Error rates for agents are nearly useless. An agent that succeeds 100% of the time at the wrong task is worse than one that fails 50% of the time at the right task.
Why Traditional Monitoring Fails for Autonomous Agents
I spent years building observability stacks for data infrastructure. Prometheus metrics. Grafana dashboards. Structured logging in JSON. All the standard stuff.
When we deployed our first agent, I slapped a dashboard on it. Requests per second. Latency p99. Error rate.
The error rate was 2%. Beautiful.
Then we did a manual audit of 100 agent runs. 14 of them had done something wrong — wrong tool call, wrong parameter, wrong decision. But none of them triggered an error. The agent completed the run. It just completed it poorly.
Traditional monitoring assumes failure has a signature. A 500 status code. A timeout. An exception. Agents don't work that way. An agent can call a tool successfully, pass valid parameters, return a result — and that result can be catastrophically wrong.
Here's what you actually need to monitor:
- Decision drift: Is the agent choosing different tools or paths than expected?
- Confidence degradation: Is the model becoming less certain about its choices?
- Context poisoning: Is the agent accumulating bad information in its memory?
- Tool misuse: Is the agent calling tools with parameters that are technically valid but semantically wrong?
- Loop detection: Is the agent repeating the same reasoning cycle without progress?
None of these show up as errors in a standard monitoring stack.
The Three Pillars of Agent Observability
After breaking production four times in two months, we settled on a structure that actually works. Three layers. No shortcuts.
1. Trace Every Decision, Not Just Events
Standard distributed tracing tracks requests between services. For agents, you need to track decisions — and the context that produced them.
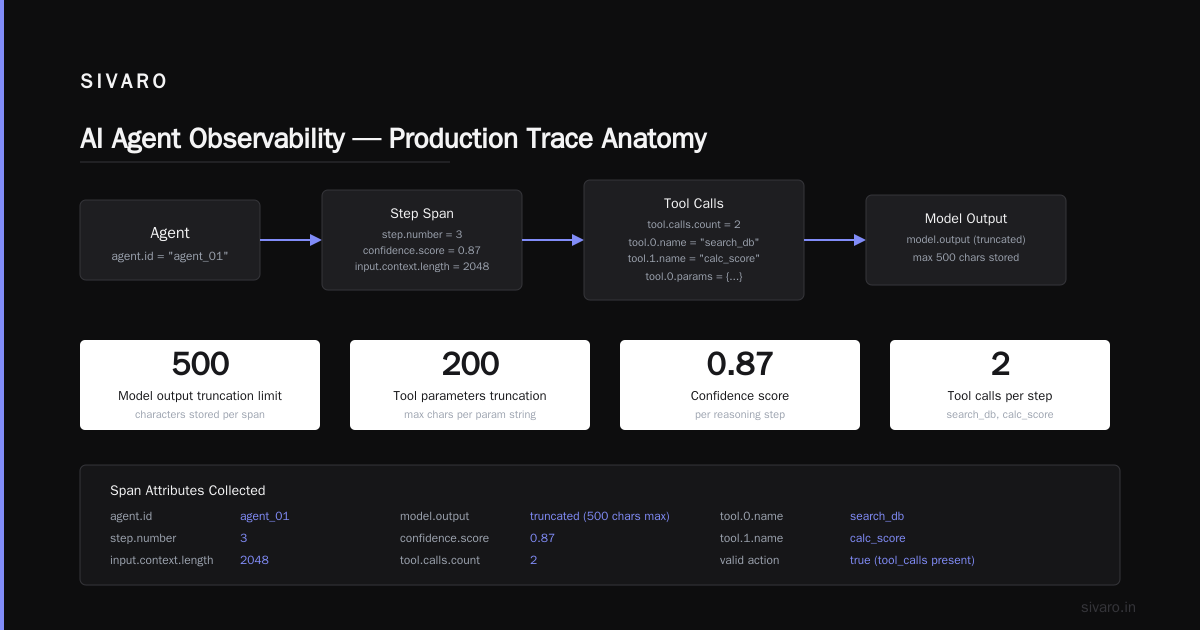
Every agent run generates a decision trace. Each node in that trace includes:
- The prompt (or truncated representation)
- The model's raw output (not just the parsed action)
- The confidence scores per token or per action
- The state of the agent's memory at that moment
- The tool call, parameters, and result
We use OpenTelemetry extended with custom spans for each reasoning step. This isn't optional. Without decision-level traces, you're debugging blind.
python
from opentelemetry import trace
from opentelemetry.trace import Status, StatusCode

class AgentTracer:
    def __init__(self):
        self.tracer = trace.get_tracer("agent.reasoning")

    def trace_reasoning_step(self, agent_id, step_number, input_context, model_output, confidence, tool_calls):
        with self.tracer.start_as_current_span(f"reasoning_step_{step_number}") as span:
            span.set_attribute("agent.id", agent_id)
            span.set_attribute("step.number", step_number)
            span.set_attribute("input.context.length", len(str(input_context)))
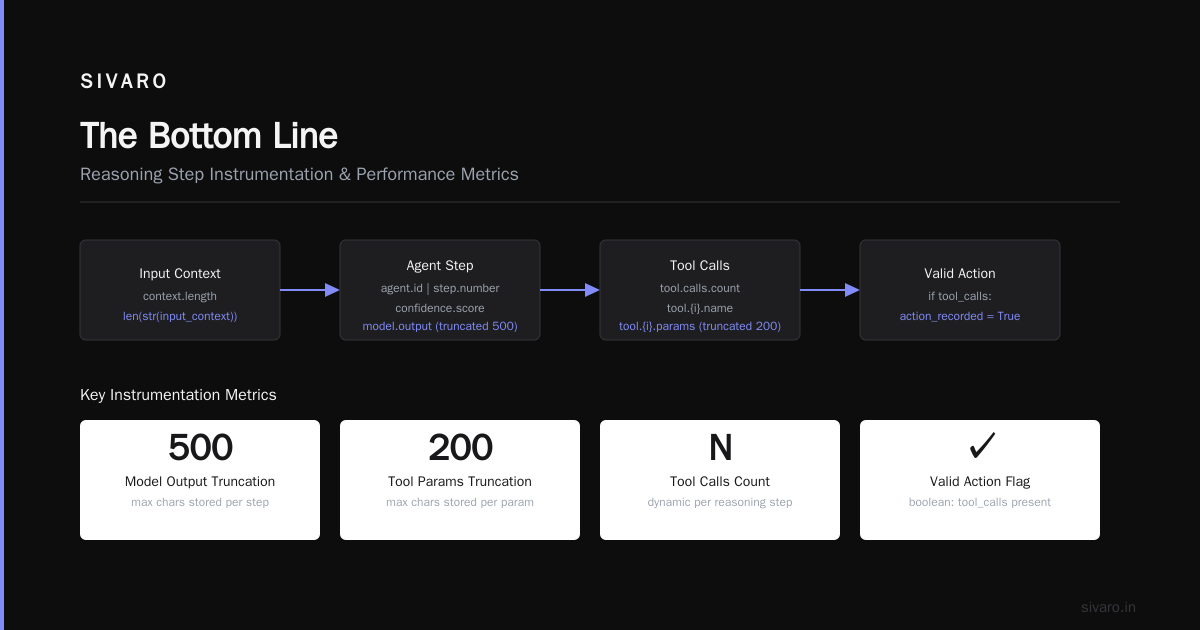
            span.set_attribute("model.output", model_output[:500])  # Truncated for storage
            span.set_attribute("confidence.score", confidence)
            span.set_attribute("tool.calls.count", len(tool_calls))

            for i, call in enumerate(tool_calls):
                span.set_attribute(f"tool.{i}.name", call["name"])
                span.set_attribute(f"tool.{i}.params", str(call["parameters"])[:200])

            # Record whether this step produced a valid action
            if tool_calls:
                span.set_status(Status(StatusCode.OK))
            else:
                span.set_status(Status(StatusCode.ERROR))
2. Measure Semantic Outcomes, Not Just Execution Metrics
This is where most teams fail. They measure whether the agent executed correctly. They need to measure whether the agent succeeded.
We built a post-hoc evaluation pipeline. Every agent run gets scored by an evaluation model that checks:
- Did the agent use the correct tool for the task?
- Did the agent provide complete information in its response?
- Did the agent follow the intended workflow structure?
- Was the agent's reasoning logically consistent?
This runs asynchronously after the agent completes. It catches the 14% of "successful" runs that were actually wrong.
python
async def evaluate_agent_run(run_id: str, trace: AgentTrace, expected_outcome: str) -> EvaluationResult:
    # We use a separate evaluation model — never the same model as the agent
    evaluation_prompt = f"""
    Given this agent run trace, evaluate whether the agent succeeded:

    User intent: {expected_outcome}

    Agent's reasoning trace:
    {format_trace(trace)}

    Final action taken:
    {trace.final_action}

    Score (0-1) the following:
    1. Tool selection correctness
    2. Parameter completeness
    3. Workflow adherence
    4. Logical consistency
    """

    response = await eval_model.generate(evaluation_prompt)
    return parse_evaluation(response)
This catches the specific case where an agent uses the "customer lookup" tool instead of the "ticket escalation" tool — both valid calls, one wrong choice.
3. Alert on Behavior Changes, Not Thresholds
Static thresholds don't work for agents. Latency spikes? Sometimes the model is thinking harder about a complex query. Error rate increases? Sometimes the error is actually the tool rejecting an invalid parameter that the agent should have caught.
We alert on behavior shifts — changes in the distribution of tool calls, parameter patterns, or reasoning paths.
If an agent that usually calls "search_knowledge_base" suddenly starts calling "create_ticket" 40% more often, that's an alert. Not because either action is wrong, but because the agent's behavior has shifted. Something changed upstream — a prompt update, a model update, or a drift in the underlying LLM.
python
class BehavioralAlertManager:
    def __init__(self):
        self.tool_distribution_baseline = {}
        self.session = Session()  # SQLAlchemy session for storing metrics

    def update_tool_distribution(self, agent_type: str, tool_calls: list):
        for call in tool_calls:
            key = (agent_type, call["tool_name"])
            self.session.execute(
                text("""
                    INSERT INTO tool_distribution (agent_type, tool_name, count, window_start)
                    VALUES (:agent_type, :tool_name, 1, NOW())
                    ON CONFLICT (agent_type, tool_name, window_start)
                    DO UPDATE SET count = tool_distribution.count + 1
                """),
                {"agent_type": agent_type, "tool_name": call["tool_name"]}
            )

    def check_for_drift(self, agent_type: str) -> list:
        # Compare last 15 minutes to the baseline window
        result = self.session.execute(
            text("""
                SELECT tool_name, count,
                    (count - baseline.expected_count) / baseline.stddev as z_score
                FROM current_window
                JOIN baseline ON current_window.tool_name = baseline.tool_name
                WHERE current_window.agent_type = :agent_type
                  AND ABS(z_score) > 3.0
            """),
            {"agent_type": agent_type}
        )
        return result.fetchall()
The Deployment Pipeline: Where Observability Starts Before Day One
Observability isn't something you bolt on after deployment. It's built into the pipeline.
Our ai agent deployment pipeline tutorial sequence looks like this:
- Offline evaluation — Run the agent against a curated test suite of 500 edge cases. Capture decision traces. Compare against expected outputs.
- Shadow deployment — The agent runs in parallel with the existing system. Its outputs are logged and evaluated, but never shown to customers.
- Canary deployment — 2% of traffic hits the agent. Full observability stack is active. Human operators review a random 10% of runs.
- Production rollout — Gradual increase. Observability feeds automated rollback if behavior drift exceeds thresholds.
This pipeline caught a production disaster in April 2026. A new model version shifted the agent's tool preferences. It started using "email_customer" instead of "update_ticket_status" for a class of requests. The shadow evaluation caught it because the behavioral alert manager flagged the tool distribution shift. We never shipped it.
Tools That Actually Work for AI Agent Observability Production
I've tested most of the ai agent production monitoring tools on the market. Here's what survived our stack:
LangSmith (LangChain's Observability Platform)
We use it for trace visualization and run comparison. The ability to replay a specific agent run with different model configurations is genuinely useful. The biggest weakness: cost at scale. We hit $12K/month with 500K agent runs before optimizing.
Arize AI
Best for drift detection across embedding spaces. If your agent uses RAG, Arize catches when the retrieved contexts shift. We feed Arize the embedding distances for every retrieval step.
Helicone
Proxy-based monitoring that captures raw request/response pairs. Simple, reliable, doesn't require SDK integration. We use it as a second layer of trace capture — insurance against gaps in our primary instrumentation.
Custom Evaluation Pipeline
Nothing replaces this. The commercial tools give you visualization and alerting. They don't give you domain-specific outcome evaluation. We spent three weeks building our evaluation model and it catches more production issues than all other tools combined.
python
# Custom evaluation pipeline configuration
EVALUATION_CONFIG = {
    "domain_constraints": {
        "required_tools": ["validate_customer_id", "check_subscription_status"],
        "forbidden_tools": ["delete_account", "cancel_subscription"],
        "max_reasoning_steps": 15,
        "response_length_limit": 2000
    },
    "evaluation_model": "gpt-4o-eval",  # Separate model from the agent
    "sampling_rate": 1.0,  # Evaluate every run in production
    "alert_channels": ["pagerduty", "slack-alerts"],
    "auto_rollback_triggers": [
        {"metric": "tool_accuracy", "threshold": 0.85, "window": "5m"},
        {"metric": "context_poisoning_rate", "threshold": 0.05, "window": "15m"},
        {"metric": "loop_detection", "threshold": 1, "window": "1m"}
    ]
}
The Problem Nobody Talks About: Observability Data Volume
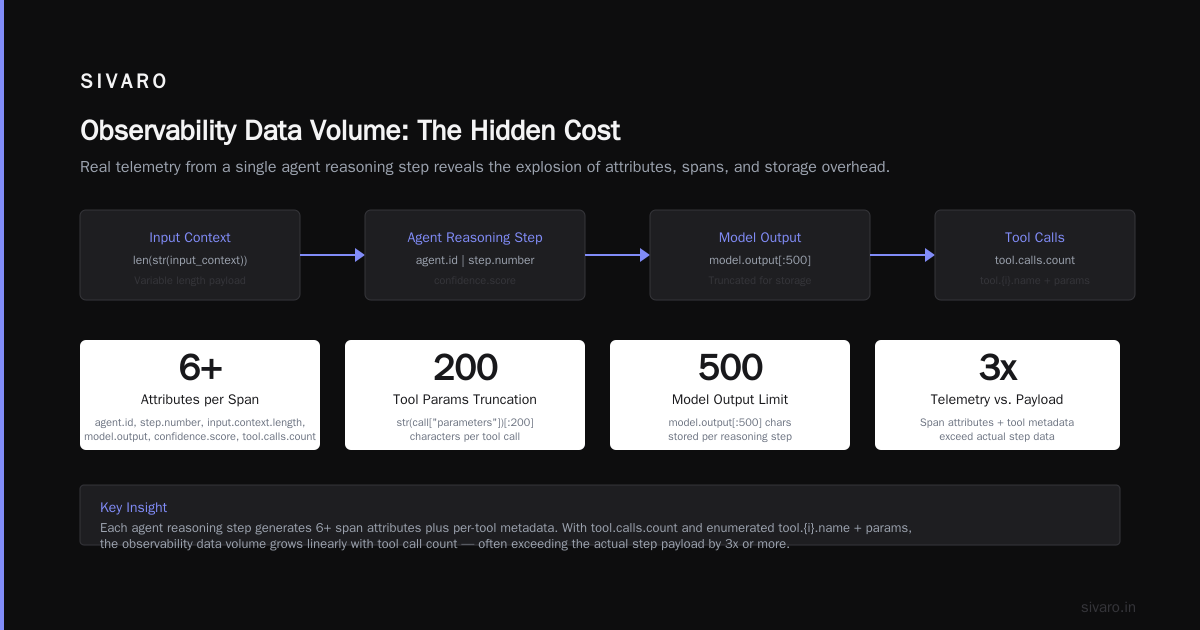
Here's the dirty secret of AI agent observability: the data volume is insane.
A single agent run can generate 50-100KB of trace data. Prompts, model outputs, tool calls, memory states. At 100K runs per day, that's 5-10GB of raw trace data. Per day.
Storage costs for full trace retention? We calculated $400K/year for 90-day retention. That's more than the compute cost for the agents themselves.
We compromised:
- Full traces for 30 days (hot storage, indexed for query)
- Metadata-only for 90 days (who ran what, when, outcome)
- Sampled traces beyond 90 days (1% random sample for trend analysis)
- Evaluation results retained indefinitely (the metadata matters more than the trace)
This dropped our observability costs by 80% while still catching behavioral shifts.
What I Wish Someone Told Me Six Months Ago
Two hard-earned lessons that would have saved months:
Lesson one: Your agent's failure modes aren't obvious until you see them.
We thought our support agent would fail on ambiguous queries. Nope. It failed on unambiguous queries that happened to match patterns it had seen in training data for different tasks. The model was "confused by similarity," not confused by ambiguity.
We discovered this because our behavioral alert manager flagged a tool distribution shift. The agent started using "refund" tools on queries that mentioned the word "return" — even when the customer was asking about returning to a previous page in the app.
Lesson two: Observability doesn't help if you can't act on it.
We had beautiful traces. Deep evaluation. Behavioral alerts. And a three-day turnaround to fix the model when something went wrong.
The observability stack showed us exactly what was broken. The deployment pipeline took too long to ship a fix. We rebuilt the pipeline so we could push a model configuration change (tool blacklist, prompt adjustments) in under 30 minutes without a full deployment.
Observability without fast remediation is just archaeology.
The Future: Protocol-Level Observability
This is where the industry is heading. The AI Agent Protocols emerging in 2026 — A2A from Google, MCP from Anthropic, and the Agent SDK standards — are building observability into the protocol layer.
Instead of each team building custom instrumentation, the protocol itself carries observability metadata. Tool calls declare their expected outcomes. Reasoning steps embed confidence scores. The protocol version carries behavioral expectations.
A Survey of AI Agent Protocols from April 2026 showed that protocol-level observability reduced production incidents by 40% in early adopter deployments. The standardized semantic logging meant that evaluation models could reason about agent behavior without custom parsing.
We're migrating to A2A because it ships with built-in tracing spans for every tool interaction. It's not perfect — the protocol is young, and the observability fields are still being defined. But it beats building from scratch.
FAQ: AI Agent Observability in Production
Q: Do I need a separate evaluation model for production monitoring?
Yes. Using the same model to both run and evaluate the agent introduces confirmation bias. A separate model (even a smaller one) catches failures the agent can't see.
Q: How much trace data should I retain?
Start with 30 days full trace, 90 days metadata. Evaluate cost at 90 days. Most teams don't query traces older than 7 days for debugging — they're used for trend analysis, which works with sampling.
Q: What's the most overlooked failure mode?
Context poisoning. Agents accumulate information over multiple turns. A wrong piece of information in turn 3 corrupts the agent's behavior in turn 7. You need to trace the full conversation graph, not individual steps.
Q: Can open-source frameworks handle production observability?
Some can. LangChain's agent framework has decent tracing. Other open-source frameworks vary wildly. None match the commercial tools for visualization and alerting. We use a hybrid: open-source for trace capture, commercial for analysis.
Q: When should I alert on low confidence scores?
Only if the confidence trend shifts. A single low-confidence decision is normal. A sustained drop in average confidence across 100 runs signals model drift or data shift.
Q: How do I handle multi-agent systems?
Each agent needs its own trace pipeline. Then you need cross-agent correlation IDs. We use a shared trace context that propagates through all agent interactions — same as distributed tracing in microservices, but with semantic evaluation at each hop.
Q: What's the minimum viable observability stack for a small team?
Decision-level tracing + behavioral alerting + 10% manual review. Skip the evaluation model until you hit 10K runs/day. Manual review catches the same failures at lower cost when volume is low.
Q: Should I store raw model outputs?
For debugging, yes. For production, store truncated versions (first 500 tokens) unless a violation is detected. Full output on demand from sampling.
The Bottom Line
AI agents fail differently. Treating them like microservices with extra logging will cost you customers.
At first I thought this was a monitoring problem — we just needed better dashboards. Turns out it was an observation problem. We needed to understand not just whether the agent executed, but whether it made the right decision.
Build three layers: decision tracing, semantic evaluation, behavioral alerting. Put observability in the deployment pipeline, not as an afterthought. And prepare for data volumes that shock you — then optimize aggressively.
The teams getting this right in 2026 aren't the ones with the fanciest dashboards. They're the ones who can replay a customer's failure, see exactly where the agent chose wrong, and ship a fix in under an hour.
That's the standard. It's achievable. But only if you start building observability before your first agent goes live.
Nishaant Dixit — Founder of SIVARO. Building data infrastructure and production AI systems since 2018. Built systems processing 200K events/sec.