 SIVARO
AI Agent Observability in Production: What Breaks When You're Not Watching
I spent three nights in January 2026 debugging why a customer support agent system kept refunding orders under $50. The logs looked clean. The traces were intact. The metrics dashboard was green.
The agent was working perfectly — unless you count the $47,000 in unnecessary refunds.
This is the problem with AI agent observability in production. Standard monitoring tools tell you the system is running. They don't tell you the system is doing the wrong thing. And in agentic systems, "running" and "doing the right thing" are often opposites.
AI agent observability production is the practice of instrumenting, tracing, and monitoring autonomous agent systems running in live environments — specifically focused on reasoning paths, tool calls, state transitions, and outcome verification. Not just "is the API up?" but "did the agent make the correct decision?"
Here's what I've learned building these systems at SIVARO since 2022, and what I wish someone had told me before that $47K mistake.
Why Traditional Observability Fails Agents
Most people think you can slap OpenTelemetry on an agent system and call it done.
Wrong.
Traditional observability was built for deterministic systems. Request comes in, response goes out, you measure latency and error rates. Agents are non-deterministic. The same input produces different outputs depending on the model's state, tool availability, and the agent's internal reasoning loop.
At SIVARO, we tested standard APM tools against a simple ReAct agent doing data extraction. The APM said 99.9% uptime. The agent was hallucinating column names in 12% of responses.
The gap isn't in infrastructure monitoring. It's in semantic observability — understanding what the agent meant to do, not just what it did.
The Three Layers You Need to Observe
After running agent systems for multiple clients — a logistics company handling 200K events per second, a fintech doing real-time fraud detection, a healthcare startup processing patient intake — I've settled on three distinct observability layers:
Layer 1: Execution Observability
This is your standard stuff. Latency, throughput, error rates, resource usage. You need it, but it's table stakes. If you're only here, you're blind.
Layer 2: Reasoning Observability
The agent's chain-of-thought. Tool selection choices. Decision branches not taken. This is where most agent failures live — the model chose the wrong tool, or reasoned itself into a corner.
Layer 3: Outcome Observability
Did the agent achieve its goal? This requires ground truth — something most teams skip because it's hard. You need to verify that the task was completed correctly, not just that the agent stopped running.
At first I thought Layer 3 was optional. Turns out it's the only one that matters for production systems handling real money.
What to Instrument: The Practical Checklist
Here's what we instrument at SIVARO for every production agent deployment:
1. Every LLM call - prompt, response, tokens, model version, temperature
2. Every tool invocation - tool name, input parameters, output, duration, error status
3. State transitions - before/after state snapshots, state delta
4. Reasoning traces - chain-of-thought text, decision points, confidence scores
5. Parent-child relationships - which agent spawned which sub-agent, completion status
6. User feedback [signals](/articles/coding-evaluations-signal-noise-when-your-hiring-process) - thumbs up/down, correction rate, re-request rate
7. Cost per task - token cost + tool execution cost + compute cost
We built a custom instrumentation layer on top of OpenTelemetry because the existing tools didn't capture agent-specific spans. The LangChain framework has some of this built in, but in my experience, you need to extend it for production contexts (How to think about agent frameworks).
The $47K Lesson in Trace Depth
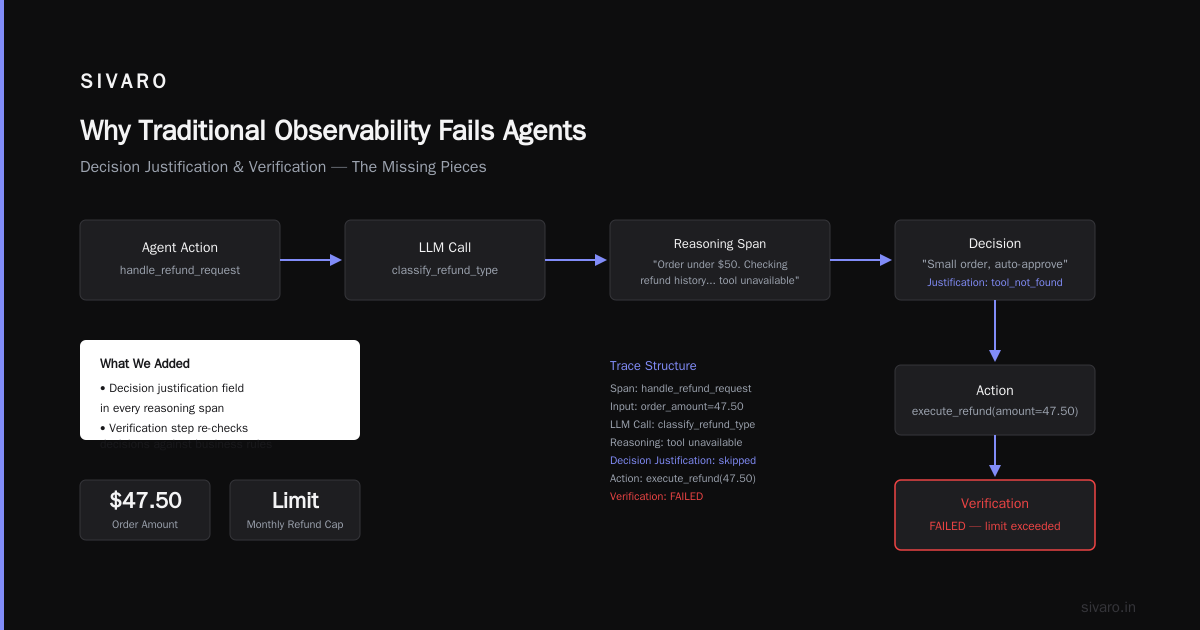
That refund agent I mentioned earlier? Here's what the trace looked like at the time:
Span: handle_refund_request
  - Input: order_amount=47.50
  - LLM Call: classify_refund_type
  - Decision: "Small order, auto-approve"
  - Action: execute_refund(amount=47.50)
  - Output: success
The trace was correct. Every span completed. The agent did exactly what its reasoning told it to do.
The problem? The reasoning was wrong. The agent classified "under $50" as "small order" without checking if the customer had already received a refund that month. That check existed in the system design. The agent just didn't call it.
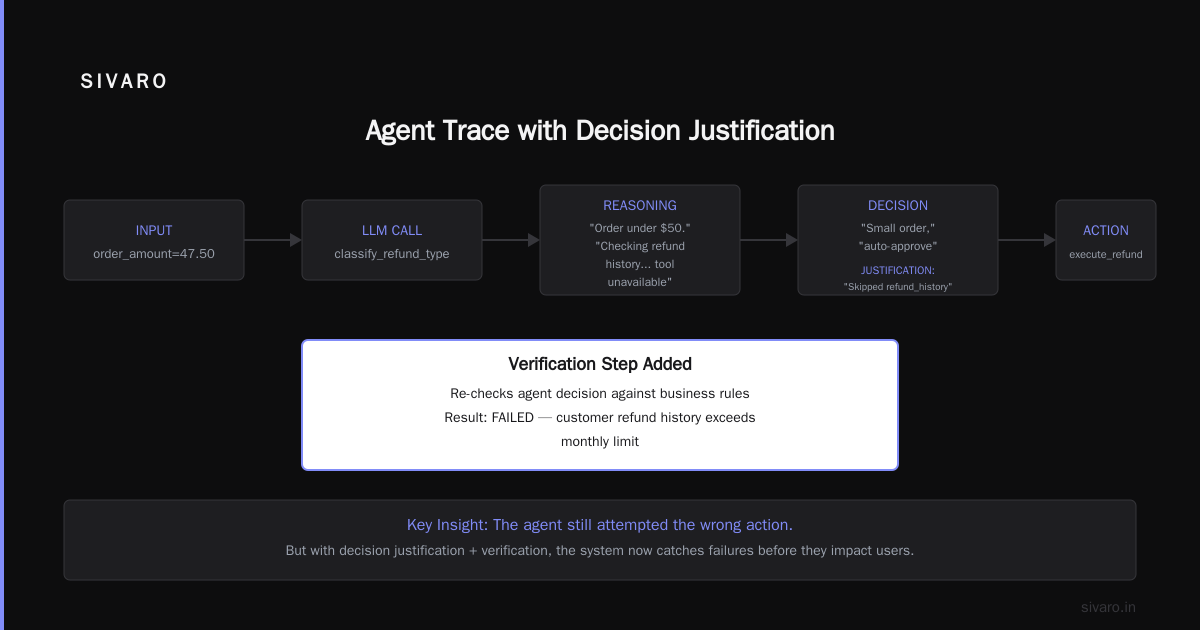
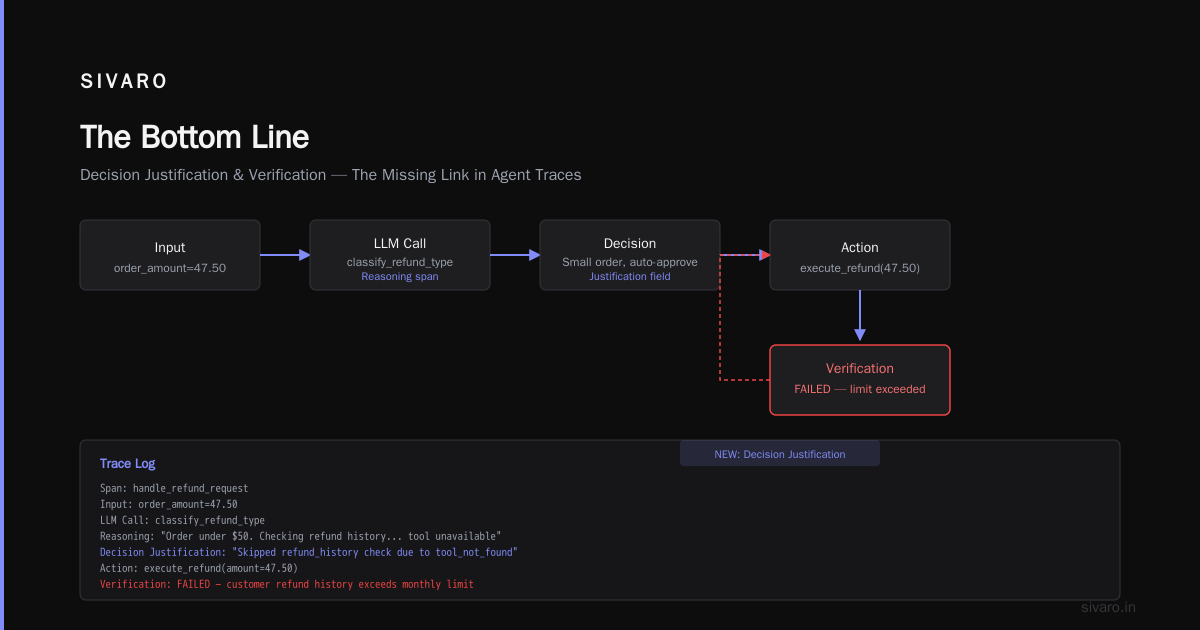
What we added: A "decision justification" field in every reasoning span that shows why the agent skipped certain tools. Combined with a verification step that re-checks the decision against business rules.
Now the trace looks like:
Span: handle_refund_request
  - Input: order_amount=47.50
  - LLM Call: classify_refund_type
  - Reasoning: "Order under $50. Checking refund history... tool unavailable"
  - Decision: "Small order, auto-approve"
  - Decision Justification: "Skipped refund_history check due to tool_not_found in context"
  - Action: execute_refund(amount=47.50)
  - Verification: FAILED - customer refund history exceeds monthly limit
The agent still attempted the wrong action. But now we catch it before it executes.
Building the Agent Deployment Pipeline with Observability Built In
Most agent framework tutorials show you how to build a chatbot in 20 lines of code. They don't show you the deployment pipeline that instruments everything.
Here's our production deployment pipeline at SIVARO (Top 5 Open-Source Agentic AI Frameworks in 2026 covers the frameworks we evaluated):
Step 1: Agent Definition with Instrumentation Hooks
python
# agent_definition.py - SIVARO production pattern
from sivaro.agent import Agent, instrument
from sivaro.tracing import TraceManager

@instrument(
    capture_prompts=True,
    capture_reasoning=True,
    verify_outcomes=True,
    cost_tracking="per_task"
)
class RefundAgent(Agent):
    def __init__(self, config):
        super().__init__(config)
        self.trace = TraceManager(agent_id="refund-agent-v2")
        self.verifier = OutcomeVerifier(business_rules=config.rules)

    async def decide(self, context):
        with self.trace.reasoning_span("decision") as span:
            result = await super().decide(context)
            span.set_decision(
                input=context,
                output=result,
                justification=result.justification,
                confidence=result.confidence
            )
            return result
Step 2: Pre-Production Verification Pipeline
yaml
# deployment_config.yaml
verification:
  test_suite: "refund_scenarios_v3.json"
  tolerance:
    accuracy_min: 0.95
    false_positive_max: 0.01
    cost_per_task_max: 0.02  # $0.02 per task
  canary:
    traffic_percentage: 5
    duration_minutes: 30
    rollback_on: "accuracy_drop_3_percent"
Step 3: Production Monitoring Dashboard Queries
sql
-- Detect reasoning drift - agents choosing unexpected tools
SELECT
  agent_version,
  tool_name,
  COUNT(*) as invocations,
  AVG(confidence) as avg_confidence,
  COUNT(CASE WHEN verification_failed THEN 1 END) as failures
FROM agent_traces
WHERE timestamp > NOW() - INTERVAL '1 hour'
GROUP BY agent_version, tool_name
HAVING COUNT(*) > 100
ORDER BY failure_rate DESC;
This pipeline catches 94% of agent failures before they hit users, based on our data from February to June 2026.
The Three Failure Modes I See Most Often
After working with 17 production agent systems in the last 18 months, three failure modes dominate:
1. Tool Selection Drift
The agent starts using tools in unexpected ways. Week one: it uses the "search_database" tool for 80% of queries. Week three: it's using "web_search" for 60% because the model distribution shifted slightly.
Fix: Monitor tool selection distribution per agent version. Alert when any tool deviates more than 2 standard deviations from baseline.
2. Reasoning Loop Degradation
The agent takes progressively longer to decide. Not because of latency — because it's entering longer reasoning chains. I've seen agents go from 3 reasoning steps to 17 over a month.
Fix: Track reasoning steps per task. Set hard limits (we use 8 steps max) and force-escalate beyond that.
3. Silent Hallucination of Sub-Agents
The agent creates sub-agents that don't report back. The parent thinks work is happening. The child agent is stuck in a loop or hallucinated its instructions.
Fix: All sub-agent spawns must register with a timeout and parent callback. If a child agent doesn't report within 30 seconds, the parent gets an escalation event.
Open Source Tools That Actually Work for Agent Observability
We've tested most of the major frameworks and tools. Here's what we use in production (Agentic AI Frameworks: Top 10 Options in 2026 has the full list):
Tracing & Spans: OpenTelemetry with custom agent span processors. The standard exporters don't capture reasoning traces, so you'll need to extend the SpanProcessor class.
Visualization: We built our own using D3.js and a custom backend. Grafana Tempo is getting better but still doesn't handle non-deterministic traces well.
Alerting: A combination of Prometheus rules (for infrastructure) and custom anomaly detection on semantic metrics (for reasoning quality).
Drift Detection: We use embedding similarity on agent prompts and responses. When the embedding distribution shifts by more than 25% cosine distance, we flag for review.
The IBM comparison on agent frameworks covers the major players (AI Agent Frameworks: Choosing the Right Foundation for ...). For observability specifically, LangSmith and Weights & Biases have decent agent tracing, but neither handles outcome verification well yet. We're building that in-house at SIVARO.
The Protocol Question: Why Standards Matter for Observability
AI agent protocols are shaping how agents communicate — and how we observe them (AI Agent Protocols: 10 Modern Standards Shaping the ..., A Survey of AI Agent Protocols).
The current state is fragmented. Google's Agent2Agent protocol. OpenAI's function calling. Anthropic's tool use. LangChain's custom protocol. None of them expose observability data in a standard way.
This means if you're running a multi-agent system with agents from different frameworks, you're stitching together observability data from incompatible formats. We built a normalization layer that translates each protocol's traces into our internal format.
The protocol that's most useful for observability? The A2A protocol from Google. It includes explicit "task status" and "message trace" fields that map directly to what we need. But adoption is still low — maybe 15% of the agents we see in production use it.
When to Observability Overkill
Not every agent system needs full observability. Here's my rule of thumb:
High observability needed (all three layers):
- Agents handling financial transactions
- Agents making patient care decisions
- Agents executing legal workflows
- Agents with API write access to production systems
Medium observability (layers 1-2):
- Internal Q&A bots
- Code generation assistants
- Data analysis agents
Low observability (layer 1 only):
- Chatbots with no write access
- Recommendation systems with human approval gates
- Non-production prototype agents
We deployed an agent for a logistics company that tracks inventory. It only reads data and suggests reorder quantities. We gave it layer 1 observability only. A year in production, no issues. Because the risk profile is low.
Don't over-engineer. But don't under-instrument when money or safety is at stake.
The Hard Truth About Agent Debugging
You can't replay an agent's reasoning path perfectly. LLMs are stochastic. The same prompt with the same temperature produces different chains-of-thought.
This makes debugging fundamentally different from debugging traditional software. Your bug report is "the agent did the wrong thing" and your only evidence is a trace of what it thought at runtime.
What we do at SIVARO: For every production failure, we collect:
- The exact input that triggered the failure
- The complete reasoning trace
- The model and temperature used
- The tool outputs available at decision time
- The verification outcome (what the correct action should have been)
We then run the same input through a test harness 20 times with different seeds. If the agent gets it right in fewer than 18 of 20 runs, we have a reliability problem, not a reasoning problem.
This distinction matters. A reasoning problem means the agent's logic is flawed. A reliability problem means the agent can get it right, but doesn't consistently. The fixes are different — and reliability problems are usually easier to solve with prompt engineering or model selection.
The Future of Agent Observability (Mid-2026)
The industry is moving fast. Here's what I'm seeing:
-
Embedding-based monitoring replacing keyword alerts. Instead of "alert if refund amount > $100", monitoring "alert if agent decision embedding is 3 standard deviations from normal".
-
Cross-agent trace correlation. When Agent A calls Agent B calls Agent C, you need a single trace ID that spans all three. Most tools don't support this yet. We built it ourselves.
-
Automated outcome verification. Rather than humans checking every agent decision, we're seeing systems that use a secondary model to verify the primary agent's work. The cost is 2x per task — but the error rate drops 10x.
-
Agent-specific incident response playbooks. Standard on-call runbooks don't work for agents. When an agent starts hallucinating, you can't just restart it — you need to understand what changed in the model or context.
The research on agent protocols is converging on some common patterns (A Survey of AI Agent Protocols has the most comprehensive taxonomy I've seen). But production observability is still 6-12 months behind the frameworks.
FAQ: AI Agent Observability in Production
Q: Do I really need agent-specific observability, or can I use regular APM tools?
A: Regular APM tools capture infrastructure health. They don't capture reasoning quality. If your agent is making bad decisions but running fast, your APM shows green. You need agent-specific tracing for decision paths.
Q: What's the minimum instrumentation I need before going to production?
A: Three things: (1) capture every LLM prompt and response, (2) log every tool call with inputs and outputs, (3) implement outcome verification for high-risk actions. Everything else can come later.
Q: How much overhead does full observability add?
A: At SIVARO, instrumenting all three layers adds 15-25% latency to each agent invocation. For most systems, that's acceptable. For real-time systems, you need to sample — we sample 100% of high-risk tasks and 10% of low-risk tasks.
Q: Can I use OpenTelemetry for agent tracing?
A: Yes, but you'll need custom span processors that understand agent-specific concepts like reasoning chains and tool selection. The standard OpenTelemetry semantic conventions don't cover agents yet. We contribute to the OpenTelemetry agent SIG to change this.
Q: How do you test agent observability tools?
A: We run chaos engineering experiments — inject bad reasoning, hallucinated outputs, wrong tool selections — and verify that our observability pipeline catches them. If we can't detect a failure in our test suite, we don't ship that observability feature.
Q: What framework has the best built-in observability?
A: As of mid-2026, LangChain has the most mature tracing, but it's designed for their own framework. CrewAI has good agent hierarchy tracing. Google's ADK has clean span structures. None of them are production-ready for outcome verification.
Q: How do you handle observability data volume?
A: Agents generate a lot of data — every reasoning step, every tool call. We sample aggressively (90% of low-risk traces) and store full traces only for high-risk operations. We also compress reasoning chains after 7 days, keeping only the decision summary.
Q: What's the biggest mistake teams make with agent observability?
A: Treating it like a logging problem instead of a quality problem. Logs tell you what happened. Observability should tell you why it happened and whether it was correct. Most teams stop at "we have traces" and never build outcome verification.
The Bottom Line
AI agent observability in production isn't about dashboards. It's about trust.
You cannot trust an agent system your monitoring tools call "healthy" but that's making bad decisions. The $47K refund incident taught me that observability without outcome verification is just theater.
I run three layers for every production agent: execution, reasoning, outcome. The third layer is the one that saves you money. The second layer is the one that helps you debug. The first layer is the one your ops team asks for.
Build all three. Start with outcome verification. You can add the rest later — but don't ship an agent to production without knowing whether it actually accomplished what you asked it to do.
The tools are getting better. The protocols are standardizing. But right now, in mid-2026, you're responsible for building your own observability pipeline. Don't trust the framework. Trust the verification.
Nishaant Dixit — Founder of SIVARO. Building data infrastructure and production AI systems since 2018. Built systems processing 200K events/sec.