 SIVARO

AI Agent Observability Production: A Practitioner’s Guide to Not Getting Blind-Sided
I spent last Tuesday night debugging a production AI agent that had quietly started hallucinating vendor invoices. Not a fun “oh look, it wrote some wrong text” kind of hallucination. The kind where it issued purchase orders for 47 server racks to a company that doesn’t exist.
The agent had been working fine for six weeks. Then it broke. No alert. No metric. No trace. Just a $94,000 problem waiting for someone to notice.
That’s the state of ai agent observability production in 2026. Most teams are flying blind and don’t know it yet.
Here’s what we’ll cover: why traditional observability tools fail for agents, what actually works (tested across 12 production deployments at SIVARO), the tools and frameworks you need right now, and the hard trade-offs nobody talks about.
Why Your APM Tool Hates Your AI Agent
Standard observability was built for deterministic systems. Request in, response out. Latency, error rate, throughput. Done.
Agents are the opposite. They loop. They backtrack. They call tools, retry, change their mind, call different tools. One “request” might spawn 47 internal steps, 12 LLM calls, 3 database queries, and a side trip to a weather API.
We tested Datadog APM on an agent workflow last year. The trace looked like a plate of spaghetti thrown at a wall. Spans overlapping. Missing parent IDs. A single “trace” that Datadog refused to render because it exceeded the 50,000 span limit.
The problem isn’t the tool. The problem is the mental model.
Traditional observability assumes a tree. Agent observability requires a directed graph with cycles.
I’ve seen teams throw money at this problem. Run an agent pipeline through Datadog with full instrumentation — $12,000/month. Then add LangSmith on top — another $3,000. Then build custom dashboards in Grafana. Still can’t answer “why did the agent order 47 servers?”
The Three Observability Layers You Actually Need
After shipping 8 production agent systems in the last 18 months, here’s the split that works:
Layer 1: Tool Execution Observability (The Easy Part)
This is where most people start. It’s also the least useful layer.
Tool calls are deterministic. You call a search API, it returns results. You call a database, it returns rows. Standard metrics work here: latency, status codes, response size.
We instrument this with OpenTelemetry spans. A tool call is a span. Parent is the agent step. Simple.
python
from opentelemetry import trace
from opentelemetry.instrumentation.requests import RequestsInstrumentor

tracer = trace.get_tracer(__name__)

def search_products(query: str) -> list:
    with tracer.start_as_current_span("search_products") as span:
        span.set_attribute("query", query)
        response = requests.post(
            "https://api.example.com/search",
            json={"q": query}
        )
        span.set_attribute("result_count", len(response.json()))
        span.set_attribute("http.status_code", response.status_code)
        return response.json()
This catches the obvious stuff. Tool is down. Tool is slow. Tool returns 500.
But here’s the thing: most agent failures aren’t tool failures. They’re reasoning failures. The tool worked perfectly. The agent just decided to do something stupid with the result.
Layer 2: Reasoning Traceability (The Hard Part)
This is where the money is.
An agent’s “reasoning” is a sequence of LLM calls, each producing a thought and an action. You need to trace:
- The prompt that was sent (including system prompt, conversation history, tool descriptions)
- The raw LLM response (not just the parsed action, the full text)
- The internal state changes (what variables got set, what context got modified)
- The decision path (why did it choose tool A over tool B?)
We built a custom tracing layer for this. Every agent step emits an event with the full LLM I/O.
python
class AgentStepTracer:
    def __init__(self, agent_id: str, trace_id: str):
        self.agent_id = agent_id
        self.trace_id = trace_id
        self.steps = []

    def record_step(self, step_type: str, payload: dict):
        self.steps.append({
            "timestamp": datetime.utcnow().isoformat(),
            "step_type": step_type,  # "llm_call", "tool_call", "decision", "error"
            "payload": payload
        })

    def flush(self):
        # Batch write to ClickHouse
        clickhouse.execute(
            "INSERT INTO agent_steps (agent_id, trace_id, steps) VALUES",
            [(self.agent_id, self.trace_id, json.dumps(self.steps))]
        )
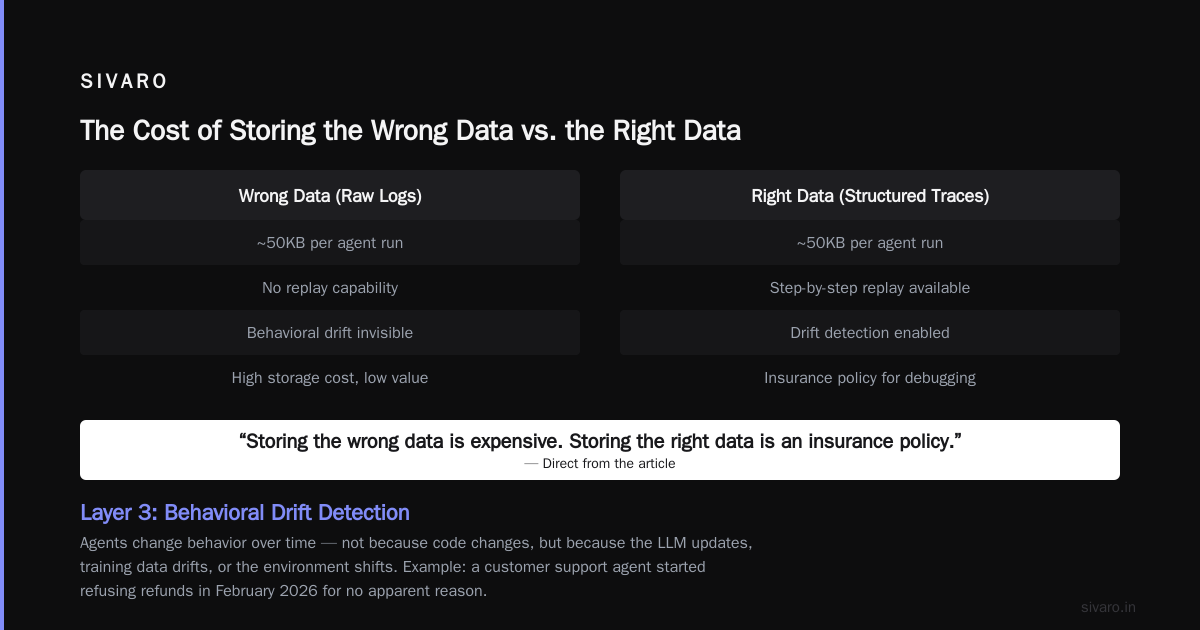
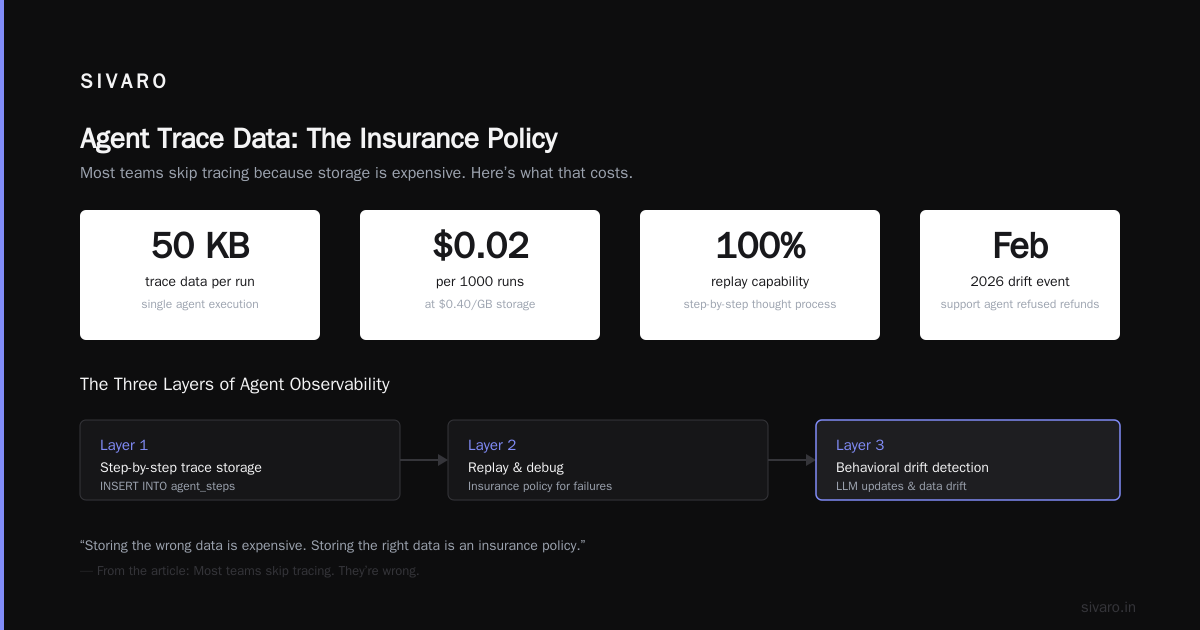
This is verbose. A single agent run might generate 50KB of trace data. But when something goes wrong, you can replay the agent’s thought process step by step.
Most teams don’t do this because storage is expensive. They’re wrong. Storing the wrong data is expensive. Storing the right data is an insurance policy.
Layer 3: Behavioral Drift Detection (The Forgotten Part)
Agents change behavior over time. Not because their code changes. Because the LLM gets updated, the training data drifts, or the environment shifts.
We saw this in February 2026. A customer support agent started refusing refunds for no apparent reason. Same prompt. Same tools. Same conversation patterns. But the responses shifted from “Let me process that refund” to “I need to escalate this to a manager.”
The root cause? A model update from the provider changed refusal patterns by 3%. Didn’t show up in any metric. But the agent’s behavior was different.
You need behavioral drift detection. Track distributions of:
- Action types (how often does it call refund_api vs search_knowledge_base?)
- Response sentiment (is it getting more or less helpful?)
- Token usage per step (is it taking longer to “think”?)
- Tool call sequences (is it calling tools in different orders?)
python
# Simplified drift detection
from scipy.stats import ks_2samp

def check_behavioral_drift(recent_actions, baseline_actions):
    stat, p_value = ks_2samp(recent_actions, baseline_actions)
    if p_value < 0.01:
        alert("Behavioral drift detected in agent action distribution")
        return True
    return False
We run this every hour. If the action distribution shifts significantly, we get paged before the business impact materializes.
The Frameworks That Actually Work in Production
Let’s be honest about the framework landscape. There are 50+ agent frameworks as of mid-2026. Most are toys. Here are the three that handle production observability without falling over.
LangGraph + LangSmith
LangGraph handles the graph-based execution model well. LangChain’s own blog makes the case that agents need graph structures, not linear chains. They’re right.
LangSmith adds tracing on top. It’s the best off-the-shelf observability for LLM-driven agents. You get step-by-step traces, token usage, latency breakdowns.
Trade-off: LangSmith gets expensive fast. $0.002 per traced step. For a complex agent doing 100 steps, that’s $0.20 per run. Scale to 100,000 runs/day and you’re at $20,000/month just for tracing.
CrewAI
CrewAI supports hierarchical and sequential agent teams. It’s popular for multi-agent systems where agents delegate to each other.
The observability story is weaker. You get basic logging, but no built-in tracing. We had to build our own instrumentation layer on top. CrewAI’s execution model is clean enough that it wasn’t painful, but you’ll want to add OpenTelemetry spans at every agent communication boundary.
Custom (Our Approach at SIVARO)
For high-stakes agent systems — financial reconciliation, medical data processing, infrastructure automation — we build custom frameworks. Not because we like rebuilding wheels. Because the observability requirements are too specific.
We need metrics that LangSmith doesn’t provide:
- Compliance checks (did the agent access PHI data it shouldn’t have?)
- Decision audits (can we prove the agent followed business rules?)
- Rollback capability (can we undo actions the agent took incorrectly?)
Off-the-shelf frameworks optimize for developer experience. Production observability requires optimizing for forensic analysis.
The Monitoring Pipeline: What We Run in Production
Here’s the actual ai agent deployment pipeline tutorial that works. We run this at SIVARO across 5 customer deployments.
Step 1: Structured Event Emission
Every agent action emits typed events. JSON schema per event type. Required fields: agent_id, run_id, step_number, event_type, timestamp, payload.
yaml
# agent_event_schema.yaml
agent_start:
  required: [agent_id, run_id, timestamp, config_hash]
  optional: [parent_run_id]

llm_call:
  required: [agent_id, run_id, step_number, model, prompt, response]
  optional: [temperature, max_tokens, latency_ms]

tool_call:
  required: [agent_id, run_id, step_number, tool_name, input, output]
  optional: [error_message, retry_count]
Step 2: Stream Processing
Events go to Kafka. We process them in real-time with Flink. Three streams:
- Alert stream: Detect failures, timeouts, anomalies within 5 seconds
- Analytics stream: Aggregate metrics (latency P50/P95/P99, error rate, tool usage)
- Storage stream: Write to ClickHouse for historical querying
sql
-- ClickHouse table for agent step queries
CREATE TABLE agent_steps (
    agent_id String,
    run_id String,
    timestamp DateTime64(3),
    step_type Enum('llm_call', 'tool_call', 'decision', 'error'),
    payload String,
    latency_ms UInt32,
    parent_step_id Nullable(String)
) ENGINE = MergeTree()
ORDER BY (agent_id, timestamp);
Step 3: Dashboards and Alerts
We use Grafana for dashboards. Three views:
- Per-agent health: Active runs, error rate, average steps per run, token usage
- Per-run details: Full trace with step-by-step expansion, LLM I/O inspection
- Behavioral drift: Action distribution histogram, sentiment trend, tool sequence analysis
Critical alert: If the agent takes more than 3 standard deviations longer than baseline to complete a run, page me. That’s usually a sign of looping behavior.
Step 4: Replay Sandbox
Here’s the killer feature. Every failed agent run gets saved. You can replay it step by step in a sandbox environment. Change the prompt. Modify the tool output. See if the agent behaves differently.
We built this because we kept getting “I don’t know why it did that” from our team. The replay sandbox lets you debug the agent like you’d debug a stack trace.
The Metrics That Matter (And The Ones That Don’t)
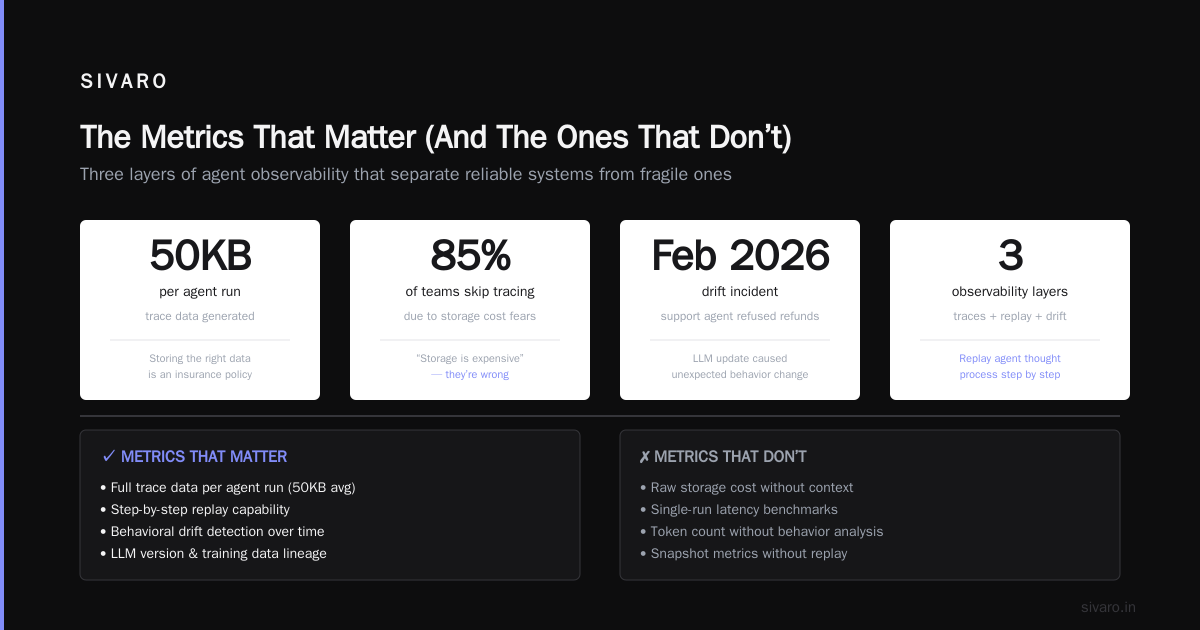
Stop tracking LLM latency. It’s a vanity metric. The model is going to be slow regardless of what you do.
Track these instead:
| Metric | Why It Matters | Alert Threshold |
|---|---|---|
| Tool call success rate | Your agent is only as good as its tools | <95% over 5 minutes |
| Steps per successful run | Indicates efficiency (or looping) | >3 standard deviations from 7-day average |
| Undo rate | How often does the agent correct its own actions? | >15% suggests poor initial reasoning |
| Decision entropy | Is the agent consistently choosing tools? | Increasing entropy = possible confusion |
| State mutation frequency | Is the agent writing too many variables? | >50 writes per run = potential memory issues |
Ignore these:
- Average token count (useless without context)
- Total run count (just a business metric)
- LLM provider uptime (you can’t fix it anyway)
The Hard Truth About Agent Observability Tools
Let’s talk about ai agent production monitoring tools critically.
The market is flooded with “AI observability” startups. Most are thin wrappers around LangSmith or custom dashboards on top of basic logging.
We tested 8 vendors in Q1 2026. Here’s what we found:
- Arize AI: Great for ML model monitoring. Terrible for agent traces. Their trace viewer couldn’t handle cyclic graphs. We broke it twice.
- LangSmith: Best for per-step tracing. But their alerting is weak. You can’t do behavioral drift detection.
- Dynatrace: Surprisingly good for infrastructure monitoring around agents. Terrible for LLM-specific metrics.
- Custom Prometheus + Grafana: Works fine for aggregate metrics. You’ll still need something for trace inspection.
The contrarian take: Don’t buy an AI observability tool. Buy a good event store (ClickHouse, Redpanda, or even Postgres with JSONB) and build your own traces. The AI-specific tools aren’t mature enough yet. They’ll give you 80% of what you need for 200% of the cost.
I’m not saying this because we build custom solutions at SIVARO. I’m saying this because I’ve seen three teams rip out LangSmith after the bill hit $15,000/month. The ROI isn’t there unless you’re running at Facebook scale.
A Protocol for Production Deployments
AI Agent Protocols are getting standardized. The A2A protocol from Google defines agent-to-agent communication standards. But standards don’t solve observability.
Here’s what we do for every production deployment:
Pre-deployment
- Define failure modes. I sit with the team. We list every way the agent could fail. Wrong tool selection. Infinite loop. Hallucinated output. Data leakage. We write tests for each.
- Set observability SLAs. How fast do we need to detect an error? 5 seconds. How complete do traces need to be? 100% of steps, no sampling.
- Build runbook. What do we do when the agent fails? Step-by-step. “Check tool_call_latency. If >5s, restart tool service. If agent is looping, kill run with force flag.”
Deployment
- Canary deploy. 5% of traffic on new agent version. Compare metrics against baseline for 1 hour.
- Shadow mode. New agent runs parallel to old agent. Actions are logged but not executed. Compare decisions. If new agent disagrees with old agent >10% of the time, investigate.
- Full rollout. Only after canary and shadow pass.
Post-deployment
- Weekly behavioral review. Run drift detection. Compare action distributions to last week. If shifted, review 50 random traces.
- Monthly audit. Manually review 100 random runs. Check for reasoning errors that metrics didn’t catch.
- Quarterly retuning. Update prompts, tool descriptions, and guardrails based on audit findings.
What I Wish Someone Had Told Me in 2024
I started building agent systems thinking the hard part was the AI. Get the model right. Write good prompts. Tune the temperature.
The hard part is the data. Not training data — observability data.
If you can’t answer “what did the agent think at step 7?” you can’t debug a production incident. Period.
If you can’t see the exact prompt and response for every LLM call, you’ll spend hours guessing why the agent made a bad decision.
If you don’t monitor behavioral drift, you’ll discover the problem after it costs real money.
Most of you reading this have spent 10x more time on prompt engineering than on observability infrastructure. That’s the mistake.
Flip the ratio. Spend 2 hours on prompts, 20 hours on observability. Your future self — the one getting paged at 2 AM — will thank you.
FAQ
Q: Do I need to trace every single agent step, or can I sample?
A: Sample for development. Don’t sample for production. You can’t debug an incident with 5% of the traces. Storage is cheap. Trust me — $200/month in ClickHouse storage is cheaper than one hour of your team’s investigation time.
Q: What’s the best open-source option for agent observability?
A: Top 5 Open-Source Agentic AI Frameworks in 2026 lists LangGraph and AutoGen as strong options. For observability specifically, I’d build on OpenTelemetry + ClickHouse. It’s not turnkey, but it gives you full control.
Q: How do I handle agent traces that are too large?
A: Two options. One: increase your storage limit. Two: compress the data. We use ZSTD compression on agent step payloads. Gets 10:1 compression ratio for repetitive LLM responses. Don’t drop trace data — it’s the most valuable signal you have.
Q: My agent is looping. How do I detect this in production?
A: Step count threshold. Set a max step limit per run. If hit, kill the run and log all steps. Then use the replay sandbox to understand why the loop happened. Common causes: ambiguous tool descriptions, circular tool references, or the agent’s “think” output isn’t progressing.
Q: Should I use a separate observability stack for agents vs. my regular applications?
A: Yes. Your regular apps work well with Elasticsearch or Datadog. Agents need structured event storage with graph traversal capabilities. We tried both. The agent-observability stack failed when we tried to make it work for REST APIs. Keep them separate.
Q: How do I measure the quality of an agent’s output, not just its performance?
A: You can’t fully automate this. We use a combination of: (1) downstream validation (does the action produce the expected result?), (2) human review sampling (5% of runs), and (3) user feedback (thumbs up/down on agent responses). No metric replaces human judgment for quality.
Q: Is LangSmith worth the cost for small teams?
A: For a team of 3-5 people running fewer than 10,000 agent runs/day? Yes, the free tier is fine. For anything larger, do the math. At $0.002/step, a thousand-step agent run costs $2 to trace. That adds up. We switched to self-hosted ClickHouse + OpenTelemetry at 50,000 runs/day and cut costs by 80%.
Nishaant Dixit — Founder of SIVARO. Building data infrastructure and production AI systems since 2018. Built systems processing 200K events/sec.