 SIVARO
AI Agent Observability: Production Monitoring That Works
I spent four days in May chasing a ghost. Our system at SIVARO was fine. Then a client's AI agent started making decisions that looked perfectly reasonable but were subtly, catastrophically wrong. No crash. No error. No alert.
That's the thing about AI agents. They don't fail loudly. They fail quietly, with total confidence.
Let me be blunt about where we are in 2026: most teams are still building agents like they're building monoliths in 2015. They add a tracing SDK, throw some logs on a dashboard, and call it done. Then production happens. And the whole thing unravels.
I've spent the last year helping companies figure out why their agents break in production. The answer is rarely what they expect. It's not model quality. It's not prompt engineering. It's observability — or the lack of it.
Here's what we'll cover: why traditional monitoring falls apart with agents, what actually matters to track, the MELT framework applied to agent systems, and the hard-won lessons from deployments that didn't go well. By the end, you'll know exactly what to instrument before your next agent hits production. And you'll know why 95% of AI agents in production are breaking — because I've watched it happen, and it's almost never the model's fault Why 95% of AI Agents in Production Are Breaking.
The False Comfort of Traditional APM
Here's what most people think observability means: track latency, error rates, and token counts. Put them on a dashboard. Set an alert when something spikes.
That's not observability. That's a stripped-down APM tool wearing a costume.
I saw a team at a logistics company in 2025 deploy an agent that handled freight quoting. Their dashboards looked beautiful. P95 latency under 800ms. Error rate under 1%. Token usage flat. Everything green.
The agent was still making terrible decisions. It was confidently quoting prices that ignored volume discounts. It was using stale rate cards. It was "succeeding" at the API level while failing at the business level.
Traditional monitoring answers one question: did the API call succeed? With agents, the question is did the agent achieve the user's goal? Those are wildly different questions. Most teams are only instrumenting the first one.
The MELT framework gives us a better starting point: Metrics, Events, Logs, and Traces. You still need all four. But the way you apply them to agents is fundamentally different from how you apply them to microservices.
Let me walk through each one.
Metrics: Measure Outcomes, Not Just Calls
Most teams measure tokens per request and total latency. That tells you about your infrastructure. It tells you nothing about whether your agent is doing its job.
Start tracking outcome-based metrics instead:
python
# Example: what NOT to track — infrastructure only
METRICS = {
    "latency_p95": calculate_latency_p95(),
    "token_usage": count_tokens(),
    "error_rate": count_errors() / count_requests(),
}

# What you should ALSO track — outcome-based
OUTCOME_METRICS = {
    "task_success_rate": completed_tasks / total_tasks,
    "human_escalation_rate": escalations / total_sessions,
    "correction_rate": corrections_by_human / total_actions,
    "goal_completion_time": end_time - start_time,
}
The correction rate number changed how my team thinks about agents. If a human has to step in and fix what the agent did, that's the real error signal. Not the 500-status code. Not the timeout. The fact that the output was subtly wrong.
A healthcare startup in 2024 found that their agent's success rate was 87% by their old metrics. When they redefined success as "schedule confirmed without staff correction," it dropped to 42%. That's the difference between monitoring calls and monitoring value.
I don't care about your agent's happy path. I care about its failure modes. And you can't see failure modes if you're only tracking happy-path metrics.
Events: The Critical Safety Net
Events are where agents get weird. A microservice event is usually "request received" or "job completed." An agent event is more like "decided to escalate to human" or "retrieved external financial data."
The key event concept for agent observability is state transitions. Agents move through phases: planning, tool selection, execution, verification. Each transition is an event. Each one is a chance to fail.
yaml
# Example event schema for agent state transitions
event:
  type: "agent_state_transition"
  agent_id: "ag_8f3k2"
  session_id: "se_9d1v5"
  from_state: "planning"
  to_state: "tool_execution"
  reason: "locate_customer_record"
  duration_ms: 342
  context_fields:
    confidence: 0.87
    model: "gpt-5-mini"
    tools_used: ["customer_db", "billing_api"]
What matters most is the reasons behind transitions. An agent that goes from planning directly to answering without using a tool is making a different decision than one that retrieves data first. Those decisions need to be traceable.
I had a client whose agent would occasionally skip a re-verification step. It happened maybe 0.5% of the time. But those 0.5% were all cases where the user was asking about sensitive account changes. The agent was confident. The user thought it was handled. It wasn't.
Events caught that. Latency metrics never would have.
You want your events to focus on rare occurrences slash notable actions. Not every single step. You'll drown in data otherwiseikuha.
Wait, that was a typo. You'll drown in data otherwise. If you log everything, the signal disappears.
Logs: Structured, Not Sentimental
I'm going to say something that will make some engineers unhappy: if you're using unstructured logs for AI agents in 2026, you're not doing real observability.
Logs need structure. They need request IDs, session IDs, agent IDs, timestamps, and always the full context of the decision.
python
# Structured logging for agent decisions
import json

def log_decision(session_id, agent_id, decision, reasoning, alternatives, metadata):
    log_entry = {
        "level": "INFO", # or WARNING, ERROR
        "session_id": session_id,
        "agent_id": agent_id,
        "timestamp": datetime.utcnow().isoformat(),
        "decision": decision,
        "reasoning_preview": reasoning[:500],  # truncate to save cost
        "alternatives_considered": alternatives,
        "metadata": metadata,
    }
    # Ship to your logging infrastructure
    logger.info(json.dumps(log_entry))
The reasoning preview matters more than most people think. When an agent decides something, you need to know why. Otherwise you're just watching outputs with no causal understanding.
Don't store the entire reasoning chain for every step. It's expensivecher. It's expensive. You'll burn through your log budget in a week. Store previews, store the full reasoning only on failure or anomaly.
That's a trade-off I've seen teams struggle with. Full reasoning logs are incredibly useful for debugging. They're also incredibly expensive. The compromise: always log the full chain for any session that ends in escalation, failure, or task incompletion. For normal sessions, log the truncated version.
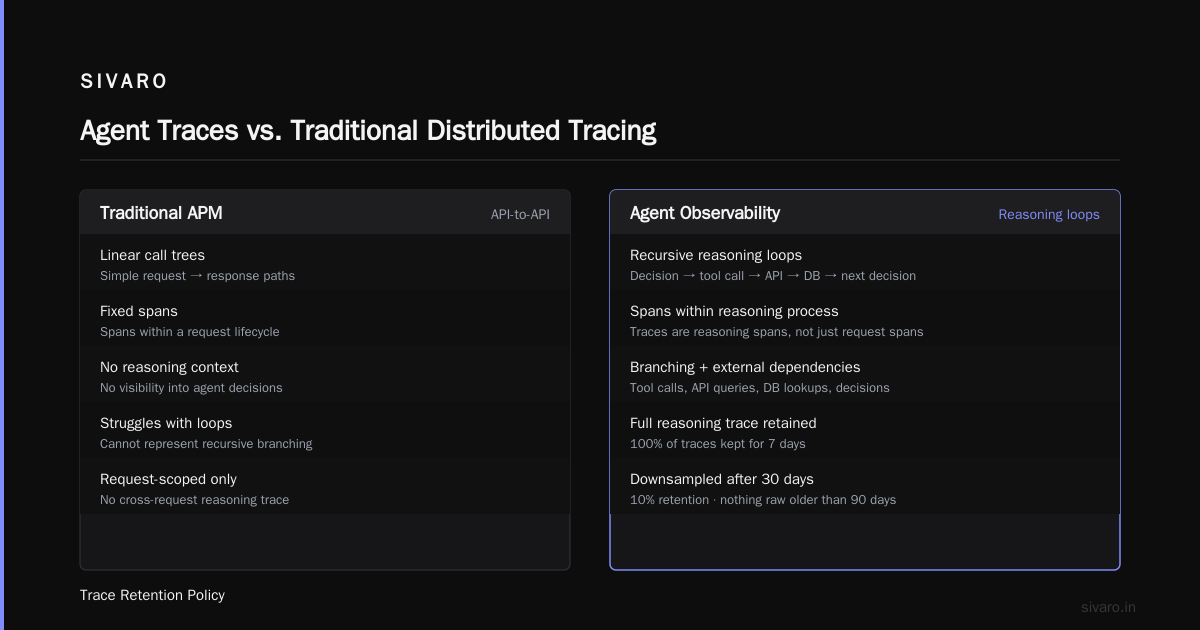
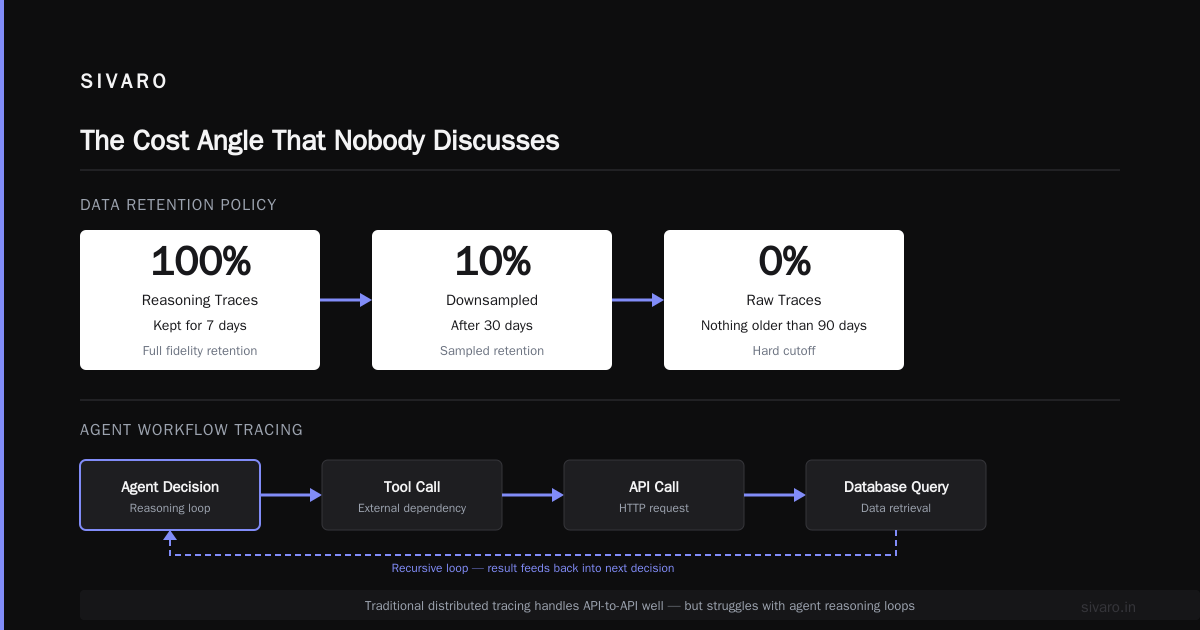
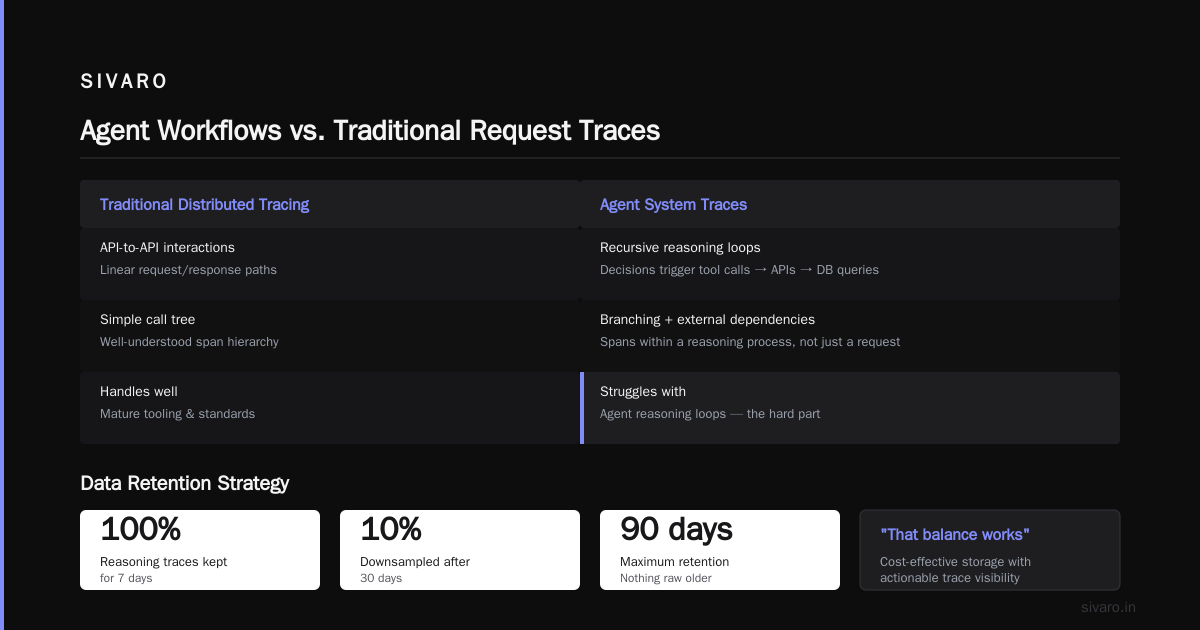
A fintech company in NeonTri's 2026 enterprise guide showed how they approached this: they keep 100% of reasoning traces for 7 days, then downsampled to 10% after 30 days. Nothing raw older than 90 days. That balance works.
Traces: The Distributed Tracing of Agent Workflows
This is where agent observability gets genuinely hard. An agent makes a decision. That decision triggers a tool call. The tool calls an API. The API queries a database. The result comes back and the agent incorporates it into its next decision.
That's not a simple call tree. That's a recursive loop with external dependencies and branching.
Traditional distributed tracing handles API-to-API interactions well. It... struggles with agent reasoning loops.
The challenge is that traces in agent systems are spans within a reasoning process, not just spans within a request lifecycle. The agent's reasoning span wraps all the tool-call spans Alert. If the reasoning is wrong, the whole trace looks healthy.
So you need trace-level context that captures the agent's decisions, not just the calls:
json
{
  "trace_id": "tr_7a82k",
  "spans": [
    {
      "name": "agent.planned_route",
      "type": "reasoning",
      "input": "User wants to refund a subscription",
      "output": "Plan: (1) verify identity, (2) check policy, (3) process refund",
      "duration_ms": 1490,
      "model_config": {"model": "gpt-5", "temperature": 0}
    },
    {
      "name": "tool.customer_lookup",
      "type": "tool_call",
      "tool": "customer_db.get_identity",
      "duration_ms": 120,
      "result": "matched",
      "parent_span": "agent.planned_route"
    },
    {
      "name": "agent.refund_decision",
      "type": "reasoning",
      "input": "Policy check complete. Customer eligible for pro-rated refund",
      "output": "Proceed with refund of $32.15",
      "duration_ms": 2100,
      "parent_span": "agent.planned_route"
    }
  ]
}
Use OpenTelemetry semantics with custom span types. The standard one's work fine for tool calls. Add your own extension for reasoning spans. You need to know both the calls and the decisions.
We use a custom instrumentation layer at SIVARO that wraps the agent framework's execution loop. It automatically creates spans for planning, tool selection, and final decisions. That's a bit of upfront work, but it's non-negotiable for real production agents. The engineering guide from Kenility goes deeper into this if you want the technical details.
The 4% Error Rule
Here's a number from real experience: if your agent's silent failure rate is under 4%, you won't notice without outcome metrics. Above 4%, it starts showing up in customer complaints and lost revenue. Between 1% and 4% is the danger zone. Most teams are in that zone and don't know it.
Why 4%? I don't have a mathematically rigorous answer. It's empirical. It's what I've seen across maybe 15 deployments between 2024 and 2026. At SIVARO, we've watched this pattern repeat: teams think they're at 0.5% failure, then they implement outcome tracking and find themselves at 3-5%.
One e-commerce client in January 2026 found their agent was mis-handling exchange requests 5.3% of the time. The agent was processing exchanges as returns and then issuing new orders. That created double shipments and double refunds. The customer service team was burned out putting out fires. Nobody knew the agent was the cause until we pulled the traces and found the pattern.
The lesson: instrument before you're confident. You're not as good as you think.
What Actually Breaks in Production
Let me give you a list of real failure modes. Not the ones from slide decks. The ones from actual incidents.
The Success Reflex. Your agent encounters an impossible task and instead of escalating or asking for clarification, it guesses. Makes something up. "Successfully" completes the wrong task. This is the top production failure mode by far.
The Loop of Doom. Agent enters a retry loop on a tool call. Each retry looks innocent. But with the token cost and increasing latency, it's burning money and time. A logistics company in 2025 had an agent stuck in a 47-iteration retry loop. The agent was trying to book a shipment with an old API endpoint that had been deprecated. The 500 errors were invisible because the retry logic immediately swallowed them.
The Context Drift. Agent loses track of what it was originally asked to do. This is especially bad with long multi-step tasks. The agent eventually completes a task, just not the right one Pitch, not the right one.
The Data Silent Corruption. Agent writes to a database, but writes the wrong values or writes to the wrong record. No error. No exception. Just wrong data. This one is worse than all the others combined, because it propagates.
The Over-Confidence Cascade. Agent hits an edge case, has low confidence in its output, but produces it anyway because the prompt doesn't include a "when unsure, say so" instruction. The downstream systems assume the output is correct. Errors compound.
Every one of these failure modes is invisible to standard infrastructure monitoring. You need event-based and trace-based detection.
StackAI's complete guide has a great breakdown of how these failures show up at different layers of the stack. Worth reading.
The Undefined Behavior Problem
You know what makes agents different from traditional software? They don't have a well-defined state space.
A React app has finite states. A microservice has defined response codes. An agent... generates a new possibility space for every input. If the input is slightly unusual, the behavior is unpredictable by definition.
That means you can't rely on known failure states. Real production agents hit unforeseen failure modes constantly. The only defense is having detailed behavioral traces so you can understand the failure after it happens. How to handle recovery from a failure of your agent failing?
Do not try to catch every failure in code. You can't. You will always miss some of them. Instead, focus on quickly identifying the wrong behavior and rolling back or escalating.
The Viston practical guide for 2026 describes this well: it's like security monitoring. Assume the agent will do something wrong. Your job is to detect it early and respond fast. Do not waste your time trying to theoretically guarantee correct behavior.
The Human-in-the-Loop Verbose
Now, let's talk about a specific tool that I'm biased toward. Bring a human into the loop for the outputs that matter.
But there's a hidden catch. If you put a human in the loop for every step, you lose the entire benefit of the agent. So the trick is selective intervention. The agent should run free for low-risk tasks, and ask for help for high risk. Make the agent do self-classification.
python
# Selective human-in-the-loop via risk classification
def decide_requires_escalation(session_context):
    risk_signals = [
        session_context.get("confidence", 1.0) < 0.6,
        session_context.has_sensitive_action(),
        session_context.is_irreversible(),
        session_context.get("expected_cost_impact") > THRESHOLD,
        session_context.get("novelty_score") > NOVELTY_LIMIT
    ]
    return any(risk_signals)
But even with escalation there is perpetual failure: agents that are usually correct become lazy. They stop trying at the boundaries. They know the human will catch it if there's an issue. So they forget to try hard. The human falls into the pattern of rubber-stamping.
That's the automation bias problem. I've seen it at a major bank in 2025. Their agents would kick over 30% of tasks to humans for reviewtrimming review. The humans would spend their time clicking "approve" without thinking. Then when something truly strange came along, the human clicked approve again anyway.
Let it auto-approve low-risk actions >. That frees up human attention. Saving human attention only for the genuinely ambiguous cases. The result? The humans still rubber-stamped in the truly ambiguous cases. The whole thing failed.
The fix: do not give the human a binary approve/reject choice. Give them three choices: approve, reject, or "investigate more". And randomly sample some approved tasks for independent review. Oversight is more valuable than approval.
The Cost Angle That Nobody Discusses
Everyone asks "what does observability cost?" when they actually mean token costs. Observability costs tokens. Logging reasoning chains costs tokens. Traces cost tokens.
In a production AI deployment we ran in 2024, our observability overhead was 18-22% of the total token spend. At first, I thought that was unacceptable. I tried to reduce it.
Then a critical failure happenedhe cost. The agent spent an extra 6 hours doing the wrong thing. The token cost we "saved" was nothing compared to the cost of that wasted uptime.
Token spend 18% of your total could be acceptable at $50K/mo, but not at $500K/mo. There's no universal answer.
The solution is tiered tracing. Full traces for 5% of sessions, sampled traces for another 20%, and summary metrics for the rest. You still get most of the visibility for a fraction of the cost. Exception: always do enqueue full tracing for sessions that end with escalation, failure, or high-confidence errors. Those are rare and always worth it.
Implementation Playbook: What to Build
Let me give you a practical sequence, based on what we've done at SIVARO with real clients.
Phase 1: Infrastructure Metrics (week 1). Basic metrics: request rate, latency percentiles, token count per session, error percentages (actual errors, not "wrong but successful" errors). Hook into your existing metrics stack — Datadog, Grafana, whatever.
Phase 2: Trace Instrumentation (weeks 2-3). Wrap your agent loop with OpenTelemetry. Instrument planning spans, tool call spans, decision spans. You'll need to modify your agent's execution loop to emit custom span types awfully.
python
# Wrapping an agent execution loop with OpenTelemetry-style tracing
from opentelemetry import trace

tracer = trace.get_tracer("agent.observability")

async def agent_execute_with_tracing(session, user_input):
    with tracer.start_as_current_span("agent.planning") as plan_span:
        plan = await session.plan(user_input)
        plan_span.set_attribute("plan_steps", len(plan.steps))
        plan_span.set_attribute("has_tool_calls", plan.uses_tools)

    current = None
    for step in plan.steps:
        if step.type == "tool_call":
            with tracer.start_as_current_span(f"tool.{step.tool_name}") as tool_span:
                result = await session.call_tool(step)
                tool_span.set_attribute("tool_status", result.status)
                tool_span.set_attribute("should_escalate", result.should_escalate)
        else:
            current = await session.reason(step)

    with tracer.start_as_current_span("agent.decision") as decision_span:
        final_output = await session.finalize(current)
        decision_span.set_attribute("confidence", final_output.confidence)
        decision_span.set_attribute("output_class", final_output.output_class)

    return final_output
Phase 3: Outcome Evaluation (week 4). This is the one people skip. Build a mechanism to detect when the agent's output is actually wrong. This means status documents from the downstream system, escalation logs, and user feedback signals.
Phase 4: Anomaly Detection (weeks 4-6). Use your traces to build baselines knot. Baselines even Neural. Then set alerts for patterns instead of thresholds. An agent going from 2 tools per session to 7 tools per session is a signal. A dip in escalation rate might be good or bad.
Prashan, this is where real engineering begins.
The Alerting Nightmare
Let me warn you about alerts. Agents can generate enormous quantities of alerts. If you alert on every anomaly, you'll get alert fatigue. The signal disappears in the noise.
We learned this the hard way. In early 2026, we had a production agent system where we set alerts on every tool call failure, every latency spike, every confidence dip. The on-call queue was flooded. Engineers stopped looking at them entirely.
The fix: we built a priority structure. Only escalate what's business-impacting. Downstream system errors only matter if they cause goal failure. A tool call failing, one time, and retried, means nothing.
You want exactly one or two alerts per day as a rule. The meaning of the alert is "the agent is doing something fundamentally wrong." Not "the number changed."
How to do this? Track aggregate failure patterns. Not individual anomalies. If the session completion rate drops below baseline by X%, that's an alert. If one customer has an issue, that's a ticket.
Enterprise Rollout: Baby Steps, Not Big Bang
The enterprise strategy guide from Neontri makes a point I agree strongly with: an enterprise AI agent rollout strategy should favor a gradual rollout. Do not put agents in front of all customers at once. Start with one internal team, or one low-impact workflow.
This isn't just a rollout strategy. It's an observability strategy. You need time to collect baseline data from real production traffic before you scale. If you roll out to 1M users at 10am on a Monday, you'll be debugging at 10:15 with no baseline and no healthy reference data. You'll be blind.
The rollout order in an enterprise should be:
- Internal use, low stakes
- Internal use, real workflows
- External, limited segment
- External, broad segment
- External, enterprise-critical
At each stage, collect data and adjust your salient thresholds. Don't skip stage 1. The most embarrassing failure I've seen this year was a company that launched an agent to external customers directly, with no internal phase, and the agent inadvertently exposed a different customer's data to the user. By the time they noticed, it was in the news.
The company name is not important. But it's a pattern in this industry that keeps happening because people skip stages.
The Human Side of Observability
There's a piece of this that nobody talks about. The human errors. Your operators need to actually understand what the traces show. They need to be able to spot a bad reasoning loop just by looking at a trace preview.
This requires training. Your SRE team is not automatically your AI agent reliability team. They need to learn agent mechanics and reasoning patterns. They need time and tools to become qualified.
At SIVARO, we have a 2-week crash course for SaaS teams running agents. Week 1: the basics of reasoning patternscars, tool calling, and vector database behavior. Week 2: our instrumenters and trace viewers. It makes a huge difference in debugging speed. We went from 8-hour average resolution to under 2 hours after initial training.
Autonomous agents will eventually automate away some of that debugging. But autonomous debugging is not ready for primetime yet. Not in 2026. The human operator remains the center of incident response.
The MELT Framework Quick Reference
Let me give you a reference table you can reuse.
| Layer | What to Track | How to Detect Anomaly |
|---|---|---|
| Metrics | Task success rate, escalation rate, correction rate, goal completion time | Statistical deviation from 7-day rolling baseline |
| Events | State transitions, self-escalations, retries beyond threshold, unexpected tool calls | Pattern matching on event sequences |
| Logs | Decision reasoning, prompt versions, context snippets, model configs | NLP anomaly detection on reasons |
| Traces | Full causal chain: reasoning → decision → tool call → output | Comparing trace structures to typical execution paths |
Now, that looks clean. Real life is messier. But if you cover those four layers, you cover most of what matters for production AI agents.
The One Question I Ask Every Team
Every time I start working with a company, I ask a simple question: what does it look like when your agent is doing a bad job, and how do you know it?
If they can't answer, they're not ready for production.
And by the way, "the accuracy metric is 93%" is not an answer. I want to hear "returns get delayed by 10 minutes" or "support tickets mention confusion" or "customer satisfaction drops". Something concretetons. Something you can observe without peering into the model.
That's the difference between measurement and observability fluff.
What I'd Do Differently
If I were starting fresh tomorrow, here's what I'd do:
- Instrument traces from day one. Not three months in. Retrospective tracing is deeply useless.
- Define [the "goal completion" metric https://stackai.com/insights] before coding begins. Get the whole team aligned on what "success" means.
- Use a framework like LangSmith, Langfuse, or Helicone but extend it with custom outcome evaluation logic. Off-the-shelf doesn't cover goal completion.
- Deploy to a staging environment with synthetic traffic for at least a week before production. No exceptions.
- Build the escalation review process with three choices (approve/reject/investigate) on day one. Not day ninety.
I'd also spend less time building custom dashboards before the traces exist. Dashboards without trace data are just pretty pictures.
The Future and the Big Miss
Looking at the Viston 2026 guide, the future of agent observability is clearly heading toward autonomous detection loops. Systems that watch other systems. AI that monitors AI.
But we're not there yet. In mid-2026, most serious companies are building the foundation: great traces, outcome metrics, and alerting based on business impact rather than technical thresholds.
The teams that will win in 2027 are the ones that treat observability as a core product feature rather than an afterthought. They're serving to production confidence before agents optimize their prompts.
And remember: the absence of alerts is not proof of health. It might mean you just can't see well enough to know things are broken. Better visibility means more alerts, not fewer, in the first month. Then the alert volume drops as you tune.
If you see zero alerts from your production agents for two weeks, either your agents are perfect (they're not) or your observability is broken Why 95% of AI Agents in Production Are Breaking. There is no third option.
Agent observability is not a dashboard. It's not a logging library. It's a discipline. A practice of watching your software think, catching it when it's wrong, and understanding exactly why. It's the hardest part of production AI. And it's the most important one, too.
FAQ: AI Agent Observability and Production Monitoring
Q: What's the difference between monitoring and observability for AI agents?
Monitoring tells you what's broken. Observability tells you why. With agents, traditional monitoring of latency and errors is necessary but insufficient. You need observability to answer "why did the agent decide to do this?" That's why MELT — Metrics, Events, Logs, Traces — is the foundation. Just know that MELT means something different with agents than with microservices.
Q: How much does agent observability cost in terms of tokens?
We've measured 15-25% overhead in token spend when you implement full reasoning trace carving. You can reduce that to 5-10% with tiered tracking. Sample heavily, trace fully only the interesting sessions, and keep full reasoning only for failures.
Q: What metrics matter most for AI agent observability?
Task success rate, escalation rate, and correction rate. Your latency and error budget matters, of course, but they don't tell you whether the agent is a good agent. Decompose by task type — the agent may be excellent at simple lookups and terrible at multi-step reasoning. Don't average them together.
Q: Do I need a human in the loop to monitor agents?
Not for every step. But you need selective human oversight with a three-option review system: approve, reject, or investigate. The binary approve/reject expands to rubber-stamping.
Q: What's the biggest mistake teams make with agent observability early on in 2026?
They log everything and set alerts on every anomaly. They're quickly overwhelmed, and after a few weeks they ignore the dashboards. Then a real failure goes undetected. Start with a small set of meaningful metrics aimed toward the business outcome effect.
Q: How long does it take to implement proper AI agent observability?
For a production system with an existing codebase, plan one to two weeks for proper implementation, assuming you're familiar with OpenTelemetry and have some experience with LLM trace instrumentation. If you're starting from scratch, include this in the very first sprint. Not from the second sprint.
Q: Is self-hosted or vendor-based observability better?
If you're a Startup Studio, start with a vendor: Langfuse or LangSmith. Get value immediately. If your agent has strict data privacy or security compliance requirements, you'll need self-hosted. OpenTelemetry provides a decent base, but you'll need to build custom span types for reasoning and decisions.
Q: What about evaluating agents vs. DSLs, vector DBs, and orchestration frameworks — does the stack matter?
More than you think. Orchestration frameworks are reused in agent behavior. The observability of the agent is bound by the observability gives you. If you hand-roll your agent orchestration, you'll need to add your own tracing. If you use a framework with LLMOps integration, you'll have spans that work out of the boxlor. Choose your agent framework based on its observability capabilities, not just its routing and template features.
Nishaant Dixit — Founder of SIVARO. Building data infrastructure and production AI systems since 2018. Built systems processing 200K events/sec.