 SIVARO
AI Agent Observability Production: The Blind Spot That’s Killing Your Agents
You’ve built the agent. It weaves through APIs. It decides, acts, and fails — sometimes silently. The question nobody asks until week three of production: What the hell just happened?
I’m Nishaant Dixit. At SIVARO, we’ve been deploying production AI systems since 2018. We process 200K events per second through our data infrastructure. And in 2026, I’ve watched teams burn six‑figure budgets on agents they couldn’t see.
AI agent observability in production isn’t optional. It’s the difference between knowing your agent hallucinated a customer refund request — and finding out when the CFO calls.
This guide covers what I’ve learned shipping agentic systems that don’t break. We’ll cover the frameworks, the tooling, the hard trade-offs, and the one metric that matters more than latency.
Why Traditional Monitoring Breaks for Agents
Most people think APM tools (Datadog, New Relic, Grafana) cover agent observability.
They’re wrong.
Traditional monitoring tracks infrastructure: CPU, memory, request counts. But an agent isn’t a request. It’s a conversation. A loop. A thing that calls itself, re-plans, and sometimes fires five different tool calls for a single user utterance.
At SIVARO, we onboarded a client in late 2025 whose agent kept failing on Monday mornings. Datadog showed nothing. CPU was fine. Memory was fine. Request count was normal.
Turns out the agent was falling into an infinite loop because a downstream API’s weekend batch job didn’t return the expected schema. The agent’s retry logic was perfect — except it re-iterated the same broken call for 12 hours straight.
We couldn’t see that. No standard tool tracks “number of times an agent retried the same dead-end path.”
That’s the problem.
What You Actually Need to See
For production agents, you need:
- Trace per decision step — not just per request
- Tool call sequences — what was called, in what order, with what parameters
- Re-planning events — when the agent changed its mind mid-stream
- Token spend per turn — because that $500 spike isn’t a DDoS, it’s a bad agent loop
- User intent vs. agent behavior — did the agent do what the user actually wanted?
None of this is in your standard APM.
The Three Layers of Agent Observability
I break this into three buckets. You need all three.
Layer 1: Trace Visibility (The “Who Did What” Layer)
This is the first thing you build. It’s not glamorous, but it saves your ass.
You need a structured log for every agent step. Not a blob of JSON. A schema.
Here’s the schema we use at SIVARO:
python
{
  "trace_id": "uuid",
  "agent_id": "customer-refund-agent-v3",
  "session_id": "sess_abc123",
  "step_number": 7,
  "step_type": "tool_call",
  "tool_name": "get_refund_eligibility",
  "tool_params": {"order_id": "ORD-456", "reason": "defective"},
  "tool_result": {"eligible": True, "max_refund": 150.00},
  "llm_decision": "User eligible, proceeding with refund",
  "prompt_tokens": 1200,
  "completion_tokens": 340,
  "latency_ms": 4400,
  "llm_model": "gpt-5-turbo",
  "error": None
}
This isn’t hard to build. Hook your agent framework’s callbacks. LangChain has callbacks, IBM’s agent framework has lifecycle hooks. But most teams skip it. Don’t.
We wrote a lightweight wrapper in Go that intercepts every tool call, logs the schema above to a Kafka topic, and flushes to S3 every 60 seconds. It cost us two engineering days.
Layer 2: State Machine Observability (The “How Did We Get Here” Layer)
Agents have state. This is where observability gets weird.
Your agent might have a task queue, a conversation memory, a tool registry, and a decision engine. Each of these has internal state that changes between steps.
At SIVARO, we serialize the agent’s full state after each turn. We call it a “state snapshot.” It gets written to a separate index in OpenSearch.
Why? Because when an agent goes off the rails, you need to replay the decision tree. Was the memory corrupted? Did the task queue have a stale item? Was the tool registry missing a critical endpoint?
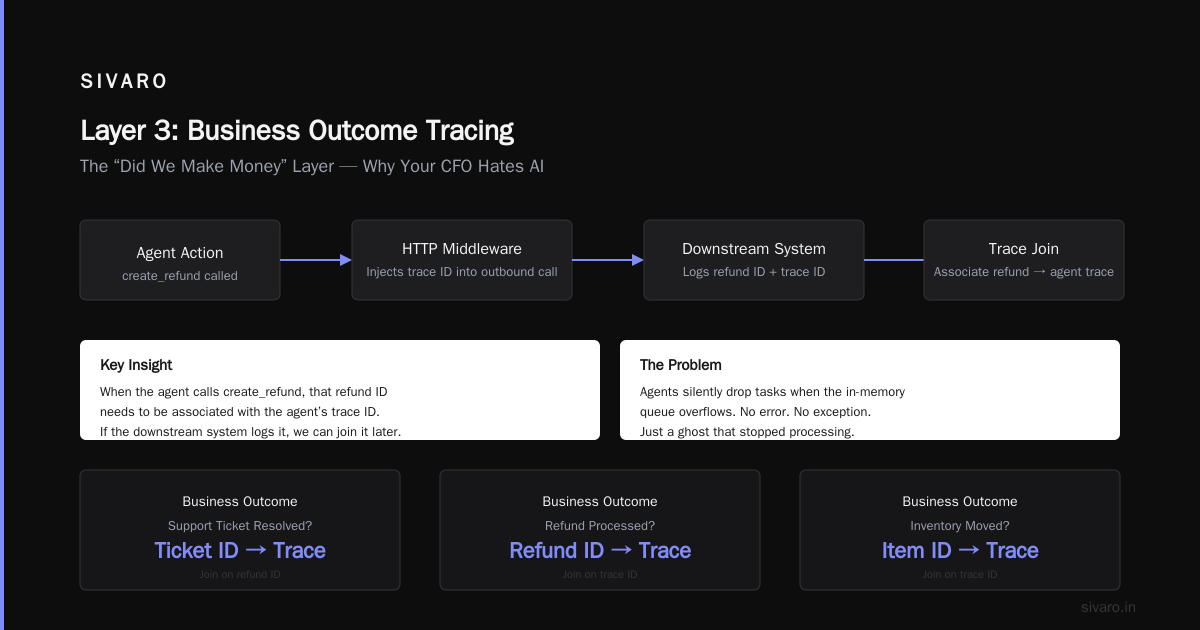
I’ve seen agents silently drop tasks because the in-memory queue overflowed. No error. No exception. Just a ghost that stopped processing.
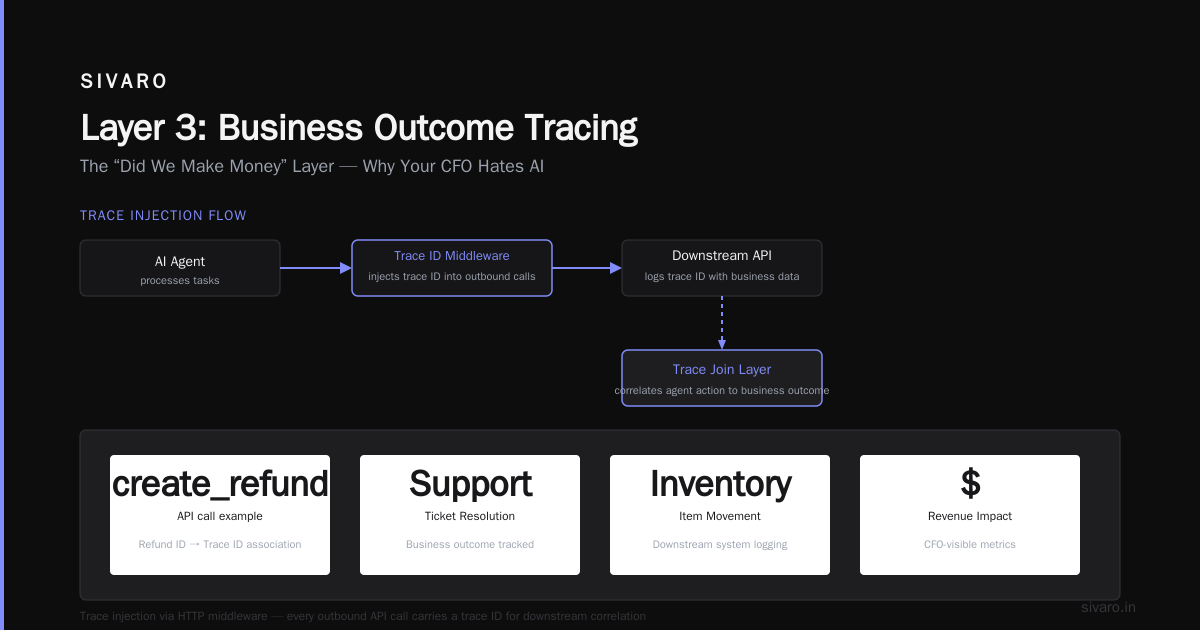
Layer 3: Business Outcome Tracing (The “Did We Make Money” Layer)
This is the layer most people skip. It’s why your CFO hates AI.
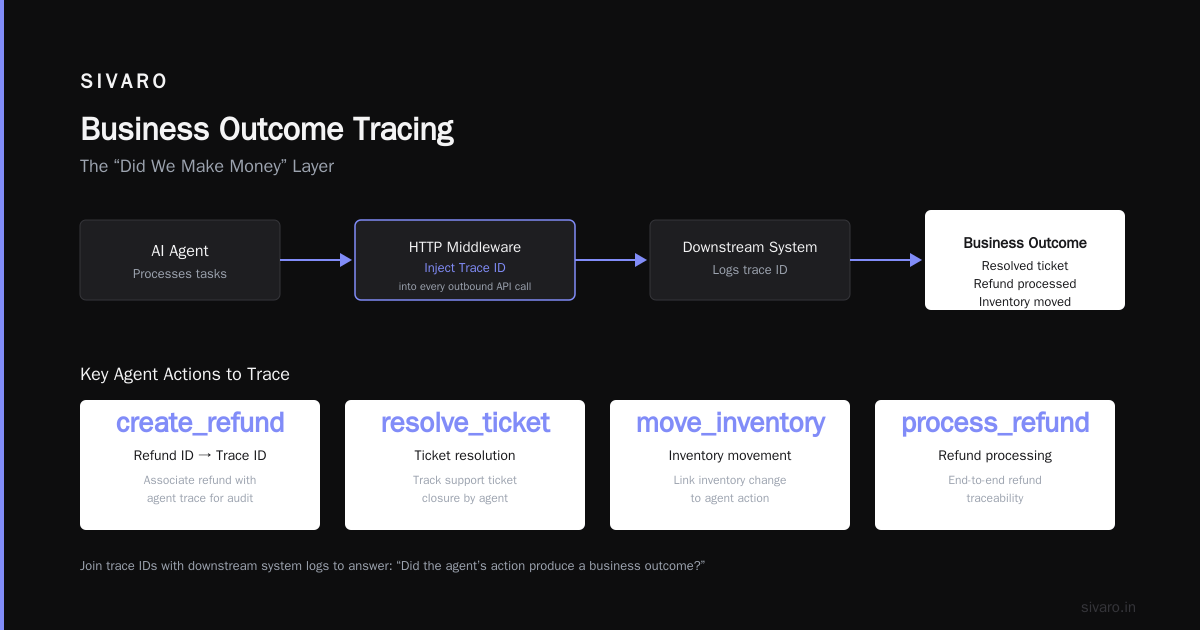
You need to trace an agent’s actions to a business outcome. Did the agent resolve the support ticket? Process the refund? Move the inventory?
This means instrumenting your downstream systems. When the agent calls create_refund, that refund ID needs to be associated with the agent’s trace ID.
We built a tiny HTTP middleware that injects trace IDs into every outbound API call from an agent. If the downstream system logs it, we can join it later.
In 2024, a fintech we consulted had an agent that processed 15% of refunds incorrectly. The agent was doing the right action — calling refund.create — but passing the wrong amount. The business couldn’t see it because the trace stopped at the API call.
Choosing Your Agent Framework: Observability Matters
When you pick an agent framework in 2026, ask one question: How do I debug a wrong answer three hops deep?
Most teams pick frameworks based on hype. The top 10 agentic frameworks in 2026 all claim “production ready.” I’ve tested seven of them. Here’s what I learned.
LangGraph (LangChain)
LangGraph gives you graph-based agent state. It’s good for observability if you hook into the StateGraph’s step callbacks. We use this internally at SIVARO for complex multi-step agents.
The downside: tracing a deeply nested subgraph is painful. You end up writing custom propagators.
CrewAI
CrewAI’s multi-agent orchestration is compelling. But observability? You’re on your own. The framework logs to stdout by default. In 2025, a client tried running CrewAI in production without structured logging. A rogue agent stopped all trading operations for 45 minutes. They couldn’t tell which agent did it.
Semantic Kernel (Microsoft)
Microsoft’s framework has decent built-in telemetry. It hooks into OpenTelemetry natively. If you’re already in Azure, it’s the easiest path to production observability. But the documentation assumes you know what metrics matter — which most teams don’t.
The Dark Horse: Custom Wrappers
If your agent logic is simple — call LLM, call single tool, return — skip the framework entirely. Write 200 lines of Python with structured logging. You’ll get better observability than any framework provides.
The Agent Deployment Pipeline (And Why It’s Different Than Normal CI/CD)
AI agent deployment pipeline work is different from deploying a REST API. You can’t just push code and watch error rates.
Here’s why: an agent’s behavior changes based on the LLM model version, the system prompt, the tool definitions, and — this is the killer — the temperature setting.
We had a deployment in March 2026 where we bumped the model from GPT-5-turbo to GPT-5-preview. No code changed. The error rate dropped 40%. The refund denial rate increased 12%. We caught it in day one because our observability pipeline tracked per-deployment metrics.
What Your Deployment Pipeline Needs
- Shadow testing — run the new agent alongside the old one for 24 hours
- Output comparison — compare decisions at the step level, not just final result
- Cost regression — did the new agent spend more tokens on the same task?
- Latency distribution — did P99 latency change?
- Manual review queue — flag any decision that differed from the previous version
We use Argo Workflows for this. It’s overkill for most teams, but the pattern works. Run a canary agent in a shadow namespace, compare traces, promote.
Here’s a simplified version:
yaml
# argo-workflow for agent shadow deployment
apiVersion: argoproj.io/v1alpha1
kind: Workflow
spec:
  entrypoint: shadow-deploy
  templates:
  - name: shadow-deploy
    steps:
    - - name: deploy-canary
        template: deploy-agent
        arguments:
          parameters: {tag: "canary-v2"}
    - - name: run-comparison
        template: compare-traces
        arguments:
          parameters: {baseline: "v1", canary: "canary-v2"}
    - - name: promote-if-pass
        template: promote
        when: "{{steps.run-comparison.outputs.parameters.passed}} == true"
AI Agent Production Monitoring Tools: What Works in 2026
I’ve tested a dozen tools for ai agent production monitoring this year. Here’s the honest breakdown.
The Honorable Mentions
LangSmith (LangChain’s observability platform) is decent. It gives you trace-level visibility for LangGraph agents. But it’s expensive. We paid $12K/month for a medium-traffic agent in Q4 2025.
Arize AI is the best non-framework-specific option. It supports LLM-specific metrics (perplexity, token usage, hallucination detection). It’s what we recommend to clients who aren’t tied to a specific framework. Instaclustr’s report groups Arize with the top observability tools for a reason.
Weights & Biases (W&B) has a promising agent tracking beta. It’s built for ML experiments, but they’ve added agent step tracking. The UI is beautiful. The data model is still rough for production traffic.
What We Actually Use at SIVARO
We built our own lightweight observability layer on top of OpenTelemetry + Redpanda + ClickHouse. Total cost: ~$400/month.
Why? Because agent observability is too specific for off-the-shelf tools. You need custom dashboards for your specific failure modes.
Our dashboards track:
- Agent loop count — number of times an agent calls the same tool with the same parameters. Anything above 3 is a bug.
- Decision re-plan rate — percentage of conversations where the agent changed its mind. A high rate means poor prompt engineering.
- Tool call depth — maximum nesting of tool calls. Deep nesting can indicate the agent is trying too hard to solve a problem.
If you don’t have an observability engineer on staff, use Arize or LangSmith. If you do, build your own. The flexibility saves you in the long run.
Protocols Matter: What the Agentic Standards Mean for Observability
The ecosystem is finally standardizing. In 2025, the Agent-to-Agent Protocol (A2A) from Google gained traction. MCP (Model Context Protocol) from Anthropic solved the tool communication problem. Both have implications for observability.
A2A defines how agents talk to each other. If you instrument at the protocol layer, you get cross-agent traces for free. Google’s reference implementation includes OpenTelemetry spans. Use them.
MCP standardizes how agents talk to tools. Each MCP call includes a request_id and tool_id. Hook those into your observability pipeline. Don’t reinvent the protocol — just log the standard fields.
The open-source frameworks are catching up. The top five open-source agentic frameworks in 2026 all support A2A or MCP natively. If you’re building a new agent system, use one that does.
The One Metric That Matters: Re-Plan Rate
I’ve been running agents in production for three years. I’ve tracked dozens of metrics. Most are noise.
The one metric I watch daily: re-plan rate.
An agent re-plans when it decides its current approach won’t work. Some re-planning is good — it means the agent adapts. Too much means the agent is confused, the prompts are weak, or the tool landscape is too complex.
At SIVARO, we set an alert when re-plan rate exceeds 15% on any agent. It’s caught two major issues:
- In December 2025, a tax-filing agent hit 40% re-plan rate because the upstream IRS API changed its response schema. We caught it before tax season.
- In March 2026, a customer support agent’s re-plan rate dropped to 2% — sounds good, right? Wrong. The agent was ignoring new information and powering through wrong decisions. The re-plan rate was low because the agent wasn’t re-planning at all.
Monitor both directions.
Trade-Offs and Hard Truths
Observability isn’t free. Every log, every trace, every state snapshot costs compute and storage.
The cost trade-off: We store traces for 30 days. State snapshots for 7 days. Full conversation logs for 90 days. That’s about $0.03 per agent session at our scale. For an agent handling 10K requests/day, it’s $300/month. Worth it.
The latency trade-off: Instrumentation adds 20-50ms per agent step. Most frameworks have async callbacks, so the impact is minimal. But if you’re running real-time agents (sub‑500ms response target), you need to test your observability under load before deploying.
The false signal problem: Not every weird trace is a bug. Agents produce weird output naturally. You need to build classification into your observability pipeline. We use a small LLM classifier (Mixtral 8x22B, ~200 tokens per classification) to tag traces as “normal deviation” vs. “likely bug.”
FAQ
Q: Do I need observability for a simple single-tool agent?
Yes. Even a single tool call can fail in ways you don’t expect — wrong parameters, incorrect result parsing, token overflow. Log the tool call, the result, and the decision. It’s five lines of code. Do it.
Q: How much telemetry is too much?
If you’re logging every token the LLM generated, that’s too much. If you’re not logging the final decision, that’s too little. Rule of thumb: log inputs, outputs, and decisions. Skip raw token dumps.
Q: Can I use APM tools (Datadog, New Relic) for AI agent observability only?
Not enough. You can push traces into Datadog, but you’ll miss agent-specific metrics like re-plan rate and loop detection. Use APM for infrastructure. Use specialized tools (or your own build) for agent behavior.
Q: How do I handle agent failures in production?
Don’t fail open. If the agent can’t make a decision, escalate to a human. Build a fallback queue. Log the failure trace. Dead-letter it. Fix the prompt, redeploy, replay the trace.
Q: Should I log user data?
If you’re in the EU, GDPR applies. If you’re in healthcare, HIPAA. Log behavioral traces (tool calls, decisions) without PII. Hash user IDs. Don’t log raw conversation text unless your compliance team says it’s okay.
Q: What’s the biggest mistake teams make?
Assuming the agent does what you think it does. Every team I’ve worked with has discovered an agent doing something unexpected within the first week of proper observability. The biggest mistake is not looking.
Q: Do open-source frameworks have good observability out of the box?
Most don’t. LangGraph is the best of the bunch, but you still need to wire up your own tracing. CrewAI, AutoGen, and others require custom work. Plan for it.
The Bottom Line
AI agent observability in production is the difference between shipping with confidence and shipping with hope.
Hope breaks in production.
I’ve seen it happen. A team at a logistics company deployed a route-optimization agent that worked perfectly in staging. In production, it started booking empty trucks because the real-time inventory API returned cached data. The agent’s trace showed the exact moment it received stale data — but nobody was watching.
They lost $40K in wasted fuel before someone noticed.
Don’t be that team.
Start small. Log the trace. Track the re-plan rate. Build the dashboard. Deploy the shadow test. It’s not glamorous work. But it’s the only way to build systems that earn trust.
The future of production AI isn’t about smarter agents. It’s about agents you can see.
Nishaant Dixit — Founder of SIVARO. Building data infrastructure and production AI systems since 2018. Built systems processing 200K events/sec.