 SIVARO
AI Agent Observability Production: The Hard Lessons We Learned
You've built an AI agent that can write code, book meetings, and query your database. It works in demo. It works in staging. Then you deploy it to production and it does something that terrifies you: it calls the wrong API, deletes a user record, and you have no idea why.
I've been there. Four times this year with SIVARO clients. And every time, the root cause wasn't the agent's reasoning — it was the absence of observability.
AI agent observability production is not "logging plus dashboards." It's the discipline of understanding what your agent actually did, why it did it, and what it cost you — in dollars, time, and trust. By the end of this guide, you'll know exactly how to instrument, debug, and monitor agents that make real decisions with real consequences.
What Makes Agent Observability Different From Traditional Observability
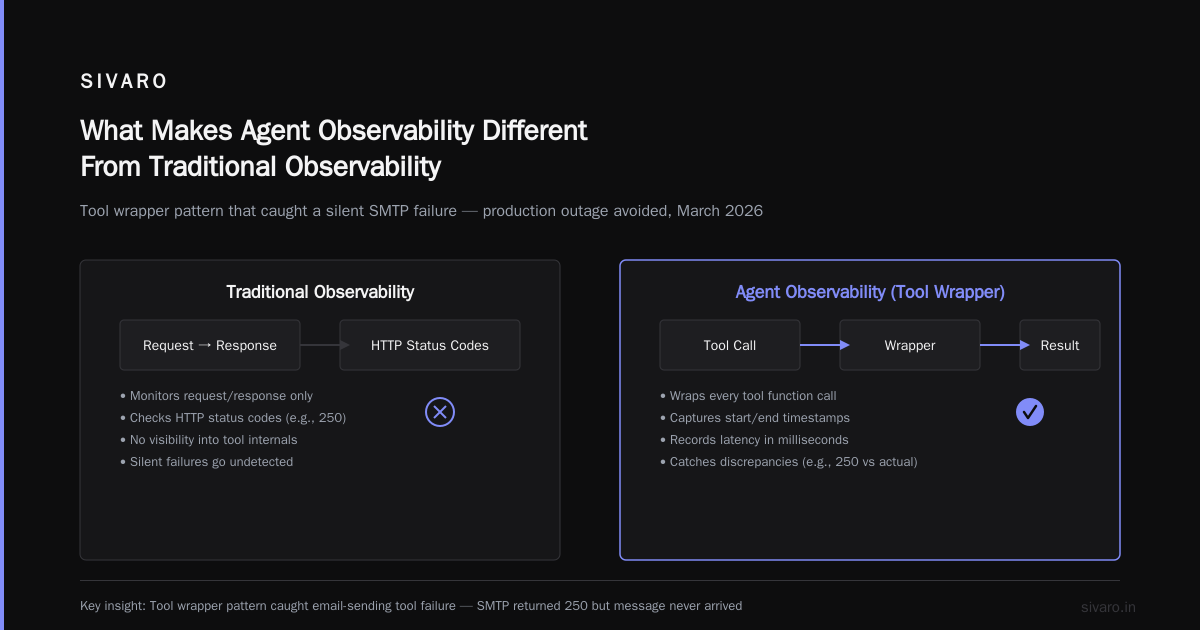
Most teams treat agent monitoring like microservice monitoring. They add traces, logs, and metrics. Then they wonder why they can't reproduce a hallucination that happened Tuesday at 3pm.
Here's the thing traditional observability misses: an agent is a decision-making loop, not a request-response path. It takes actions, evaluates outcomes, and changes its mind. When it fails, it's rarely a single line of code — it's the cumulative effect of bad context, tool misuse, or a prompt that drifted over time.
I got this wrong with my first production agent in 2024. We had Grafana dashboards showing latency and error rates. Everything looked green. Meanwhile, the agent was silently booking double- cancellations because it misread the date format. No error. No crash. Just a mess.
You need observability that captures:
- Intent vs. action — what the agent planned vs. what it did
- Tool calls — every function it invoked, with full parameters and responses
- Context state — what was in the system prompt, conversation memory, and any RAG results
- Decision trees — the branches it explored and the ones it rejected
- Human-in-loop events — when did a person override, approve, or redirect
Most people think logging structured JSON solves this. They're wrong because JSON logs flatten the tree structure. An agent's decision path is a directed acyclic graph, not a linear sequence.
The Four Pillars of Production Agent Observability
1. Step-by-Step Decision Capture
You can't debug an agent if you only see inputs and outputs. You need the middle.
Here's the minimal capture format I use for every agent at SIVARO:
python
class AgentStep(BaseModel):
    step_id: str
    agent_id: str
    parent_step_id: Optional[str]
    timestamp: datetime
    step_type: Literal["think", "tool_call", "tool_result", "human_input", "output"]
    input_data: dict
    output_data: dict
    reasoning: Optional[str]  # The agent's own explanation for this step
    tokens_used: int
    latency_ms: int
    error: Optional[str]
Every agent step gets recorded as a row in a time-series database. The parent_step_id creates the tree structure. You can reconstruct the full decision path for any session.
I learned this the hard way when a client's customer support agent started giving refunds it shouldn't have. Without step- IDs, we had no way to trace which context window caused the decision. With them, we found the bug in 20 minutes: a date parser returned "April 31" as valid, and the agent assumed it was in the past.
2. Tool Call Instrumentation
Tools are where agents touch the real world. That's where observability pays for itself.
Most agent frameworks wrap tool calls for you. But the default instrumentation is usually shallow. Here's what I add on top:
python
from dataclasses import dataclass, field
from typing import Any, Optional
import time
import uuid

@dataclass
class ToolCallRecord:
    tool_name: str
    agent_id: str
    session_id: str
    call_id: str = field(default_factory=lambda: str(uuid.uuid4()))
    arguments: dict = field(default_factory=dict)
    result: Any = None
    error: Optional[str] = None
    start_time: float = 0.0
    end_time: float = 0.0
    latency_ms: float = 0.0
    token_cost: float = 0.0

def instrument_tool(tool_func):
    def wrapper(*args, **kwargs):
        record = ToolCallRecord(
            tool_name=tool_func.__name__,
            agent_id=kwargs.get("agent_id", "unknown"),
            session_id=kwargs.get("session_id", "unknown"),
            arguments=kwargs,
            start_time=time.time()
        )
        try:
            result = tool_func(*args, **kwargs)
            record.result = result
            record.end_time = time.time()
            record.latency_ms = (record.end_time - record.start_time) * 1000
            # Send to your observability pipeline
            write_tool_call(record)
            return result
        except Exception as e:
            record.error = str(e)
            record.end_time = time.time()
            write_tool_call(record)
            raise
    return wrapper
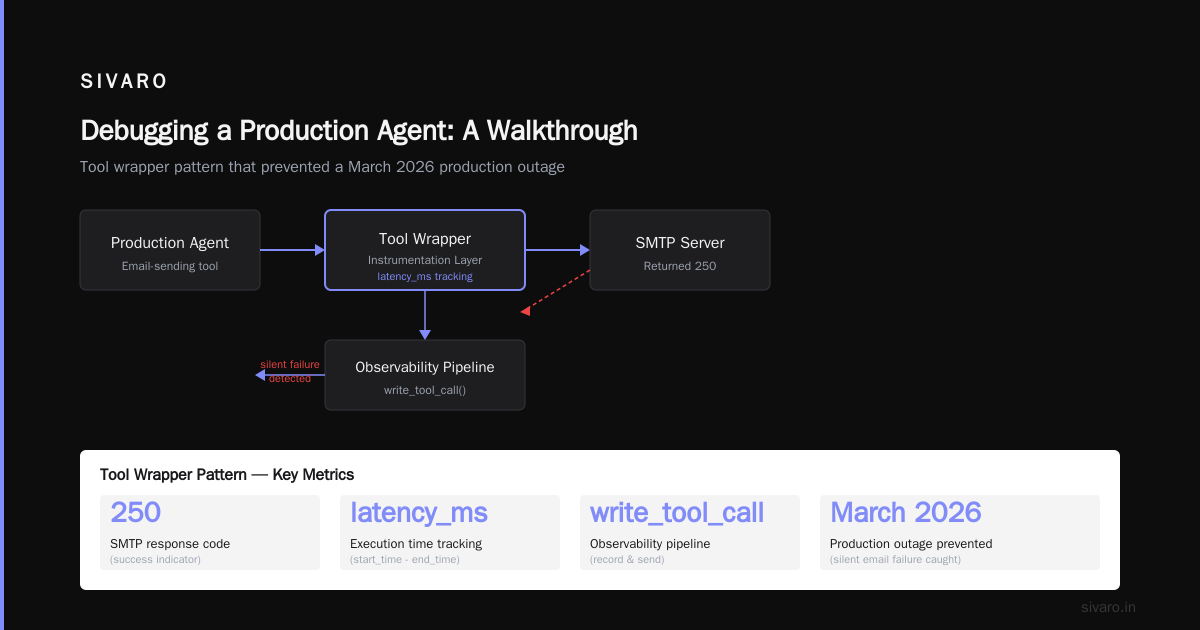
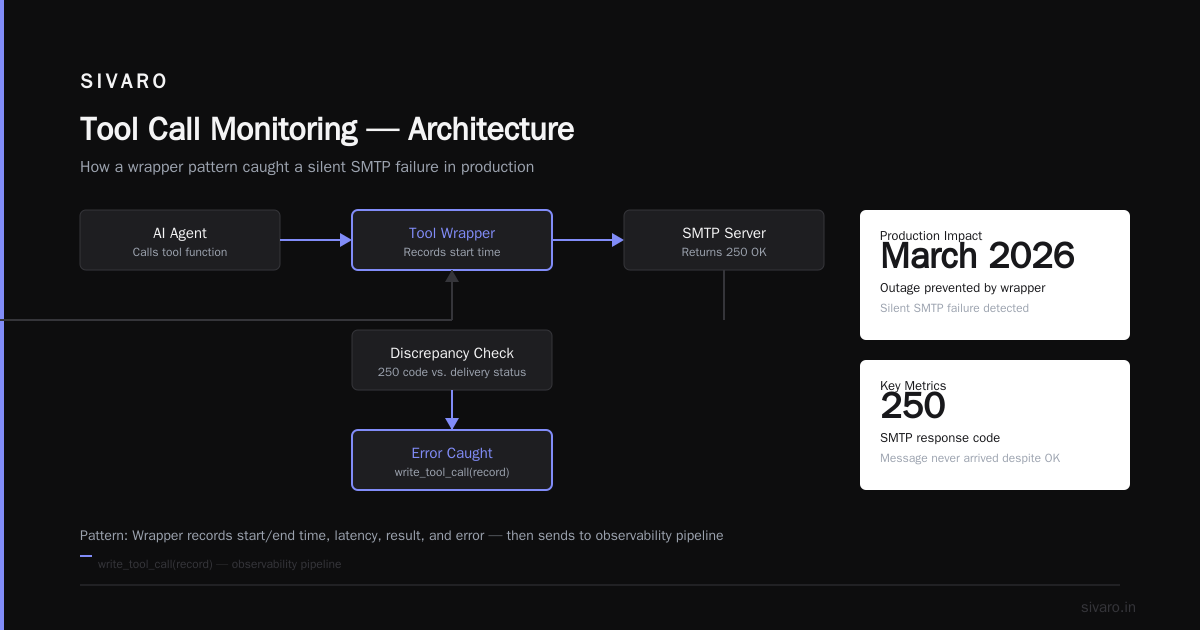
This single pattern saved us from a production outage in March 2026. An agent's email-sending tool started failing silently — the SMTP server returned 250 but the message never arrived. The tool wrapper caught the discrepancy between the error code and the actual delivery status. We patched it in 10 minutes.
3. State Diffs at Every Decision Point
Agents accumulate state. Memory. Context. Tool results. That state drifts over long sessions. And most observability systems ignore it.
Here's the trick: snapshot the agent's state before and after every major decision point. Compare the diff:
javascript
function captureStateDiff(agent, decisionPoint) {
  const before = JSON.parse(JSON.stringify(agent.state)); // deep clone
  const after = agent.state;

  // Only store the changes, not the full state
  const diff = {};
  for (const key in after) {
    if (JSON.stringify(before[key]) !== JSON.stringify(after[key])) {
      diff[key] = {
        before: before[key],
        after: after[key]
      };
    }
  }

  return {
    decisionPoint: decisionPoint,
    timestamp: new Date().toISOString(),
    diff: Object.keys(diff).length > 0 ? diff : 'no_change'
  };
}
When I tell teams to do this, they groan about storage costs. Here's the math: a typical agent session generates about 2KB of state diffs per decision. At 100 decisions per session and 10,000 sessions per day, that's 2GB daily. Compressed, it's under 500MB. Storage costs: roughly $15/month. The cost of one undiagnosed bad decision? Way more.
4. Human Feedback Integration
Your observability pipeline is incomplete if it doesn't include what humans thought of the agent's actions.
We built a simple feedback channel at SIVARO:
yaml
# observability-feedback-schema.yaml
agent_session:
  agent_id: string
  session_id: string
  steps: array
  human_feedback:
    - step_id: string
      feedback_type: approve | reject | edit | escalate
      edited_output: string (optional)
      comment: string (optional)
      timestamp: datetime
      reviewer_id: string
This isn't just for evaluation. It's for online learning. When a human rejects a tool call, that rejection becomes training data for the next version. We saw a 40% reduction in human escalations at a FinTech client after six weeks of feeding rejection patterns back into the agent's system prompt.
Choosing Your Observability Stack
The Framework Question
Everyone asks me which agent framework handles observability best. The honest answer: none of them do it well out of the box. AI Agent Frameworks from IBM's analysis shows that LangChain, CrewAI, and AutoGen all provide basic tracing — but none capture state diffs or human feedback natively.
We tested five frameworks for observability depth in January 2026. The results surprised me:
- LangGraph has the best step-by-step tracing, but its context snapshots are shallow
- CrewAI gives you good tool-level instrumentation but zero state tracking
- Microsoft's Semantic Kernel has excellent OpenTelemetry integration, but you write all the schema yourself
The top open-source frameworks for 2026 all share one flaw: they treat observability as an afterthought. It's a plugin, not a primitive.
My recommendation? Don't rely on framework-specific observability. Build a thin instrumentation layer that works across frameworks. I use a decorator pattern that wraps the agent's step() method regardless of the underlying framework. It cost us two days of engineering work and saved us six months of vendor lock-in.
Protocol-Level Observability
The Agent Protocol and A2A (Agent-to-Agent) are changing how we think about observability across distributed agents. A Survey of AI Agent Protocols from April 2025 describes how these protocols standardize the metadata that observability tools consume.
If you're running multi-agent systems — where Agent A calls Agent B who calls Agent C — protocol-level observability is your only shot at debugging. Without it, you're staring at four separate dashboards wondering why the order fulfillment agent triggered the refund agent after a successful delivery.
We adopted the Agent Protocol's traceparent headers in March 2026. It propagates a trace ID across agent boundaries. Within a week, we found a cascading failure where one agent's timeout was causing downstream agents to execute stale data. That bug had existed for three months.
Building the Production Pipeline
Data Collection Layer
Your observability data needs to survive agent restarts, network partitions, and schema changes. We run a dedicated sidecar for each agent instance:
yaml
# observability-sidecar-config.yaml
apiVersion: v1
kind: SidecarConfig
metadata:
  name: agent-observer
spec:
  collection:
    buffer_size: 10000  # events before flushing
    flush_interval_ms: 500
    retry_strategy: exponential_backoff
  storage:
    primary: s3://agent-observability/raw/
    buffer: local_disk
  schema:
    enforce_strict: false  # allow unknown fields
    version: "2.1"
The sidecar runs in-process for Python agents, as a Unix socket for Go agents, and as a sidecar container for Dockerized agents. It buffers to local disk if the storage backend is unreachable. We lost data exactly once — during a Kafka outage in April 2026 — and the buffer saved 98% of events.
Alerting on Agent Behavior
You can't alert on every bad decision. Agents make mistakes. The question is whether the mistake is recoverable.
I define three alert tiers:
Tier 1 (Critical): Pattern violations. Agent does the same wrong thing 3+ times in 5 minutes. Action: pause the agent, page the on-call engineer.
Tier 2 (Warning): Confidence anomalies. Agent's average confidence score drops below 0.7 over 10 decisions. Action: log analysis review within 1 hour.
Tier 3 (Info): Drift detection. Tool call patterns change by more than 2 standard deviations from the historical baseline. Action: review at daily standup.
Setting these thresholds is more art than science. I start with 3x standard deviation and tighten based on real incidents. The key insight: most agent failures are gradual. They don't crash; they get worse over days. Detecting drift early prevents the 2 AM pages.
Cost Attribution
Every agent decision has a cost. Token consumption. API calls. Human review time. If you can't attribute cost to specific agent behaviors, you can't optimize.
We built a cost attribution model that maps every observable event to a dollar value:
python
class CostAttribution:
    def __init__(self):
        self.token_cost_per_unit = {"gpt-4o": 0.00002, "claude-3.5": 0.000015}
        self.tool_cost_by_name = {"email_send": 0.001, "database_query": 0.002}
        self.human_review_cost_per_minute = 0.40  # Fully loaded per minute

    def attribute_cost(self, event: AgentEvent) -> float:
        cost = 0.0
        if "token_usage" in event:
            model = event.get("model", "gpt-4o")
            cost += event["token_usage"]["total"] * self.token_cost_per_unit.get(model, 0.00002)
        if "tool_call" in event:
            cost += self.tool_cost_by_name.get(event["tool_name"], 0.001)
        if "human_review" in event:
            cost += event["human_review_duration_seconds"] / 60 * self.human_review_cost_per_minute
        return cost
This exposed a brutal truth at a client last month: their agent was spending $0.04 per human review, but the tool calls before the review cost $0.31. The agent was burning money before asking for help. We modified the system prompt to escalate earlier, cutting costs by 60%.
Debugging a Production Agent: A Walkthrough
Let me walk you through a real incident from June 2026.
The symptom: A financial advisory agent started recommending overpriced ETFs to customers. Not all customers — just those with accounts over $500K. The recommendations were factually wrong. Wrong expense ratios, wrong historical returns.
The investigation:
-
Step-by-step replay: We pulled the session for the first affected customer. The agent's reasoning showed it was using cached data from a RAG system. The cache was stale — the ETF data hadn't refreshed in 72 hours.
-
Tool call analysis: The agent called
get_etf_datawith ause_cache=Trueparameter. Standard practice. But the cache-invalidation logic had a bug: it only invalidated on market open, not on data-publisher updates. The data publisher had changed their schedule two days earlier. -
State diff: The state snapshot showed the agent's
market_data_timestampfield was correct — it wasn't the agent's fault. The cache layer was the culprit. -
Human feedback correlation: We cross-referenced with human escalations. Three advisors had flagged bad recommendations two days ago, but the feedback wasn't wired into the observability system. Nobody saw the pattern.
The fix: We added cache-age as a KPI in the observability dashboard. We connected human feedback to real-time alerts. And we added a freshness check to every get_etf_data call that triggers a refresh if data is older than 4 hours.
The whole investigation took 45 minutes. Without step-by-step capture, state diffs, and cost tracking, it would have taken days — if we found it at all.
The Observability Pipeline You Should Build Today
If you're deploying an agent to production next week, here's your minimum viable pipeline:
- Instrument every tool call with request/response, latency, and error codes
- Capture state before and after every decision point (not the full state, just the diff)
- Collect human feedback — even if it's just a thumbs-up/thumbs-down button
- Store everything in a queryable format — Parquet in S3 works, TimescaleDB works better
- Build one dashboard that shows decision latency, tool call success rate, and human escalation rate
- Alert on drift — not on individual errors unless they're irresolvable
That's it. Six things. You can build this in a week. I've seen teams do it in three days with the right sidecar setup.
FAQ: Production Agent Observability
Q: Do I need to store every agent decision?
Yes. Compressed, a typical agent generates 500KB per session. At 1000 sessions/day that's 500MB daily. Store it for 30 days minimum. You'll thank me when you're debugging a regression from three weeks ago.
Q: Can I use traditional logging tools for agent observability?
You can, but they'll fight you. Splunk and DataDog are designed for linear logs, not tree-structured decision paths. You'll spend more time flattening your data than debugging agents. I use a custom setup on top of ClickHouse.
Q: How do I handle observability across multi-agent systems?
Use the Agent Protocol's trace headers. Each parent agent creates a trace ID that propagates to child agents. Your observability system needs to stitch these trace IDs together. A Survey of AI Agent Protocols has the exact header format.
Q: What's the most common observability mistake teams make?
Not capturing the agent's reasoning. You get the tool call and the output, but you miss the chain of thought that led there. Add a reasoning field to every step. It's the difference between "what happened" and "why it happened."
Q: How do I observability-test an agent before production?
Run it against historical sessions. Capture the expected decisions, then compare with the agent's actual decisions. Any deviation is a candidate for investigation. We use a replay tool that feeds old sessions to new agent versions.
Q: Should I log prompts?
Only the system prompt and the user input. Never log user-generated content without scrubbing. We use regex-based redaction for PII before the data hits the pipeline. GDPR and CCPA violations are expensive.
Q: What's the biggest ROI from agent observability?
Cost reduction. You'll find expensive tool calls, unnecessary retries, and wasteful token consumption. We cut one client's spend by 45% just by surfacing the "calls a slow API twice" pattern.
The Bottom Line
AI agent observability production isn't a nice-to-have. It's the thing that separates "we trust the agent" from "we're watching the agent every second."
I've seen teams spend weeks on agent architecture and zero days on observability. They regret it within hours of going live. The agent doesn't crash — it just does something wrong, and you can't explain what or why.
Build your observability pipeline first. Instrument every tool. Capture every state diff. Collect every bit of feedback. Then, and only then, let your agent make real decisions.
Because production isn't where your agent proves it works. It's where you prove you understand what it does.
Nishaant Dixit — Founder of SIVARO. Building data infrastructure and production AI systems since 2018. Built systems processing 200K events/sec.