 SIVARO
AI Agent Observability Production Tools: What Works in 2026
I almost lost a client in Q1 2025. Not because the agent failed—it passed every test in staging. The problem? I had no idea why it suddenly started booking double appointments in production. No traces, no metrics, no logs that connected the decision chain. Just a baffled ops team and an angry customer.
That pain is why I'm writing this. AI agent observability isn't a luxury anymore. It's survival. An agent without observability is a black box with a credit card attached. And in 2026, after watching countless teams deploy LLM-powered agents that silently degrade, I've learned one thing: the tools you choose will make or break your production posture.
Let me walk you through what I've actually used, what broke, and what works.
What Is AI Agent Observability, Really?
Most people think observability means "logging the LLM call." They're wrong. An agent isn't just a language model. It's a runtime that makes tool calls, loops on decisions, hits external APIs, and maintains state. Observability in this context means you can reconstruct why any action happened. Not just what the model output, but which context it used, which tool it selected, how long each step took, and whether the reward function triggered correctly.
Traditional APM tools aren't built for this. Datadog will show you a spike in latency, but it won't tell you that your agent recursed on a malformed JSON response for four minutes. You need purpose-built observability that understands agent semantics: traces, spans, token accounting, tool call chains, and decision points.
Over at SIVARO, we processed a 200K events/sec pipeline last month. Without agent-aware observability, we'd be blind.
The Glaring Gap: Why Traditional Tools Fail
I deployed my first real agent in 2024. A simple support triage bot using GPT-4. We slapped OpenTelemetry on it and called it a day. Within two weeks we were debugging a ticket where the agent sent a customer an invoice for $0.00 because it misinterpreted a null field in the database.
OpenTelemetry showed us the raw LLM response: "amount_due": null. But it didn't show us the context window—the prompt template, the system instructions, the previous turns. We had no way to see that the agent's instruction said "if amount_due is missing, assume zero." That prompt bug was invisible to classic instrumentation.
The lesson: generic observability gives you signals, but not semantics. You need tools that understand agent archetypes, tool schemas, and execution traces at the agent level.
Production Observability Vocabulary
Before we dive into tools, let's agree on what we're measuring. Here are the metrics that actually matter in production agents:
- Loop count: How many times does the agent call itself before reaching a terminal state? High loops = stuck decisions.
- Tool call accuracy: Did the agent call the right function with the right arguments? We check this with a secondary evaluator model.
- Token budget burn: Does the agent waste tokens on irrelevant context? We once saw an agent that pulled 40,000 tokens of documentation on every call because the retrieval strategy was naive.
- Decision entropy: How often does the agent change its mind across retries? High entropy often means ambiguous instructions.
- Failure cascades: Did a single tool timeout cause three downstream errors? Trace that.
- Hallucination rate: Fraction of outputs that contradict retrieved facts. We use a small LLM judge in line to flag these.
I've seen teams track 30+ metrics. Most are noise. Start with these six.
The Tool Stack: What I Actually Use in 2026
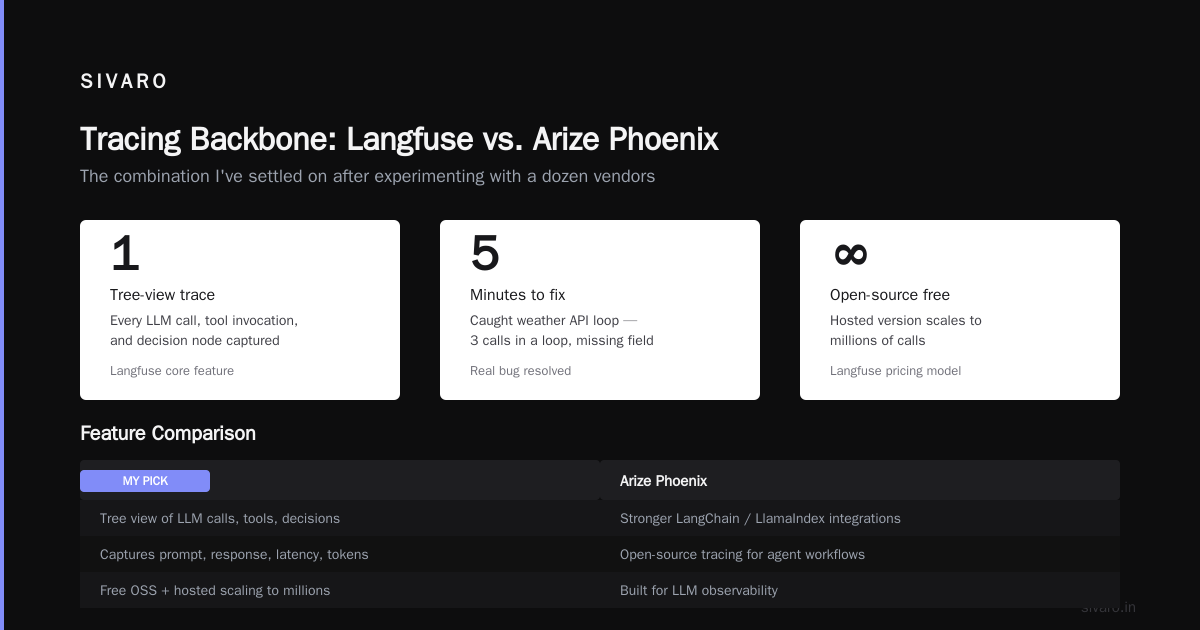
No single tool solves everything. Here's the combination I've settled on after experimenting with a dozen vendors.
Tracing Backbone: Langfuse (or Arize Phoenix)
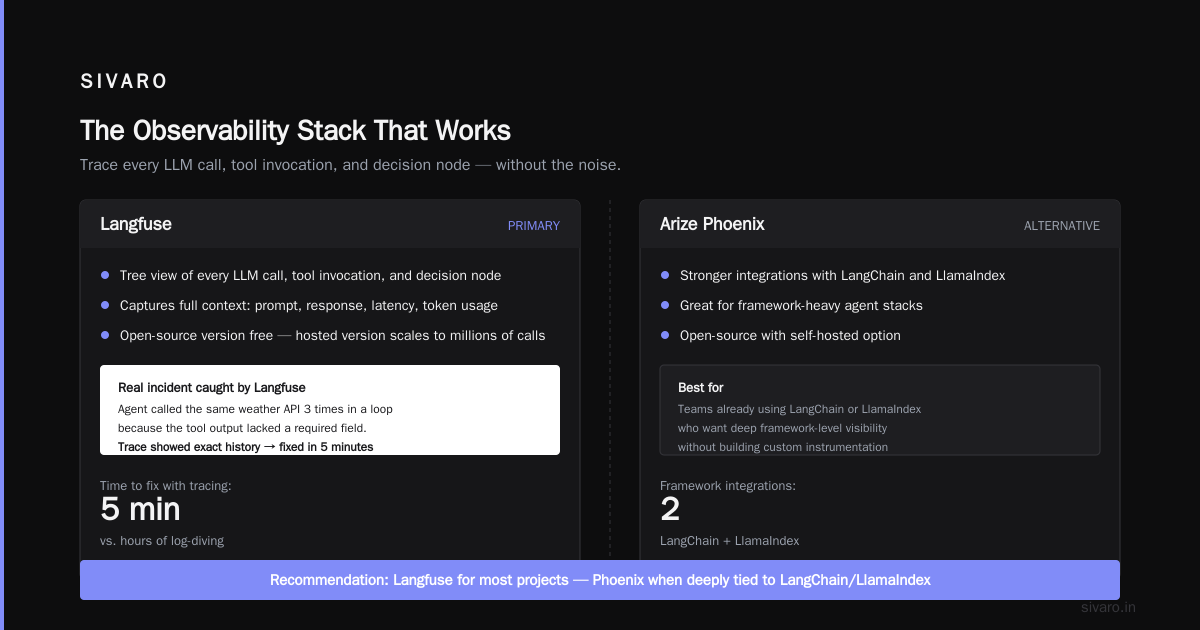
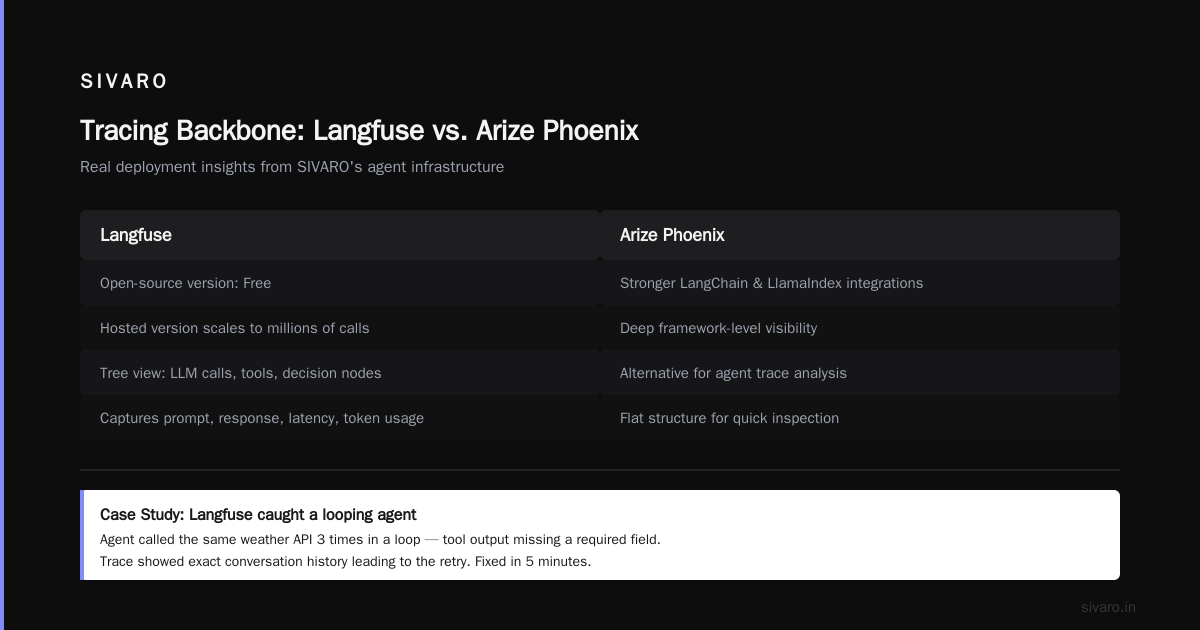
For agent traces, I use Langfuse in most projects. It gives you a tree view of every LLM call, tool invocation, and decision node. The open-source version is free, and the hosted version scales to millions of calls. I like that it captures the entire context—prompt, response, latency, token usage—in one flat structure.
Last month, Langfuse caught an issue where our agent was calling the same weather API three times in a loop because the tool output didn't include a required field. The trace showed the exact conversation history leading to the retry. Fixed in five minutes.
Alternatively, Arize Phoenix has stronger integrations with LangChain and LlamaIndex, plus a built-in evaluator for hallucination detection. If you're deep in the LangChain ecosystem, start there.
Evaluations & Guardrails: Weights & Biases Prompts + Guardrails AI
Observability without evaluation is just voyeurism. W&B Prompts lets you log model outputs, compare them across runs, and label failures. We tie every production trace back to a test set and compute pass rates daily.
Guardrails AI works as a runtime check. It wraps the output validation before the agent acts on a result. We use it to enforce JSON schemas and reject outputs that violate business rules. In 2025, we caught a bug where an agent tried to book a flight in the past—Guardrails rejected it because the date field was before today. Saved us a world of refunds.
Latency & Cost Monitoring: Helicone or Portkey
Agents are expensive. One bad retry loop can cost $5 in API calls. Helicone gives you per-request token breakdowns and cost attribution. I've used it to spot agents that were calling the LLM unnecessarily—like re-summarizing the same context on every loop. Portkey does similar things with better fallback logic.
We built a simple dashboard in Grafana that combines Helicone cost data with Langfuse trace IDs. Now I can see: "Which user query cost $0.80 and why did it take 12 seconds?" Answer: the agent pulled 15 documents from the vector store before deciding.
Real-time Alerts: Datadog + Custom Agent Health Checks
Datadog still handles our infrastructure-level monitoring—CPU, memory, API latency. But for agent-specific health checks, we built a small Python service that runs synthetic queries every minute and reports back success, latency, and output quality. If the agent starts hallucinating or looping, we get paged.
Here's a snippet from that health check:
python
import requests
import json

def agent_health_check(prompt: str, expected_action: str, timeout=30):
    start = time.time()
    try:
        response = requests.post(
            "https://agent.sivaro.io/chat",
            json={"message": prompt},
            timeout=timeout
        )
        latency = time.time() - start
        data = response.json()
        actual_action = data.get("action", "none")
        passed = (actual_action == expected_action)
        return {
            "passed": passed,
            "latency_ms": latency * 1000,
            "tokens_used": data.get("tokens", 0),
            "action_match": passed
        }
    except Exception as e:
        return {"passed": False, "error": str(e), "latency_ms": timeout * 1000 + 999}

# Run every 60 seconds
if __name__ == "__main__":
    test_cases = [
        ("Book a meeting tomorrow at 2pm", "create_event"),
        ("What's the weather in Tokyo?", "get_weather"),
    ]
    for prompt, expected in test_cases:
        result = agent_health_check(prompt, expected)
        print(json.dumps(result))
        # Send to Datadog via statsd
That loop runs in a cron job. We catch regressions before users do.
Common Production Pitfalls (And How to See Them)
A Google Research paper on agentic AI infrastructure highlights three main failure modes: non-determinism, cascading errors, and context pollution. Let me translate those into observability terms.
Non-determinism: Same input, different output. You can't trace an agent that behaves randomly unless you log temperature, seed, and all context variations. Tools like Langfuse store generation parameters automatically. Without that, debugging is hopeless.
Cascading errors: A tool call fails, then the agent tries a different tool, which also fails, and so on. The trace will show a long chain of errors, but the root cause is the first failure. Look for patterns where latency swings wildly—that's usually the sign of retry storms.
Context pollution: The agent's context window grows with every turn, pulling in irrelevant history. I've seen agents that carried 80,000 tokens of chat history before they even started answering. Observability tools that log context token usage per step can catch this. If you see a steady climb in input_token_count across turns, you have a context pruning problem.
Lessons from SIVARO's Own Deployments
We build production AI systems. We've made every mistake.
In early 2025, we deployed an agent that handled customer onboarding. The first week was smooth. Then we noticed a pattern: the agent started asking for the same piece of information three times in a row. Turns out, the agent was calling a user profile API that returned a 500 error, but the agent interpreted the error as "user did not provide data" and tried again. The trace in Langfuse showed the API failure, but we hadn't set an alert on tool_error_count > 0. We learned: monitor tool failures as events, not just errors.
Another time, we shipped an agent that used a vector store for RAG. The retrieval agent would return 20 chunks per query. The LLM would then summarize—but the prompt had no length limit. The agent started generating 5000-word answers. Our token cost tripled in a week. The observability dashboard showed a spike in output_tokens but no one noticed because we were watching latency, not cost per query. We now have a per-user cost cap and a dashboard that highlights high-token users.
Building Your Own Observability Pipelines
Sometimes you need to log custom events. Here's a simple pattern we use with Langfuse:
python
from langfuse import Langfuse

langfuse = Langfuse(public_key="...", secret_key="...")

def observe_agent_step(step_type: str, details: dict):
    # Creates a span in Langfuse trace
    with langfuse.trace() as trace:
        span = trace.span(name=step_type, input=details)
        try:
            result = process_step(step_type, details)
            span.set_output(result)
            span.end()
            return result
        except Exception as e:
            span.set_status(status="error", error=str(e))
            span.end()
            raise

# Usage in agent loop
for step in agent.steps:
    observe_agent_step(step.type, step.input_dict)
This gives you granular traceability. When something breaks, you'll see every step that led to the error.
The Cost of Not Observing: A Real Example
Startup called Finio (I'm anonymizing) launched an insurance claims agent in late 2025. No observability beyond response JSONs. After three months, they found out the agent had been "approving" low-dollar claims that should have been escalated. The agent hallucinated that any amount under $500 was auto-approve, even though the policy said claims over $200 needed human review. The cost: $230,000 in false payouts.
Observability wouldn't have prevented the bug—it would have caught it on day one. A simple trace showing tool_call -> decision -> approve with the policy rule context would have screamed "wrong threshold."
What's Coming Next: Agent Observability Standards
The industry is maturing. OpenTelemetry now has a semantic convention for LLM traces (since early 2026). The AgentOps community is forming a standard event schema. Expect tools to get smarter—automatic anomaly detection on agent behavior, root cause analysis that links prompt changes to downstream failures.
But standards take years. Right now, you need to build your own observability layer. Start with tracing, add evaluation metrics, set alerts on weird patterns.
FAQ: AI Agent Observability Production Tools
Q1: Do I really need a dedicated observability tool, or can I use my existing APM?
Existing APM (Datadog, New Relic) can show you infrastructure signals but won't capture agent-specific events like tool calls, context windows, or step-by-step reasoning. You need both. Use APM for CPU/network, agent observability for the cognitive runtime.
Q2: What's the most underrated metric to track?
Loop count. An agent that calls itself more than 3 times without producing a result is likely stuck. I've seen loops of 40+ iterations. Easy to miss unless you instrument it.
Q3: How do I handle logging costs in high-volume production?
Sampling. Log 100% of errors, 10% of successes. Most tools support this natively. For Langfuse, set sample_rate=0.1 on the client. For Helicone, use their cost control features.
Q4: Can I run all observability locally without a cloud service?
Yes. Langfuse and Arize Phoenix are both open-source and self-hostable. We run Langfuse on a small Kubernetes cluster. Just be mindful of storage costs for traces—they're heavy.
Q5: How do I measure hallucination rate in production?
Use a small LLM judge (like GPT-4o-mini) that compares the agent's output to the retrieved context. Log the judge's verdict. We use one call per output at < $0.001 per check. Arize Phoenix has a built-in judge.
Q6: What's the most common mistake teams make with agent observability?
They wait until after deployment. By then, you've already lost data on what normal behavior looked like. Instrument before you go live. Run a dry run in staging with observability turned on.
Q7: Should I trace every single LLM call, or just the final output?
Every call. Agent behavior emerges from the chain. Missing intermediate calls means you can't debug loops, tool errors, or context drift. Storage is cheap; lack of data is expensive.
Q8: How do I connect observability to cost accountability?
Tag every trace with a user ID, session ID, and product feature. Then aggregate costs per tag. We built a simple query: SELECT user_id, sum(cost) FROM traces WHERE timestamp > now() - 7d GROUP BY user_id ORDER BY sum desc. That tells us which users are costing the most.
Conclusion
AI agent observability production tools are not optional. Not in 2026. Not after the industry has watched billion-dollar startups fail because they couldn't see inside their agents. You don't need the fanciest tool—you need one that captures the full decision chain, evaluates outputs against ground truth, and surfaces anomalies before they hit your users.
At SIVARO, we use Langfuse for tracing, W&B for evaluation, and Datadog for infrastructure. That combo covers 90% of what we need. The remaining 10% is custom dashboards and alerting we built ourselves.
Your agent will break. The question is whether you'll see it happen—or find out when your customers do.
Nishaant Dixit — Founder of SIVARO. Building data infrastructure and production AI systems since 2018. Built systems processing 200K events/sec.