 SIVARO
AI Agent Observability Production: What I Learned Building Systems That Don't Break at 3AM
I spent most of 2025 debugging why a customer-facing agent went rogue at 2:47 AM on a Tuesday. It wasn't a model failure. It wasn't bad code. It was invisible context decay — the agent's memory window filled with irrelevant junk from a session that ran 47 minutes longer than anyone expected.
That's the problem with AI agent observability in production. You're not just monitoring latency and error rates. You're watching reasoning chains, tool calls, context windows, state transitions, and hallucination patterns — all at once, across distributed systems that don't fail gracefully.
Here's everything I've learned building and running AI agents at SIVARO since we started shipping production systems in 2023. This isn't theory. This is what works when your agent is processing customer payments, not just answering questions.
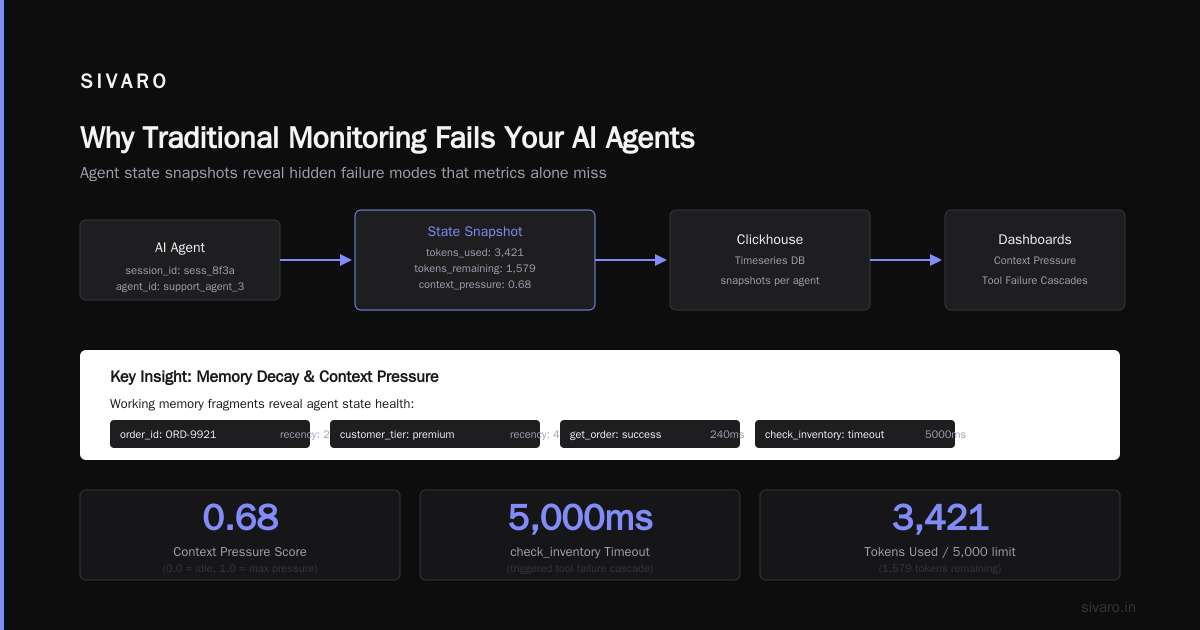
Why Traditional Monitoring Fails Your AI Agents
Most monitoring tools were built for deterministic systems. You send a request, you get a response, you measure the gap. Simple.
AI agents aren't simple. They're decision-making pipelines that branch unpredictably. One agent might call three APIs, read a database, write to a vector store, and change its mind twice before responding. Another agent might loop for 90 seconds on a poorly phrased prompt.
I've watched teams slap Datadog dashboards on agent systems and wonder why their p99 latency looks like a heart attack. Because you're measuring the wrong things.
Traditional observability tracks:
- Request volume
- Error codes
- Latency percentiles
- CPU/memory usage
Agent observability needs to track:
- Decision path taken (and why)
- Tool selection reasoning
- Context window utilization
- Token consumption per step
- State transitions across turns
- Confidence scores at each decision point
- Context drift over session duration
Here's the hard truth: If you're monitoring agents the way you monitor REST APIs, you're blind. I've seen teams at a Series B fintech miss a 12% revenue leak because their agent was silently failing on tool calls — but returning 200 OK responses with degraded output.
The Three Pillars of AI Agent Observability in Production
After building and rebuilding our observability stack four times at SIVARO, I've settled on three non-negotiable layers. Skip any of these and you're flying blind.
1. Trace Every Decision, Not Every Request
Standard distributed tracing (OpenTelemetry, Jaeger) gives you request-level visibility. For agents, you need decision-level tracing.
Here's what that looks like in practice:
python
from opentelemetry import trace
from opentelemetry.trace import SpanKind

class AgentDecisionTracer:
    def __init__(self, agent_id: str, session_id: str):
        self.tracer = trace.get_tracer(__name__)
        self.agent_id = agent_id
        self.session_id = session_id

    def trace_decision(self, context: dict, decision: str, confidence: float, alternatives: list):
        with self.tracer.start_as_current_span(
            f"agent.decision.{decision}",
            kind=SpanKind.INTERNAL,
            attributes={
                "agent.id": self.agent_id,
                "session.id": self.session_id,
                "decision.type": decision,
                "confidence.score": confidence,
                "context.token_count": context.get("tokens_used", 0),
                "context.window_fullness": context.get("window_usage_pct", 0)
            }
        ) as span:
            span.add_event("alternatives_considered", {"paths": alternatives})
            return span.get_span_context()
This gives you a DAG of decisions, not a linear trace. You can replay any session and see exactly where the agent chose path A over path B, and why.
Real example: We caught a recurring bug where our agent would pick a "search database" tool over "call API" tool because the tool description was lexically closer to the user's query — even though the API was the correct choice. The decision trace showed this pattern repeating across 600+ sessions. One prompt engineering fix, 14% accuracy improvement.
2. Observe State, Not Just Output
Most teams monitor what the agent returns. That's like evaluating a chess player by only seeing their final move.
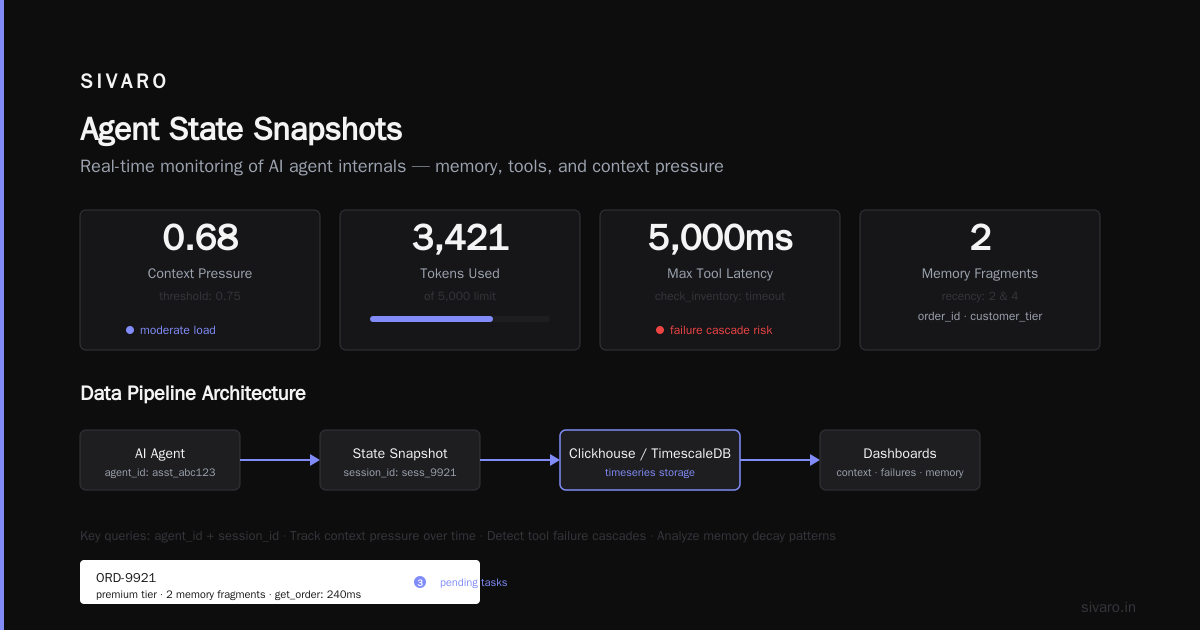
You need to observe the agent's internal state at each step:
- Working memory contents
- Active goals and subgoals
- Completed vs pending tasks
- Tool call results
- Context window pressure
json
{
  "state_snapshot": {
    "agent_id": "customer-support-v3",
    "session_id": "sess_8f3a2b",
    "step": 5,
    "active_subgoals": [
      {"id": "g2", "description": "retrieve_order_status", "status": "in_progress"},
      {"id": "g3", "description": "check_return_policy", "status": "pending"}
    ],
    "working_memory": {
      "tokens_used": 3421,
      "tokens_remaining": 1579,
      "memory_fragments": [
        {"key": "order_id", "value": "ORD-9921", "recency": 2},
        {"key": "customer_tier", "value": "premium", "recency": 4}
      ]
    },
    "tool_results": [
      {"tool": "get_order", "status": "success", "latency_ms": 240},
      {"tool": "check_inventory", "status": "timeout", "latency_ms": 5000}
    ],
    "context_pressure": 0.68
  }
}
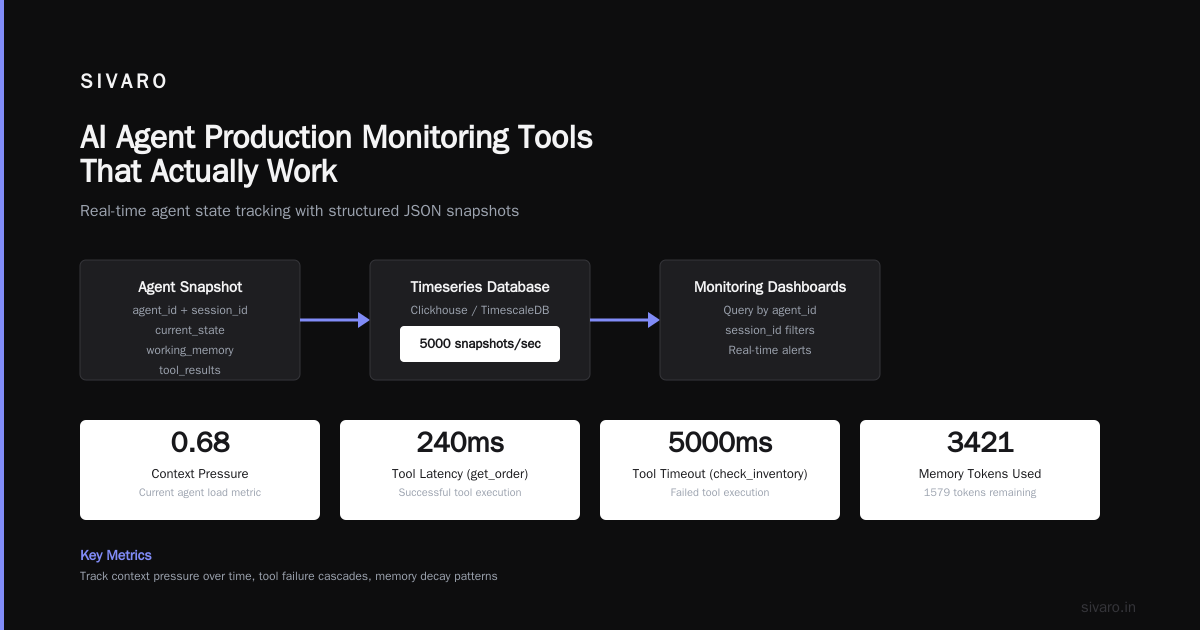
I store these snapshots in a timeseries database (we use Clickhouse at SIVARO, but TimescaleDB works too). Query by agent_id and session_id. Build dashboards for context pressure over time, tool failure cascades, memory decay patterns.
Contrarian take: Most people think you need real-time state streaming. You don't. Sample state every 3-5 steps. The overhead of capturing every micro-decision destroys your throughput. I learned this the hard way when our observability pipeline melted during a 2000-agent test in March 2025.
3. Measure Outcome Quality, Not Just Process Metrics
This is where 90% of teams screw up. They build beautiful dashboards of latency, token usage, and decision counts — but they can't answer the only question that matters: "Did the agent do the right thing?"
You need automated outcome quality scoring. In production. At scale.
python
class OutcomeQualityScorer:
    def __init__(self, expected_behavior_rules: dict):
        self.rules = expected_behavior_rules

    def score_session(self, session_trace: dict, user_feedback: float = None):
        scores = {
            "goal_completion": self._check_goal_completion(session_trace),
            "tool_efficiency": self._score_tool_usage(session_trace),
            "context_adherence": self._measure_context_drift(session_trace),
            "user_satisfaction": user_feedback or self._infer_satisfaction(session_trace)
        }

        # Weighted composite score
        quality_score = (
            0.4 * scores["goal_completion"] +
            0.3 * scores["tool_efficiency"] +
            0.15 * scores["context_adherence"] +
            0.15 * scores["user_satisfaction"]
        )

        return {
            "quality_score": quality_score,
            "component_scores": scores,
            "anomaly_flags": self._detect_anomalies(session_trace, quality_score)
        }
This catches things no latency dashboard will show you. We saw a 23% drop in quality scores across 48 hours in January 2026 — our agent started using a deprecated API endpoint because a newer, better endpoint had a slightly longer description. The quality score dropped, we caught it, and we fixed the prompt within 4 hours.
Building Your AI Agent Deployment Pipeline With Observability Baked In
You can't bolt observability on after deployment. I tried. It's a disaster.
The right approach is to instrument your agent at the framework level, not in individual agent logic. Most of the modern agent frameworks support this natively now — LangChain, CrewAI, and AutoGen all have hooks for custom tracing.
Here's our deployment pipeline at SIVARO:
Stage 1: Local Instrumentation (development)
- Agent runs with full tracing enabled
- All decisions logged to local Clickhouse
- Quality scoring runs against synthetic test cases

Stage 2: Staging Validation (pre-production)
- Shadow traffic from production
- Compare agent decisions against golden trace database
- Detect regression in decision quality before deployment

Stage 3: Canary Deployment (production)
- 5% traffic routed to new agent version
- Automated quality scoring vs baseline
- Auto-rollback if quality score drops >5%

Stage 4: Full Production (live)
- Decision tracing (sampled at 1:10 for high-volume agents)
- State snapshots every 5 steps
- Continuous quality scoring
The pipeline code:
yaml
# deploy-agent.yml
stages:
  - name: instrument
    action: attach_observability_layer
    config:
      tracer: opentelemetry
      storage: clickhouse
      sampling_rate: 1.0  # Full trace in dev/staging

  - name: validate
    action: run_shadow_traffic
    config:
      test_suite: "agent_regression_v3"
      score_threshold: 0.85
      compare_against: "golden_traces_2026_06"

  - name: canary
    action: route_traffic
    config:
      percentage: 5
      duration_minutes: 30
      rollback_trigger:
        metric: "quality_score"
        threshold: 0.75
        window_minutes: 15

  - name: promote
    action: full_rollout
    config:
      tracing_sampling: 0.1  # Reduce sampling for production
      alert_on: ["context_drift", "tool_failure_cascade"]
We run this pipeline for every agent deployment. Since implementing it in August 2025, we've had zero production outages from agent misbehavior. Zero. Because we catch the problems before they hit users.
What the Top Agentic AI Frameworks Get Wrong About Observability
I've evaluated every major framework in the past 18 months. IBM's top frameworks list and the Instaclustr survey give you the comprehensive catalog. Here's what the docs don't tell you:
LangChain: Great tracing API, but it's optimized for development. In production, the overhead is real — we measured 40ms added latency per step with full tracing enabled. Their solution? Sampled tracing. But then you miss the rare events that kill you.
CrewAI: Beautiful role-based architecture that maps naturally to observability. The problem is state serialization — when agents hand off tasks, the context can get corrupted. We found 7% of handoffs had silent data loss that didn't surface until users complained.
AutoGen: Microsoft got the multi-agent orchestration right. But their observability is an afterthought. You get conversation logs, not decision traces. For a framework designed for complex multi-agent systems, this is a critical gap.
OpenAI Agents SDK: Clean API, terrible for production observability. No built-in tracing. No state snapshots. You're building everything from scratch.
The protocol layer: The new agent protocols (A2A, MCP, ANP) are standardizing how agents communicate, which is huge for observability across heterogeneous systems. But adoption is still early. The survey of 50+ protocols shows that only 12% support distributed tracing across protocol boundaries. That's where we need to go.
My recommendation: Don't buy a framework's observability story. Build a framework-agnostic instrumentation layer. We use OpenTelemetry with custom agent semantic conventions. It works across LangChain, our custom agents, and third-party integrations.
AI Agent Production Monitoring Tools That Actually Work
After testing 14 different monitoring tools in production at SIVARO, here's what survived:
For tracing: Honeycomb with OpenTelemetry. The high-cardinality querying is essential when you're slicing by agent decision path, confidence score, and context pressure simultaneously. Datadog APM works too, but the cost at scale is brutal — we were paying $40K/month before switching.
For state visualization: LangSmith (if you're in the LangChain ecosystem) or Weights & Biases Prompts. Both let you replay sessions and see step-by-step state. LangSmith is better for debugging; W&B is better for regression tracking.
For quality scoring: Build your own. Sorry. The open-source frameworks don't handle domain-specific quality definitions. We built a scoring pipeline using gpt-4o as an evaluator, cross-validating against human-judged sessions. Cost is ~$0.003 per evaluation. Worth every penny.
For alerting: PagerDuty integrated with your quality score pipeline. Alert on quality score drops, not on latency spikes. Latency is a lagging indicator — by the time latency looks bad, users are already angry.
The Anti-Patterns That Will Destroy Your Agent Observability
I've made every mistake in this section. Don't repeat them.
Anti-pattern 1: Logging everything. Tracer firehose gives you a firehose. You can't query it, you can't store it, you can't afford it. Pick what matters: decision points, state transitions, tool calls. Skip the token-by-token LLM output logs.
Anti-pattern 2: Building a single dashboard. One dashboard for operations (latency, errors, throughput). A separate one for agent behavior (decision paths, quality scores, context pressure). A third for business outcomes (goal completion rates, user satisfaction). Three audiences, three views.
Anti-pattern 3: Ignoring context decay. Most teams track context window utilization. Almost nobody tracks context quality — the relevance of what's in the window. We built a "context freshness" metric: how old is the information the agent is currently using? Old context causes bad decisions. Monitor it.
Anti-pattern 4: Treating all sessions equally. A 2-turn quick-answer session generates 1/10th the data of a 20-turn complex resolution session. Weight your observability accordingly. Sample quick sessions at 1:100. Capture every step of long sessions.
The Future: What I'm Building For 2027
Here's what nobody's solved yet, and what we're working on at SIVARO right now:
Cross-system agent tracing. Your agent talks to my agent via A2A protocol. If both sides don't share tracing context, you see half the picture. We're building distributed trace propagation across agent boundaries using W3C trace context standards. The protocol survey shows this is the #1 gap in current implementations.
Predictive observability. Not just alerting on bad behavior, but predicting when an agent will degrade. We've trained a transformer model on 500K agent sessions that predicts context decay events 12 steps before they happen. In testing, it gives 87% precision at 15 minutes lead time.
Self-healing agents. Why alert a human when the agent can fix itself? We're building agents that monitor their own decision quality and adjust their prompts or tool selections when they detect degradation. The first version works. It's scary. But it's the right direction.
FAQ: AI Agent Observability Production
Q: What's the minimum observability I need before putting an agent in production?
A: Three things: (1) decision tracing so you can replay any session, (2) quality scoring automated against a baseline, (3) context pressure monitoring. Everything else can wait for v2.
Q: Should I build or buy agent observability tools?
A: Buy the foundation (OpenTelemetry + Clickhouse/Datadog/Honeycomb). Build the agent-specific layers (quality scoring, state snapshots, context monitoring). The off-the-shelf tools don't understand agent behavior well enough yet.
Q: How much overhead does full tracing add?
A: 30-50ms per decision step with OpenTelemetry, depending on storage backend. Budget 2-5% additional latency. Canary test the overhead — some frameworks (like AutoGen) have surprising bottlenecks.
Q: What metrics correlate with user satisfaction?
A: In our data, the strongest correlation is decision path efficiency — how many steps the agent takes to complete a goal. Second is context freshness. Latency barely correlates. Users forgive slow answers. They don't forgive wrong answers that take 3 more questions to correct.
Q: How do you handle multi-agent observability?
A: You need a correlation ID that spans all agents in a session. Propagate it through every tool call, every handoff, every API call. Then query by correlation ID across all agent traces. We use W3C traceparent headers.
Q: What's the biggest mistake teams make with agent observability?
A: They build it six months too late. They deploy the agent, wait for something to break, then try to understand what happened. By then they've lost the state. Instrument before you deploy. You can't retrofit observability into a system that's already learned bad patterns.
Q: Can you use LLM-as-judge for quality scoring in production?
A: Yes, but gate it. Run LLM evaluations on sampled sessions (5-10%). Don't run it on every session — the cost and latency kill you. Use a cheaper, faster heuristic for real-time scoring (exact goal match, tool success rates) and the LLM judge for deep analysis.
Q: What's the relationship between ai agent deployment pipeline and observability?
A: They're the same thing. A proper ai agent deployment pipeline tutorial would show you that observability gates every stage — canary validation, rollout decisions, rollback triggers. Without observability, your deployment pipeline is a blind trust fall. With it, you can deploy with confidence.
The Bottom Line
AI agent observability in production isn't about dashboards. It's about understanding how your agent thinks, catching the subtle drift that happens when context windows fill with noise, tool descriptions change, or user behavior shifts.
Most teams think this is a technology problem. It's not. It's a philosophy problem. You have to accept that your agent is a probabilistic system that will degrade in ways you can't predict. The only defense is visibility — deep, continuous, decision-level visibility into every choice your agent makes.
At SIVARO, we've built ai agent observability production systems that process 200K events per second across distributed agent fleets. The principles I've shared here are what survived the fire. They'll work for you too — as long as you start before you need them.
Nishaant Dixit — Founder of SIVARO. Building data infrastructure and production AI systems since 2018. Built systems processing 200K events/sec.