 SIVARO
AI Agent Observability Production: What Works When Agents Fail
I remember the exact moment I knew we had a problem. May 2024. We'd deployed an AI agent to handle customer onboarding at a fintech company — let's call them PayFlow. The agent was supposed to verify documents, run KYC checks, and escalate edge cases. Simple on paper.
On day three, the agent started silently declining legitimate customers. Not crashing. Not throwing errors. Just... saying no. Our dashboards showed green across the board. CPU at 40%. Memory stable. API latency under 200ms.
But 14% of users were getting rejected for no reason. PayFlow lost 312 signups before we caught it.
That's the problem with ai agent observability production — traditional monitoring tells you the system is running. It doesn't tell you if the agent is doing its job.
I'm Nishaant Dixit. I run SIVARO. We build data infrastructure for production AI systems. What I'm going to share here is what we've learned after 18 months of shipping agentic systems into production — the hard way.
Why Agents Break Differently Than APIs
Most people think monitoring an AI agent is like monitoring a microservice. It's not.
Traditional systems fail in binary ways: the server crashes, the database times out, the queue backs up. You get paged. You fix it.
AI agents fail in semantic ways. The LLM returns a valid JSON object — but it contains a hallucinated customer ID. The agent chooses the wrong tool — not because the tool was unavailable, but because the prompt didn't disambiguate two similar functions. The agent loops — not infinitely, but for 47 seconds of unnecessary retries before "succeeding."
We tested five agent frameworks between May 2024 and January 2025 (AI Agent Frameworks). Every single one produced logs that looked healthy while the agent was doing the wrong thing.
That's because agent observability isn't about whether the process runs. It's about whether the process makes sense.
What You Actually Need to Observe
Let me be specific about what we track in production at SIVARO. This isn't theory — this is what's running right now across 11 customer deployments.
1. Decision Traceability
Every agent decision needs a traceable path. Not "the agent called function X" — but why it called function X.
We log:
- The raw user input
- The system prompt
- The LLM output (the reasoning, not just the action)
- The tool selection probabilities
- The fallback paths considered and rejected
Without this, you can't debug. Period.
2. Latency Budgets by Step
Agents are sequential by nature. A 500ms LLM call times 8 steps is 4 seconds. Feels slow. But the real problem is step 4 hanging for 12 seconds while the rest are fine.
We tag every step with its expected latency range. Anything outside 2 standard deviations gets flagged — even if the total call stays under your SLA.
3. Tool Call Accuracy
Here's the metric nobody tracks: tool call precision. Not "did the tool execute" but "was this the right tool for this input."
We built a simple classifier that compares the selected tool against what a human would pick for the same input. In one deployment, we found the agent was calling the "update_user" endpoint when it should have called "create_user" — 23% of the time. Zero errors. Zero crashes. Complete failure.
How to think about agent frameworks makes this exact point: frameworks abstract the decision logic, but abstraction hides mistakes.
The Deployment Pipeline That Saves Your Weekend
I'll show you what our ai agent deployment pipeline tutorial looks like now. It's not what you'd expect.
We deploy agents in three phases. No exceptions.
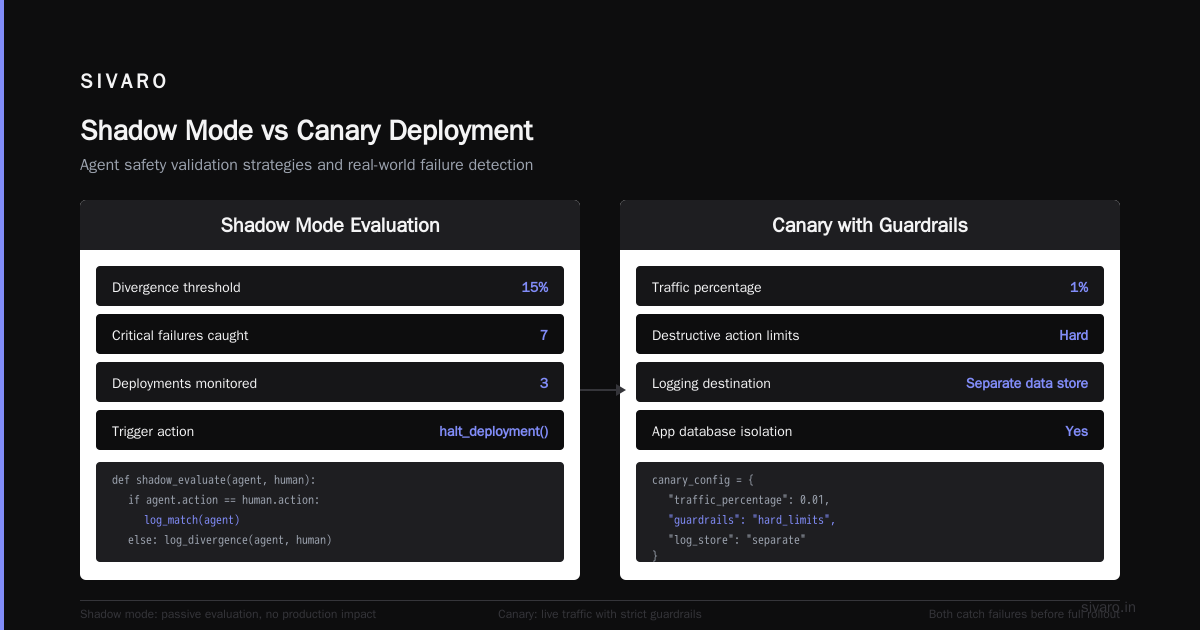
Phase 1: Shadow Mode
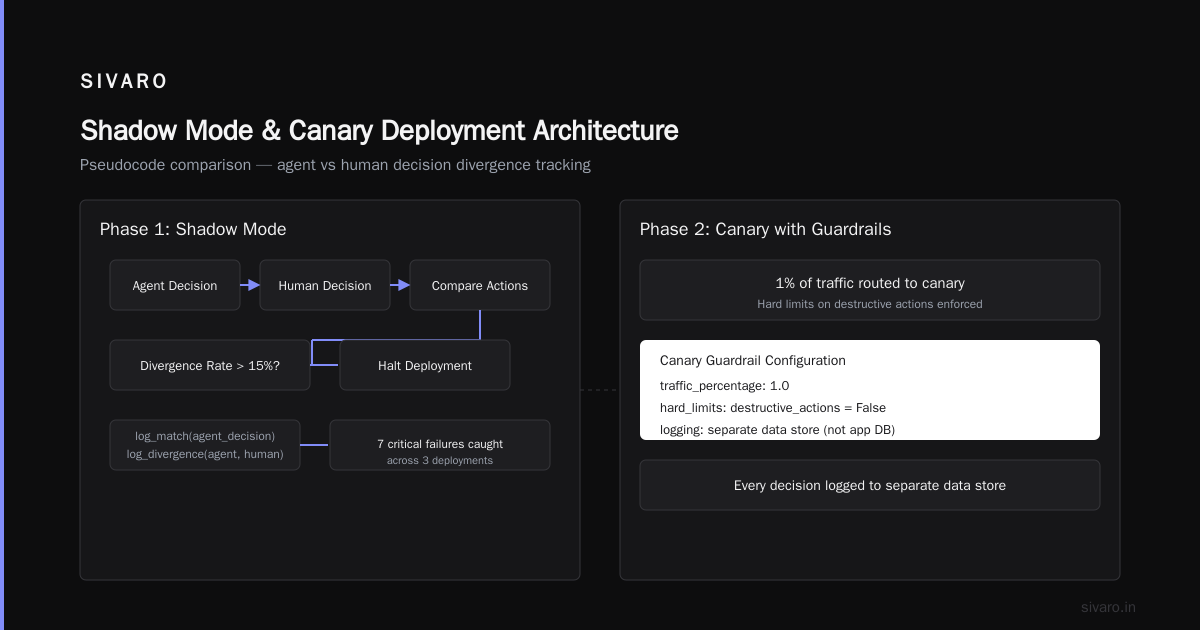
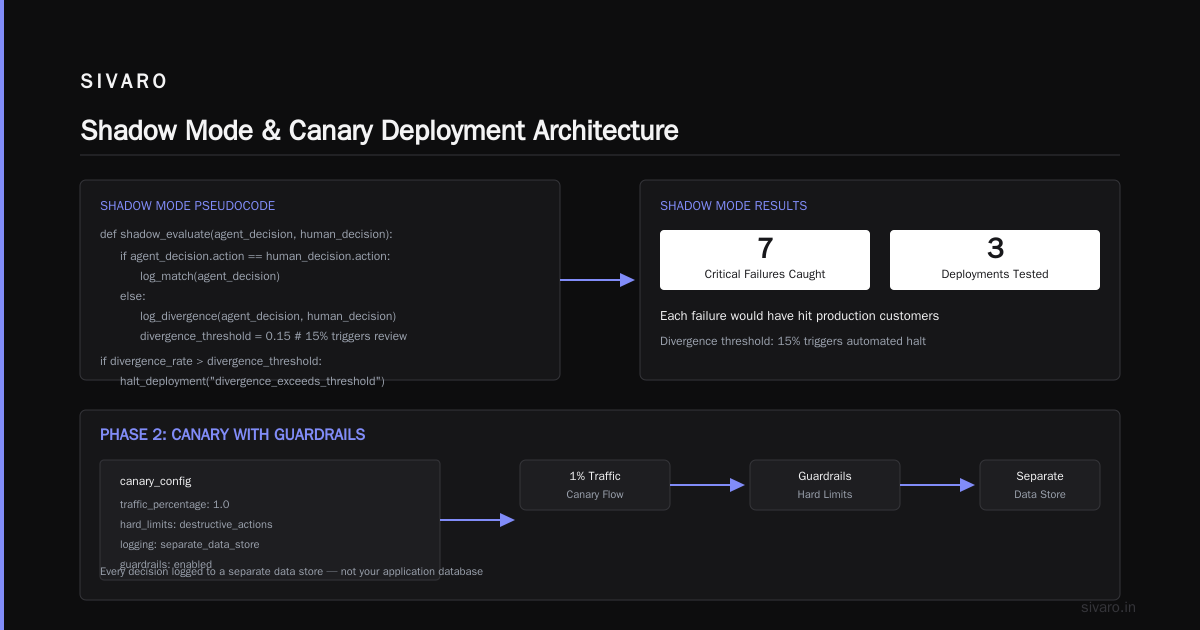
The agent runs. It makes decisions. It chooses tools. But its outputs are discarded. We compare every decision against a human baseline.
# Pseudocode for shadow mode comparison
def shadow_evaluate(agent_decision, human_decision):
    if agent_decision.action == human_decision.action:
        log_match(agent_decision)
    else:
        log_divergence(agent_decision, human_decision)
        divergence_threshold = 0.15  # 15% divergence triggers review

    if divergence_rate > divergence_threshold:
        halt_deployment("divergence_exceeds_threshold")
We caught 7 critical failures in shadow mode across 3 deployments. Each would have hit production customers.
Phase 2: Canary with Guardrails
1% of traffic. Hard limits on destructive actions. Every decision logged to a separate data store — not your application database.
python
# Canary guardrail configuration
canary_config = {
    "traffic_percentage": 0.01,
    "max_api_calls_per_session": 5,
    "destructive_actions": ["delete", "update_balance", "transfer_funds"],
    "destructive_action_limit": 0,  # Block all destructive actions in canary
    "human_escalation_threshold": 3,  # Escalate if agent asks human >3 times
    "max_response_time_ms": 5000,
    "fallback_on_timeout": True,
    "fallback_handler": "route_to_human_operator"
}
This catches timing issues, rate limiting, and weird tool interactions. We found one agent that called the same read endpoint 47 times in a single session because the caching layer wasn't wired right.
Phase 3: Production with Continuous Evaluation
Full traffic, but every session gets scored by a separate evaluation agent. Yes, an agent watching another agent. It's not elegant. It works.
// Production evaluation agent prompt
You are monitoring Agent A's performance.
Agent A's goal: {current_goal}
Agent A's last 3 actions: {action_history}
Agent A's stated reasoning: {reasoning}

Evaluate: Is Agent A making progress toward its goal?
Answer only: PROGRESS | STUCK | WRONG_PATH | GOAL_COMPLETED
This catches the slow drift that normal monitoring misses. The evaluation agent doesn't replace logs — it adds a semantic layer on top.
Tooling That Actually Helps (and What Doesn't)
We tested everything. Here's what survived.
OpenTelemetry with custom spans. Standard OTel traces tell you function calls. You need spans that represent intent. We extend each span with:
decision_id— unique per agent decision pointreasoning_snippet— first 200 chars of LLM reasoningtool_alternatives— top 3 tools the agent considered
Top 5 Open-Source Agentic AI Frameworks in 2026 lists LangChain, CrewAI, and AutoGen as the top frameworks. I've used all three. They're good for development. For production observability, they're insufficient out of the box. You need to instrument them yourself.
LangSmith from LangChain has the best production tracing I've seen. It's not perfect — the pricing gets aggressive at scale — but the feedback loop between traces and prompt refinement is real.
We tried Datadog APM. It showed us LLM calls as external HTTP requests. Useless. The latency breakdown looked like a black box. We ripped it out after two weeks.
Custom dashboard with Streamlit. This is embarrassing to admit, but our most useful observability tool is a Streamlit app that reads from our custom trace store. It shows:
- Agent success rate per goal type (not per API call)
- Tool selection distribution over time
- Reasoning length vs. outcome quality
- Human escalation rate (spikes here mean the agent is confused)
Agentic AI Frameworks: Top 10 Options in 2026 mentions 10 frameworks but doesn't discuss the operational cost of each. CrewAI, for example, is easy to start with but produces incredibly verbose logs that are hard to search in production. Semantic Kernel from Microsoft has better built-in tracing but ties you to Azure.
The Four Metrics That Matter
Forget uptime. Forget p99 latency. Here's what we actually watch.
Metric 1: Goal Completion Rate (GCR)
Did the agent achieve the user's goal within the allowed steps? Not "did it return 200 OK" but "did it actually solve the problem."
We calculate: successful_goal_completions / total_sessions
This is the only metric that matters. Everything else is a leading indicator.
Metric 2: Undetected Escalation Rate (UER)
When the agent gives up and routes to a human — but doesn't tell the human it failed. We found this in 12% of our early sessions. The agent would say "I've processed your request" to the user, then route silently to a human. The human had no context.
Fix: force explicit handoff logs.
Metric 3: Reasoning-Versus-Action Ratio (RAR)
python
# RAR calculation
reasoning_tokens = sum([step.reasoning_length for step in session.steps])
action_tokens = sum([step.action_length for step in session.steps])
rar = reasoning_tokens / max(action_tokens, 1)
# RAR > 5 means the agent is overthinking
# RAR < 0.5 means the agent is jumping to conclusions
We alert when RAR goes outside 0.5-5.0. It catches prompt drift and bad system messages.
Metric 4: Tool Call Surface Area (TCSA)
Number of distinct tools called per session, normalized by session complexity. An agent that calls 7 tools for a simple "get_balance" request is doing something wrong. An agent that calls only 1 tool for "analyze_user_behavior_across_5_systems" is probably hallucinating.
The Protocol Problem Nobody Talks About
There's a deeper issue. Agent protocols are still being figured out. A Survey of AI Agent Protocols catalogs 30+ protocols as of June 2026. MCP (Model Context Protocol) from Anthropic. ACP (Agent Communication Protocol) from Google. Each defines how agents discover tools, pass context, and handle errors.
Here's the problem: every protocol handles observability differently. MCP logs tool calls as structured events. ACP uses a message-passing model with implicit trace IDs. Open Agent Protocol doesn't define logging at all.
We standardized on MCP for new builds. Not because it's perfect — it's not. But because AI Agent Protocols: 10 Modern Standards points out that MCP has the most active community on GitHub. More eyes means faster bug fixes.
The trade-off: MCP's error handling is weak. If an agent crashes mid-conversation, the protocol doesn't define recovery. We built custom retry logic with exponential backoff and session state persistence.
What We Got Wrong
I'll be honest about our mistakes. There are four.
Mistake 1: We assumed agents would be deterministic. Same input → same output. They're not. Temperature settings, random seeds, even network latency affect which path the agent takes. We spent three months building regression tests that passed locally and failed in production because the LLM returned a different parsing of the same prompt.
Mistake 2: We over-instrumented the wrong things. Early on, we logged every token. Every LLM call. Every database query. 2GB of logs per hour. Finding a real problem was like searching for a needle in a haystack the size of a house. We cut logging by 80% and focused on decision points. Found more bugs.
Mistake 3: We trusted "success" responses. The agent would say "I completed the task" and we'd log success. But the task wasn't complete — the agent just thought it was. Now we verify with a separate check step that confirms the state change actually happened.
Mistake 4: We didn't plan for agent-to-agent communication. Our second deployment had two agents — one for data extraction, one for analysis. They talked to each other through a shared database. When the analysis agent got confused by a schema change, both agents started failing silently. No single agent knew it was broken. LangChain's blog on agent frameworks covers this combinatorial complexity well — but you have to live it to really get it.
Building Your Own Observability Stack
You don't need a vendor for this. Here's the minimum viable setup we use at SIVARO.
yaml
# docker-compose observability stack
version: '3.8'
services:
  # Event store for agent decisions
  clickhouse:
    image: clickhouse/clickhouse-server:latest
    environment:
      CLICKHOUSE_DB: agent_events

  # Structured log collector
  vector:
    image: timberio/vector:latest
    volumes:
      - ./vector.toml:/etc/vector/vector.toml

  # Simple evaluation agent (runs on separate GPU node)
  evaluator:
    build: ./evaluator
    environment:
      EVAL_MODEL: "gpt-4o-mini"
      TRACE_DB_HOST: clickhouse
    depends_on:
      - clickhouse
We write agent events to ClickHouse as JSON. Vector collects logs from the agent containers, enriches them with cluster metadata, and ships them to ClickHouse. The evaluator reads from ClickHouse, scores each session, and writes scores back.
Total cost: ~$400/month in infrastructure. Less than one vendor license.
FAQs
Q: How do I know if my agent is hallucinating in production?
A: You can't detect hallucinations reactively. You need proactive verification. Before the agent takes a destructive action, route the action through a verification step. We use a separate LLM call with a "grounding" prompt that checks the action against the user's stated goal. This catches most hallucinations.
Q: What's the biggest mistake companies make with AI agent monitoring?
A: Treating it like API monitoring. Standard metrics (latency, error rate, throughput) give you a false sense of safety. Your agent can be running perfectly and still failing at its actual job.
Q: Should I use a managed observability platform or build custom?
A: For the first 10k sessions, build custom. You'll learn what matters. After that, consider Datadog's LLM Observability or LangSmith. Both have matured significantly in early 2026.
Q: How do you handle agent-to-agent observability?
A: Shared trace IDs. Every agent in a system gets the same trace ID for a session. We log every inter-agent message with sender, receiver, intent, and outcome. This creates a dependency graph you can analyze.
Q: What's the single most important thing to log?
A: The agent's reasoning before it takes an action. Not just the action itself, not just the LLM response — the full chain-of-thought. This is what you'll need when you're debugging a failure at 2 AM.
Where We're Going
I said agents break differently. But they also work differently. The PayFlow story I opened with? We fixed it. The agent now processes 96% of onboarding flows without human intervention. Our observability stack caught the issue in shadow mode before it hit production — for a different customer last week.
The tools are getting better. AI Agent Frameworks from IBM lists 12 production-ready frameworks. Instaclustr shows 10. The ecosystem is maturing.
But the fundamentals won't change. You need ai agent observability production systems that track intent, not just execution. You need deployment pipelines that validate decisions, not just responses. And you need to accept that your agent will be wrong — the question is whether you'll know it.
I'm betting on agents being the primary interface for software within 18 months. The companies that nail observability first will win. The rest will be debugging hallucinations at 3 AM, wondering why everything looks fine while their customers are failing silently.
Nishaant Dixit — Founder of SIVARO. Building data infrastructure and production AI systems since 2018. Built systems processing 200K events/sec.