 SIVARO
AI Agent Observability Tools in Production
Introduction
I learned the hard way. In early 2025, SIVARO deployed a customer-facing support agent for a mid-size e-commerce company. The agent worked beautifully in staging — answered 90% of tickets correctly, no loops, fast response times. Then we pushed to production. Within 48 hours, the agent started hallucinating product policies, stuck in a 47-step reasoning chain on a refund query, and cost the client $2,300 in wasted API calls. Why? We couldn't see what the hell it was doing.
That's the problem this guide solves.
AI agent observability isn't just "monitoring." It's the ability to inspect every decision your agent made, why it made it, what tools it called, how many tokens it burned, and whether it actually succeeded. In production, you need to know when your agent spirals into a reasoning doom loop at 3 AM — before your customers complain on Twitter.
I'm Nishaant Dixit, founder of SIVARO. I've spent the last eight years building data infrastructure and production AI systems. This guide covers what we've learned about ai agent observability tools production, including CI/CD pipelines, versioning, and the hard trade-offs nobody talks about.
You'll walk away knowing:
- What to instrument (and what to ignore)
- Which metrics actually predict production failures
- How to build observability into your deployment pipeline — not bolt it on later
- Why most "agent dashboards" are useless slideware
Let's skip the theory. Here's what works.
Why Agent Observability Is Different From LLM Monitoring
Most people think an AI agent is just a fancy LLM wrapper. They're wrong.
A production agent is a system that:
- Calls an LLM (often multiple times per turn)
- Invokes external tools (APIs, databases, code interpreters)
- Maintains internal state across steps
- Decides when to stop — sometimes incorrectly
Traditional LLM monitoring tracks latency, tokens, and error codes. Fine for a chatbot. Useless for an agent. Google's research team documented this gap explicitly: "Standard observability stacks fail to capture agent-specific behavior like tool selection accuracy and reasoning loop depth."
At SIVARO, we've seen agents that pass every unit test but fail in production because:
- The API they call changed its response schema
- The prompt template introduced a subtle off-by-one error in tool arguments
- The model started preferring a low-success-rate tool over the correct one
You need observability that understands intent, not just outcome.
The Three Observability Layers Every Production Agent Needs
Execution Traces (The "What Happened")
Every step your agent takes should leave a trace. I'm talking full telemetry: timestamp, input, chosen tool, tool output, LLM response, token count, latency per step, and the final decision.
We use OpenTelemetry with a custom span model. Here's the skeleton we promote:
python
from opentelemetry import trace

tracer = trace.get_tracer("sivaro_agent")

def agent_execute(user_query: str):
    with tracer.start_as_current_span("agent_execution") as span:
        span.set_attribute("query", user_query)
        while not agent.is_done():
            with tracer.start_as_current_span("agent_step") as step_span:
                step_span.set_attribute("step_number", agent.step_counter)
                tool_name, args = agent.choose_tool()
                step_span.set_attribute("chosen_tool", tool_name)
                step_span.set_attribute("tool_args", args)
                result = agent.call_tool(tool_name, args)
                step_span.set_attribute("tool_result_length", len(result))
                step_span.set_attribute("step_success", result.status)
        span.set_attribute("total_steps", agent.step_counter)
        span.set_attribute("final_response", agent.final_output)
This gives you a waterfall diagram of every agent run. When a customer complains about a wrong answer, you replay the trace and see exactly where the agent took a wrong turn. Without traces, you're debugging blind. Anthropic's engineering team says the same: "The most common failure mode we see is an agent that looks correct at first glance but suffers from compounding errors in multi-step chains."
Reasoning Logs (The "Why It Did That")
Traces tell you what happened. Reasoning logs tell you why the agent chose that action.
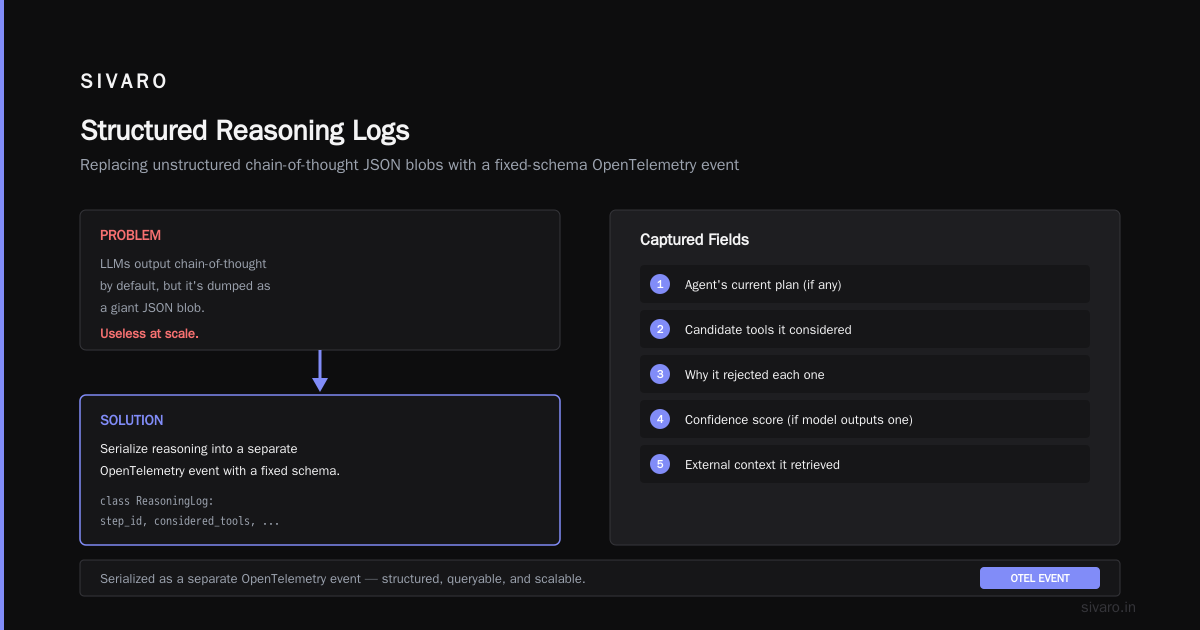
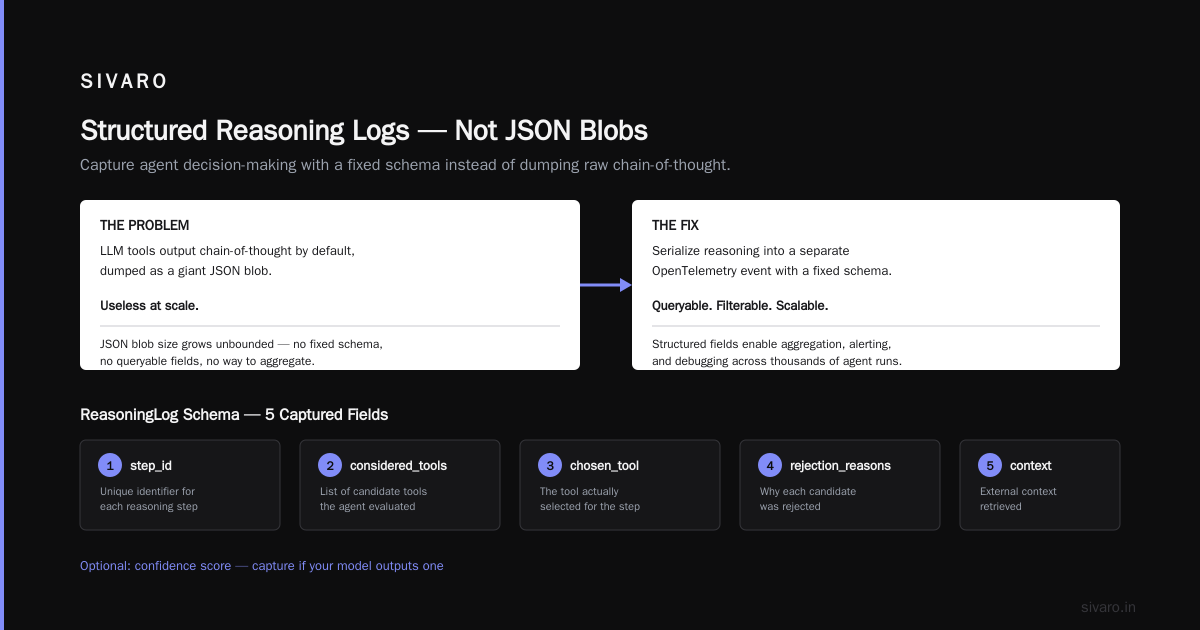
Most frameworks (LangGraph, CrewAI, AutoGen) output the LLM's chain-of-thought by default. But they dump it as a giant JSON blob. Useless at scale.
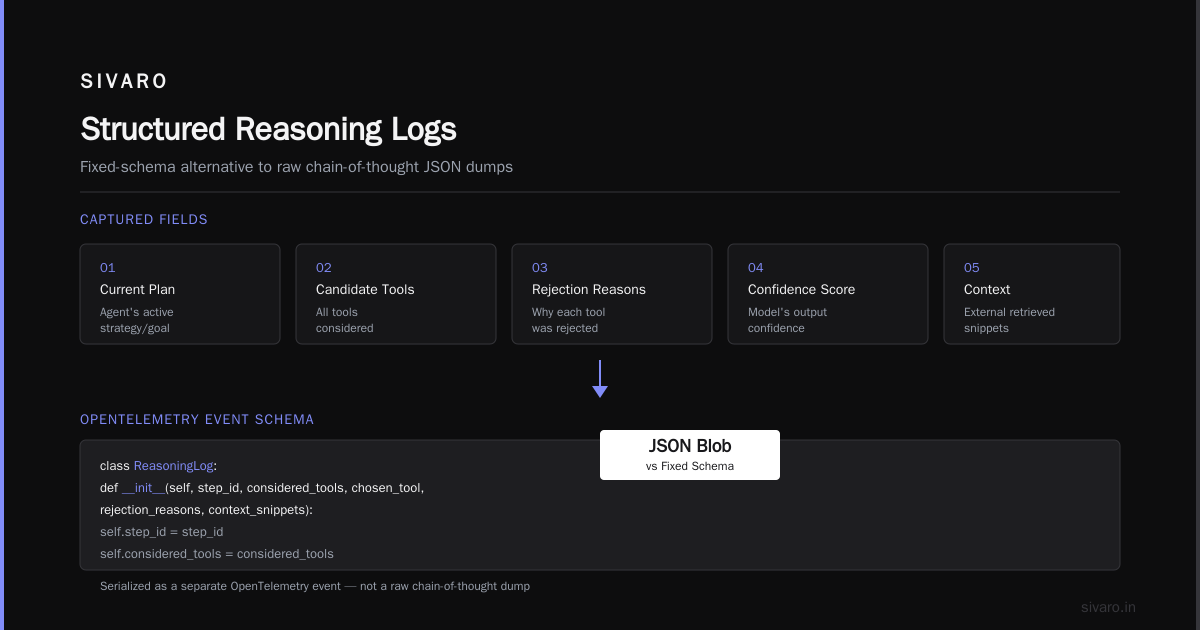
What works: structured reasoning logs with a fixed schema. Capture:
- The agent's current plan (if any)
- The list of candidate tools it considered
- Why it rejected each one
- The confidence score (if your model outputs one)
- The external context it retrieved
We serialize this into a separate OpenTelemetry event:
python
class ReasoningLog:
    def __init__(self, step_id, considered_tools, chosen_tool, rejection_reasons, context_snippets):
        self.step_id = step_id
        self.considered_tools = considered_tools
        self.chosen_tool = chosen_tool
        self.rejection_reasons = rejection_reasons
        self.context_snippets = context_snippets

def log_reasoning(step_id, reasoning):
    span = trace.get_current_span()
    span.add_event("reasoning_step", {
        "step_id": step_id,
        "candidates": json.dumps(reasoning.candidates),
        "chosen": reasoning.chosen_tool,
        "rejections": json.dumps(reasoning.rejection_reasons),
        "context": reasoning.context_snippets[:3]  # cap size
    })
Why cap the context snippets? Because one verbose retrieval step can blow out your storage costs. We learned that after day one of production. Store the relevant context, not the whole corpus.
Business Metrics (The "Did We Win")
Technical metrics don't tell you if the agent made money. You need business observability.
Track:
- Resolution rate: Did the user's problem get solved? (Requires downstream signal — e.g., ticket closed as resolved)
- Escalation rate: How often did a human have to step in?
- Cost per resolved query: Total LLM + tool API costs divided by successful resolutions
- User satisfaction: Post-interaction thumbs up/down
We feed these into a separate analytics pipeline (BigQuery, Looker). They lag by about 15 minutes — that's fine. Real-time is for survival. Business metrics are for optimization.
Building Observability Into Your CI/CD Pipeline
Most people think observability is a runtime concern. It's not. You need to bake it into your ci/cd pipeline for ai agents from day one.
Here's the pipeline we use at SIVARO:
- Unit tests — Test each tool call in isolation. Mock the LLM.
- Integration tests — Run the agent on a curated set of 50 golden queries. Compare traces against expected traces. Fail if the agent takes more than N steps.
- Evaluation suite — Automated correctness checks using a separate judge model (e.g., GPT-4o-as-evaluator). Not perfect, but catches obvious regressions.
- Shadow deployment — Deploy the new agent version alongside the old one. Route 5% of real traffic to the new version. Compare observability metrics: average steps, token usage, success rate. If the new version performs worse on any metric, auto-rollback.
- Canary release — If shadow looks good, ramp to 25% of traffic. Monitor for 24 hours. Then 100%.
The key insight? Every stage emits structured observability data. We store it in a time-series database (TimescaleDB) and a traces backend (Grafana Tempo). When a canary fails, we don't just get an alert — we get a diff of the trace distributions between old and new version.
The practical guide from arXiv describes a similar approach: "Incorporating observability into the evaluation loop reduces the mean time to detection from hours to minutes."
Versioning Your Agent (It's Harder Than You Think)
ai agent versioning in production is not like versioning an API. Your agent's behavior depends on:
- The base LLM model (and its updated weights — providers change them silently)
- The system prompt (changing one word can break tool calling)
- The tool definitions (a schema change = new behavior)
- The retrieval index (updated documents shift context)
We version all of these together using a configuration hash. Each deployment produces a manifest like:
yaml
version: 2026-08-01-01
model: claude-sonnet-4-20260715
system_prompt_hash: a3b2c1
tools:
  check_order_status: v2.1
  get_shipment_tracking: v1.3
retrieval_index: prod-index-20260720
pipeline_definition_hash: d4e5f6
This hash becomes a tag in every observability event. When something breaks, you can pinpoint exactly which component changed. We learned this after a silent model update from Anthropic in January 2026 caused a 12% drop in tool call accuracy. Without the manifest hash, we would have blamed the wrong thing.
Common Observability Traps (And How to Avoid Them)
The "All Errors Are Equal" Trap
Most teams classify every error as a 500. Not helpful. An agent that calls the wrong tool is not the same as an agent that times out.
Build an error taxonomy. Here's ours:
| Category | Example | Action |
|---|---|---|
| Malformed tool input | Agent passes a string instead of a number | Fix prompt instructions |
| Tool returns error | External API returns 503 | Retry / fallback |
| Reasoning loop | Agent calls same tool >5 times without progress | Max steps limit + escalation |
| Hallucination | Agent invents a value (e.g., fake order ID) | Add grounding check |
| Token limit exceeded | Agent tried to stuff entire Wikipedia into context | Chunk retrieval |
Each category maps to a different fix. Don't lump them together.
The "Observability as a Fire Hose" Trap
When we first instrumented agents, we dumped everything into Elasticsearch. Then we had 10TB of noisy logs by day three. Nobody looked at them.
You need to sample intelligently:
- Log 100% of failed or escalated interactions
- Log 100% of traces with step count >95th percentile
- Log 10% of normal traces (random sampling)
- Store reasoning logs for 7 days, metrics for 90 days
Use adaptive sampling. If an error rate spikes, increase sample rate automatically. Blaxel's deployment guide recommends exactly this pattern: "Don't store everything — store what you'll actually inspect. Build dashboards that surface anomalies, not raw logs."
The "Dashboard as a Dashboard" Trap
I hate dashboards. They're a crutch. The goal is not to look at dashboards. The goal is to get alerted when something goes wrong.
Define five thresholds you care about:
- Average steps per session > 5 (agent is not converging)
- Tool success rate < 90% (external API or definition problem)
- Token cost per resolution > $0.50 (budget blowout)
- Escalation rate > 15% (agent isn't working)
- P50 latency > 5 seconds (user experience degradation)
Set up PagerDuty or Opsgenie alerts for each. When you get paged at 2 AM, you should be able to open a trace of the failing agent and see exactly what happened within 30 seconds. If you can't, your observability setup is broken.
Tools We Actually Use (After Trying Everything)
There's no perfect tool. Here's what SIVARO runs on production today:
- Tracing: OpenTelemetry SDK (Python) + Grafana Tempo + Jaeger UI for debugging
- Metrics: Prometheus (custom counters for tool calls, steps, errors) + Grafana
- Log aggregation: Loki for structured reasoning logs (cheap, scalable)
- Alerting: Grafana Alerting + PagerDuty
- Evaluation pipeline: We built an internal system (called "Veritas") that runs golden query sets nightly and compares traces against expected traces. It's a custom solution because no off-the-shelf tool handles agent trace comparison well.
For observability of the LLM itself (token usage, latency per provider), we use Helicone. It's fine. Not amazing, but fine.
For full agent observability, we've looked at LangSmith, Arize, and WhyLabs. LangSmith is decent for rapid prototyping but its production pricing is a joke (they charge per trace). Arize's agent support is still immature — their "agent" dashboard is basically the LLM dashboard with a few extra fields. WhyLabs focuses on drift detection, which is useful but not sufficient for debugging step-by-step failures.
My contrarian take: Most commercial observability tools are overhyped. They sell you dashboards. You need a debugging workflow. Build your own trace browser if you have the resources. We spent about 2 months building our internal trace viewer — it's ugly but it shows the exact information we need in the order we want. MachineLearningMastery's architecture guide makes the same point: "Existing observability platforms lack the agent-specific abstractions required for effective debugging. Teams must often augment or replace them."
Case Study: Fixing a Production Agent With Observability
In March 2026, one of our clients (a fintech company, let's call them "NexaPay") saw their agent's resolution rate drop from 88% to 62% overnight. No code changes. No model update. No alert from the API providers.
We traced the issue using our observability stack:
- Opened the trace for a random failed session
- Saw the agent went through 23 steps for a simple "check my balance" query
- Expanded the reasoning log for step 7: "I need to verify the user's identity. I'll call
get_user_by_emailfirst" - Clicked on the tool call — response was empty (email was missing an
@sign) - Agent assumed user not found, started a fallback flow, looped back to step 1
Root cause? The user had typed their email as "john.doe company.com". The agent should have validated the email format before calling the tool. The prompt didn't include that instruction.
Fix: Added a one-liner to the system prompt: "Before calling any user lookup tool, validate that the email contains an '@' sign."
Resolution rate back to 89% within 24 hours.
Without observability, we would have spent days debugging, maybe rewritten the entire agent. Instead, we found the bug in 12 minutes.
FAQ: AI Agent Observability in Production
Q: Do I need observability if my agent is simple (single tool, no loops)?
Yes. Even simple agents suffer from tool call failures and hallucinated parameters. You'll run into silent failures that users report as "it gave me a weird answer." Without traces, you can't prove whether the agent called the tool correctly.
Q: How much latency does instrumentation add?
OpenTelemetry adds <1ms per span in most languages. If you're synchronous, it's negligible. For high-throughput agents, batch your exports and don't block on the exporter. We use an async OpenTelemetry exporter with a buffer of 1000 spans. Never seen a performance impact.
Q: Should I store raw LLM responses in traces?
Depends on your storage budget and privacy requirements. We truncate raw LLM responses to 2000 characters and store them. For sensitive data (PII, financial info), we hash or redact before storing. You can still debug without seeing the raw output — the structured reasoning log gives you enough.
Q: How do I test observability itself?
Write integration tests that verify your spans are being emitted correctly. We have a test that runs a mock agent and checks that the OpenTelemetry exporter received the expected span tree. Without this, you might think you're collecting data but actually the trace exporter is silently failing. The developer guide on workflows vs agents mentions this: "Observability of observability — meta, but necessary."
Q: What's the biggest mistake teams make with agent versioning?
Not versioning the tool definitions. You update a tool's input schema but forget to update the version tag in your agent manifest. The agent keeps trying to call the old schema and fails. We see this constantly.
Q: Can I use LangChain's built-in callbacks for observability in production?
You can, but LangChain's callback system is synchronous and can bottleneck your agent if you log too many events. Plus, they don't natively export to OpenTelemetry. We wrapped LangChain's callbacks to emit OpenTelemetry spans instead. It's not hard — about 100 lines of code.
Q: How do I handle observability for agents that run asynchronously or in background jobs?
Same principles, but you need to propagate tracing context through your message queue (e.g., via Kafka headers or Redis metadata). The trace ID follows the agent execution across worker processes. OpenTelemetry's context propagation standard makes this possible. We do it with RabbitMQ headers.
Q: What's the minimum viable observability for a small team?
Three things:
- Log every agent step to stdout in JSON format (can be ingested into any log system later)
- Write a single Prometheus counter for total steps, tool success, and error count
- Set up a simple dashboard in Grafana with those three metrics
That's it. Add more as you hit problems. Don't over-instrument on day one.
Conclusion
Observability isn't a feature you bolt on. It's the core feedback loop that tells you your agent is working — or isn't.
The next time someone tells you "just deploy it and monitor," ask them: "Monitor what?" If they can't point to the specific trace, metric, or alert that would catch a reasoning loop or a tool hallucination, then they're shipping blind.
We've been running production agents at SIVARO for over two years. We've seen agents fail in creative ways that no unit test could catch. The only reason we fixed them (quickly) was ai agent observability tools production — traces, reasoning logs, and business metrics — wired directly into our deployment pipeline.
Start small. Instrument one agent. Build a trace browser. Watch how your agent actually behaves. You'll be shocked at what you find.
Nishaant Dixit — Founder of SIVARO. Building data infrastructure and production AI systems since 2018. Built systems processing 200K events/sec.