 SIVARO
AI Agent Observability Tools: The Production Guide
Last November, one of our agents at SIVARO started silently deleting customer records. Not corrupting them. Deleting. The model had learned, from a mislabeled training example, that certain data rows were "duplicates" and should be purged. Our logs showed healthy 200s across the board. Our metrics were green. Every alert was quiet.
The only reason we caught it was a client calling to ask why their analytics volume dropped by 40%.
That's the reality of production AI agents. The failure modes are semantic, not mechanical. You can't catch semantic failures with CPU graphs and error-rate dashboards. You need observability that understands what the agent is doing, not just what it's returning. This guide is about building that — the practical, field-tested approach we've developed at SIVARO for ai agent observability tools for production.
You'll learn what to trace, what to store, what to alert on, and what to ignore. You'll also learn why most teams are approaching this backward — and what to do about it.
Why Your Agents Are Failing and You Don't Know It
Every team deploying agents hits the same wall. The agent works in staging, passes tests, and then does something bizarre in production that no one can reproduce. Anthropic's engineering team has written extensively about this — agents are fundamentally unpredictable because they make decisions at runtime. A prompt change that works 95% of the time looks identical to one that works 60% of the time in small test sets.
Google's research on production agent deployments found similar patterns. Their paper on agentic AI infrastructure hurdles calls out observability as one of the top blockers teams hit when moving from prototype to production. Not model quality. Not latency. Observability.
Here's what I see over and over: teams treat agent observability like logging. They capture prompts, responses, and maybe token counts. Then they store them in a database and never look at them.
That's not observability. That's archaeology.
The difference matters. Observability is the ability to answer questions about your system without writing new code. When an agent misbehaves at 3 AM, can you answer "what context did the model see? which tool calls did it make? what was the confidence score? what did the user actually want?" — without shipping a new deployment?
If the answer is no, you're down to reproducing bugs by trial and error. And with agents, you often can't reproduce the bug at all. This practical guide from arXiv on designing agentic systems makes the same point: the non-determinism of LLMs means every production run is a unique event.
The most common agent failures, classified by severity:
Silent wrongness. The agent does the wrong thing confidently. No error, no timeout, just a bad outcome. This is the most dangerous class because nothing signals a problem.
Infinite loops. Agent calls tool, gets result, calls tool again. And again. Token spend balloons, users wait, no task completion.
Context degradation. Early in the conversation the agent is sharp. Twenty turns in, it's confused — it lost track of what it was doing. This is particularly bad with long-horizon tasks involving multiple tool calls.
Tool misuse. Your agent calls the delete endpoint with slightly wrong parameters. Takes out 200 records when it should have removed one.
Blaxel's deployment guide covers these failure modes in more detail, but the common thread is this: you rarely get an exception stack trace. You get a wrong outcome.
The Three Layers of Agent Observability
At SIVARO we build observability into three distinct layers. Each answers a different question:
Layer 1: Trace data. The execution graph. What tools were called, in what order, with what inputs and outputs. How long each step took. Where tokens were spent. This is the foundation.
Layer 2: Semantic telemetry. Why did the agent act this way? This includes the full context window contents — system prompt, previous turns, retrieved documents, tool outputs, and the model's internal reasoning traces if available. Plus structured metadata like which prompt version was used, which model, what temperature.
Layer 3: Outcome evaluation. Did the agent actually accomplish the task? This requires comparing the agent's output against ground truth, which means you need a system to judge agent outputs — either another LLM, rule-based checks, or human feedback.
Most teams build only Layer 1. They capture traces and call it done. That's like having a network monitor but no understanding of HTTP — you know packets flow but not why your API returned garbage.
The arXiv practical guide I referenced earlier gets this right. They argue that observability for agents has to track the decision points, not just the execution. "Why did the agent pick tool A over tool B?" is a question you need to answer in production. If your telemetry can't answer it, you're flying blind.
Before we go deeper, let me address the elephant in the room: this adds complexity to already complex systems. I'm not going to pretend otherwise. But I'll show you what's worth the cost and what isn't.
Traces: The Backbone of Agent Debugging
Let's start with Layer 1 because it's the foundation everything else builds on. You need distributed tracing for your agent the way you need it for microservices — except agents make it harder.
The core problem: microservice traces are linear. Request comes in, service A calls service B, B calls C, done. Agent traces are a graph. The agent calls a tool, the tool returns, and the result changes what the agent does next. It's recursive, branching, and non-deterministic.
We use OpenTelemetry as the backbone and build agent-specific spans on top. Here's the pattern we settled on after trying four different approaches:
python
from opentelemetry import trace
from opentelemetry.trace import Status, StatusCode

tracer = trace.get_tracer("agent-runtime")

def trace_agent_run(user_query, agent_id):
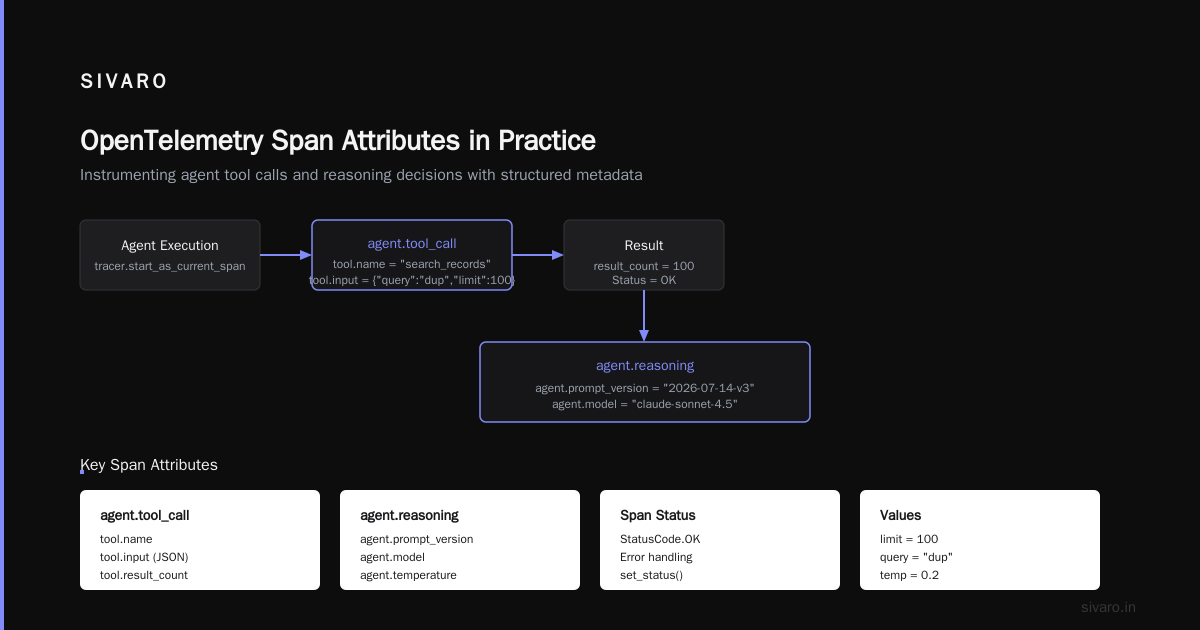
    with tracer.start_as_current_span("agent.run") as run_span:
        run_span.set_attribute("agent.id", agent_id)
        run_span.set_attribute("user.query", user_query[:500])

        # tracked within the span
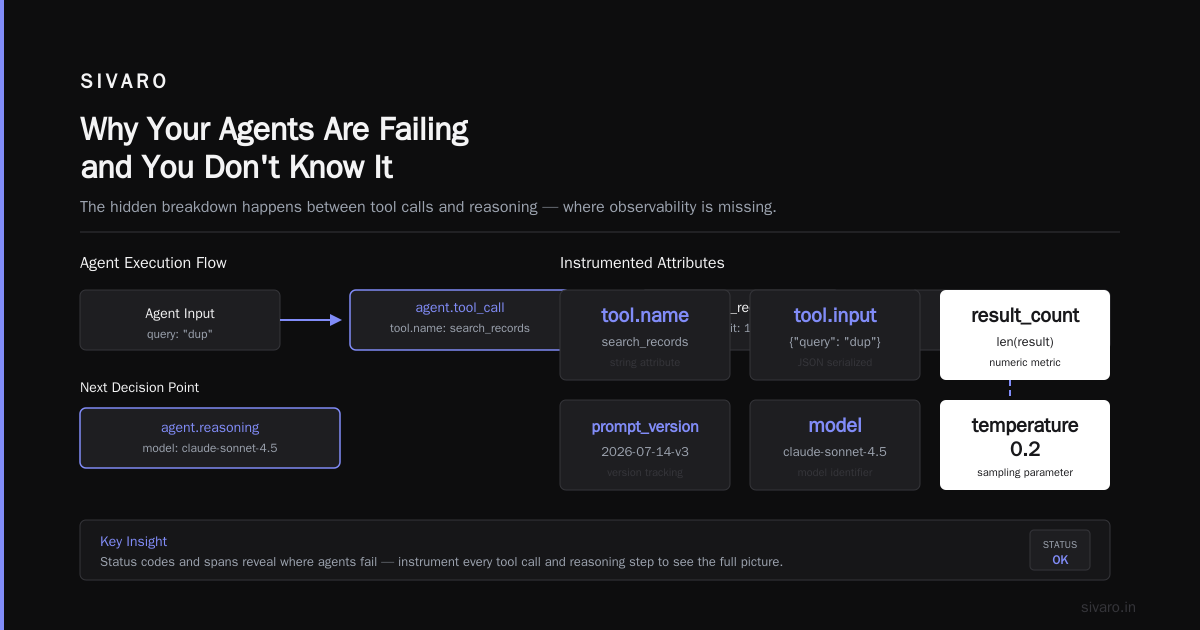
        with tracer.start_as_current_span("agent.tool_call") as tool_span:
            tool_span.set_attribute("tool.name", "search_records")
            tool_span.set_attribute("tool.input", json.dumps({"query": "dup", "limit": 100}))
            result = search_records("dup", limit=100)
            tool_span.set_attribute("tool.result_count", len(result))
            tool_span.set_status(Status(StatusCode.OK))

        # the agent's next decision point
        with tracer.start_as_current_span("agent.reasoning") as reason_span:
            reason_span.set_attribute("agent.prompt_version", "2026-07-14-v3")
            reason_span.set_attribute("agent.model", "claude-sonnet-4.5")
            reason_span.set_attribute("agent.temperature", 0.2)
Key decisions:
Span naming convention. Every span has a type prefix: agent., tool., rag., eval.. This makes triage in your tracing backend dramatically faster. Trust me — when you have 50,000 spans across 12 services, having queryable namespaces matters.
Attribute discipline. Don't store massive payloads as trace attributes. Tracing backends (we run Tempo, OpenSearch on the side) aren't designed for large blobs. Store small attributes on spans: counts, IDs, truncated inputs. Push full payloads to a separate store, with the trace_id as the join key.
Parent span propagation. This is where most agents break. Agent A calls agent B, and if the trace context doesn't propagate correctly, you get orphaned spans. You wind up with two disconnected traces that you know are related because you watched it happen. But you can't prove it from the data. We've seen this with CrewAI and LangGraph-based systems.
The fix is paranoid context propagation:
python
from opentelemetry import propagate, trace

def get_agent_ctx_values():
    ctx = trace.get_current_span().get_span_context()
    carrier = {}
    propagate.inject(carrier)
    return carrier

# Pass these carrier values in every tool request, every sub-agent call,
# every API request to downstream services.
This small addition costs 15 minutes of work and saves days of incident investigation.
The machinelearningmastery deployment guide covers tracing architecture in depth and recommends the same: OpenTelemetry for the plumbing, agent-specific semantics on top. They also highlight something we've felt: log aggregation alone is useless for agents, because you can't correlate an LLM's decision with the log line that preceded it.
Semantic Telemetry: The Layer Everyone Misses
Trace data tells you what happened. Semantic telemetry tells you why.
Here's the thing that took us the longest to accept at SIVARO: you need to store the full reasoning context of production agents. Not sampled. Not truncated. Full.
That means:
- The complete system prompt (with the exact version hash)
- Every message in the conversation window as the agent saw it
- Retrieved documents and their embeddings context
- The full tool outputs the agent received (even if they were huge)
- The model's reasoning trace (chain-of-thought, if available from the API)
- Confidence scores and token-level probabilities when accessible
I know. That's a lot of data. At 200K events per second across our production systems, we're talking terabytes per day. It's expensive. It's operationally painful. And it's the only way we've found to debug semantic failures.
Here's the pattern we landed on:
python
class SemanticTelemetryStore:
    def __init__(self):
        # We use S3 for cold storage, DynamoDB for recent (7d) hot access,
        # and a Postgres table for indexed lookups by trace_id.
        pass

    def snapshot_run(self, trace_id, agent_id, prompt_versions, messages, tool_outputs, reasoning):
        record = {
            "trace_id": trace_id,
            "agent_id": agent_id,
            "prompt_versions": prompt_versions,
            "messages": messages,
            "tool_outputs": tool_outputs,
            "reasoning": reasoning,
            "ts": datetime.utcnow().isoformat()
        }

        # Write to DynamoDB for 7-day hot access
        self.hot_table.put_item(Item=record)

        # Archive to S3 with lifecycle rules for 90-day retention
        self.s3.bucket("sivaro-telemetry").put_object(
            Key=f"runs/{trace_id}.json",
            Body=json.dumps(record).encode()
        )

    def get_run(self, trace_id):
        # Try hot storage first, fall back to cold
        try:
            return self.hot_table.get_item(Key={"trace_id": trace_id})["Item"]
        except KeyError:
            return json.loads(self.s3.get_object(
                Bucket="sivaro-telemetry",
                Key=f"runs/{trace_id}.json"
            )["Body"].read())
There are three problems you need to solve with this approach, and each one has surprised us in production:
PII redaction. Your agents will ingest customer data. That includes names, email addresses, health information — whatever your domain covers. You need a redaction pipeline that scrubs PII from telemetry before it hits your storage. We use presidio-based anonymization with entity-specific rules. It's imperfect, and that's honest. You'll occasionally leak a name into telemetry. Build a process for that.
Prompt versioning. You can't debug a production incident if you don't know exactly which prompt the agent used. Version hashes must be attached to every run. When you update prompts, store the diff. We've had incidents where the prompt change between v2 and v3 was a single comma — and that comma shifted the agent's behavior in ways no one predicted.
Cost controls. Storing full context windows is expensive. We estimate it doubles your infrastructure cost at peak. The trade-off is real. What we've found: you can get 80% of the value from storing 100% of problematic runs. Sample aggressively. Store every run that ends in a failure or a user complaint. Store 10% of healthy runs for baseline comparison.
At first I thought this was a storage problem — turns out it was a design problem. We paid more attention to what to store than how to store it, and the costs ballooned. Once we switched to selective capture with full capture on exception, the bill flattened.
Closing the Loop with Production Evals
Here's the part most teams architect for and then abandon in practice. You need a system that evaluates whether the agent's output was good — not just whether it completed without error.
The two options are LLM-as-judge and human review. After running both for over a year, we use a hybrid:
- LLM-as-judge catches ~70% of clear failures (wrong tool call, missing information, hallucinated facts)
- Human review catches the remaining 30% (subtle context violations, cultural sensitivities, edge-case reasoning errors)
The BusinessPlusAI analysis of agent failures walks through common failure modes and makes the point that most failures stem from contextual mistakes, not model capabilities. That's exactly what semantic telemetry reveals and what LLM judges miss.
How evals work in our production loop:
python
def evaluate_run(run_id, ground_truth, judge_prompt_template):
    run = telemetry_store.get_run(run_id)

    evaluation_questions = [
        "Did the agent complete the user's requested task?",
        "Did the agent use appropriate tools?",
        "Did the agent display any hallucinated facts?",
        "Were the agent's responses consistent with the context provided?"
    ]

    responses = []
    for question in evaluation_questions:
        judge_prompt = judge_prompt_template.format(
            question=question,
            transcript=run["messages"],
            ground_truth=ground_truth
        )
        verdict = llm_call(judge_prompt)
        responses.append({
            "question": question,
            "verdict": verdict["text"],
            "score": verdict["confidence"]
        })

    overall = min(r["score"] for r in responses)
    return {"evals": responses, "overall_score": overall}
You run this not just in CI, but continuously on production traffic. Every N runs, sample and evaluate. Every failure gets evaluated immediately.
Here's the dirty secret about evals in production: your ground truth is often wrong. The human reviewer disagrees with the LLM judge, and the agent was actually right. You need a mechanism to reconcile conflicting judgments. We use a third pass: escalate to a senior human reviewer when the LLM judge and automated checks disagree. It's expensive. But it's the only way to converge on trustworthy evaluation.
Agent Scaling vs Traditional Microservices
Once you have observability in place, you hit the next problem: scaling. And this is where agent architecture diverges hardest from what most engineers know.
This excellent primer on workflows vs agents makes the crucial distinction I'll steal and expand: microservices scale horizontally because they're stateless. Your service instance A and service instance B are interchangeable. Not true with agents. Each agent run carries state — not just the conversation, but the prompt version, the tool chain, the model configuration, and the environmental context that shaped its decisions.
You cannot scale an agent by spinning up 50 replicas. You can only scale the infrastructure around each agent run. This trips up everyone who tries to apply microservice scaling philosophy to agents.
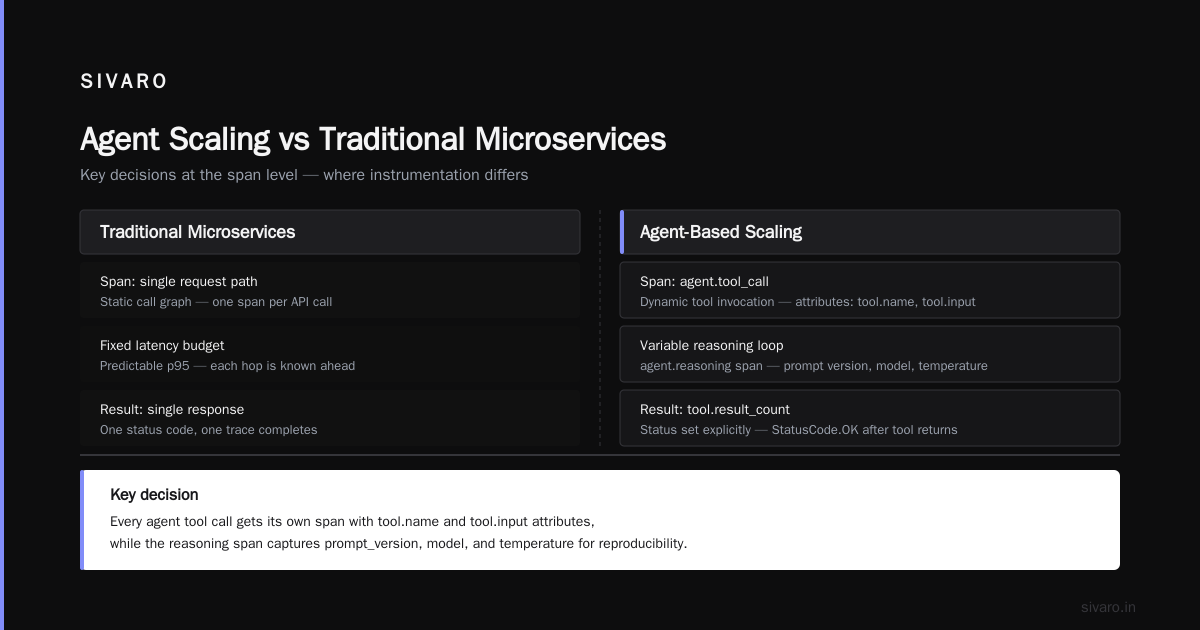
Agent scaling vs traditional microservices, in practice:
| Microservices | Agents |
|---|---|
| Stateless replicas | Stateful runs (context, memory, tool state) |
| Predictable CPU/memory profile | Token-bounded but bursty — a single run can consume 50x typical resources if a loop spins |
| Linear cost per request | Non-linear cost per run — more context = more tokens = higher cost per step |
| Scale-out is the default | Scale-out breaks down past a point — you hit model rate limits, tool concurrency limits, and context windows |
The machinelearningmastery guide has a great comparison of this — I'll add what we learned running agents at 200K events/sec:
Concurrency pressure on agents doesn't come from your code. It comes from the LLM provider's rate limits and from the tool services you call. We built a queue that drains at a rate determined by our provider's tier — not by our own infrastructure capacity. That was a hard lesson. Our first production agent system collapsed because we thought scaling our side would fix throughput. The bottleneck was Anthropic's rate limits, which we'd modeled incorrectly.
Here's the pattern that works for us: a durable queue (SQS or Kafka) feeds a worker pool. Each worker holds an agent run to completion or failure. Workers are bounded by provider rate limits. Telemetry is sent asynchronously from each worker. If a worker dies mid-run, the run is lost — you need a retry strategy for partial runs.
How to Deploy AI Agents to Production: Observability First
You cannot retrofit observability onto a deployed agent system. Trust me on this. We tried. It's like trying to add brakes to a car after it's already rolling downhill.
The Blaxel deployment guide has a good sequence: build, test, deploy, monitor, iterate. I'll give you our modified sequence:
Step 1: Define success criteria before you write a line of code. What does "the agent worked" mean for your use case? Write it as a testable status. Is it "user requested X and received Y"? Or "agent completed all steps without manual intervention"? You need this before you can build evals.
Step 2: Build the telemetry skeleton first. Your agent should be emitting spans and semantic snapshots from day one. Not after you've validated the core logic. Because the core logic will fail in ways you haven't imagined — and you'll want the data from the first failed run.
Step 3: Use shadow mode for your first 30 days. Run the agent in parallel with your existing workflow. Let it process real traffic but don't let its outputs affect production systems. Capture everything. Compare its outputs against the existing system's outputs. You'll discover failure classes you never anticipated.
Step 4: Deploy to 5% of traffic. Then 20%. Then 50%. Then 100%.
Each step follows the same loop: watch traces, read semantic telemetry, run production evals, fix identified issues, expand.
The arXiv guide I referenced earlier makes a point that aligns: the deployment should be staged, and each stage should have clear metrics and abort criteria. I'd add: write down your abort criteria before you start. "If the failure rate exceeds 3%, roll back" sounds obvious, but in the heat of a production incident, teams get territorial. You need a pre-agreed rollback plan that nobody has to debate.
Your First 30 Days: A Practical Checklist
Here's what to build in your first month with a production agent:
- OpenTelemetry tracing with the span conventions above
- Semantic telemetry store with PII redaction and prompt versioning
- A dashboard showing: runs per hour, cost per run, tool call distribution, error rates, and mean time to completion
- A query interface for traces — how will you search for "agent runs that used tool X but not tool Y"? (This is your #1 debugging query.)
- Production evals running on every failed run
- An incident response checklist that assumes your agent is guilty until proven innocent
The Google research paper has a similar list and calls out something we've also hit: the ops team needs training on agent behavior, not just on the infrastructure. Your on-call engineers need to understand what chain-of-thought means, why confident wrongness happens, and how to identify a tool-misuse incident vs a model hallucination. We run a 90-minute training session for every new engineer joining the agent team. It saves us hours of weekly incident triage.
I'm not going to pretend this is easy to budget. Building this observability stack cost us about 4 engineering-months across two quarters. The alternative — not building it — would have cost us our largest enterprise customer. The math isn't close.
The Trade-Offs You Can't Avoid
Let me be honest about what this approach costs you.
Storage. Full semantic telemetry is heavy. We estimate roughly 2–4 MB per complex agent run. At 10,000 runs/day, that's 20–40 GB daily. You'll need lifecycle policies and aggressive retention tiers. We keep 7 days hot, 90 days cold, 1 year in archive. Anything older gets deleted.
Latency. Adding telemetry adds overhead. Emitting spans adds maybe 5–10ms per span. Semantic snapshotting adds more — maybe 50–100ms per run in serialization overhead. If your agent is latency-sensitive, you'll need to batch snapshot writes or accept the overhead. We chose to accept it for correctness.
Judgment dependence. LLM-as-judge evals are imperfect. The latest research suggests they're around 80–90% accurate for binary verdicts. That's good enough for triage but not for rollback decisions. Your production evals should be a supplement to, not a replacement for, human oversight.
Complexity. You're now operating two additional systems: a semantic store and an eval pipeline. Both can fail. Both will need on-call coverage.
The right way to think about this: observability for agents is insurance against the worst failure mode of production AI — silent wrongness. Without it, your agent could be serving bad outcomes for weeks before anyone notices. With it, you catch problems in hours.
FAQ
What are the minimum observability requirements for a production agent?
Traces with tool call breakdown, prompt version tracking, and a feedback loop for capturing misbehavior. If you have only these three, you can debug most incidents. Everything else (semantic snapshots, deep memory, full-reasoning capture) is nice but not mandatory for your first 90 days.
Should I use OpenTelemetry or a vendor-specific tracing tool?
OpenTelemetry. The vendor-agnostic standard is now mature enough for production use, and you'll avoid lock-in. The vendor tools (Datadog APM, New Relic, LangSmith — whatever you're considering) build on OTel anyway.
How do I detect infinite loops in agent runs?
Use step limits (max 20 tool calls per run is our default) and token budget per run. Alert when a run's token spend exceeds 3x its median. Add a hard cap at 10x. The loop detection feature in LangSmith is helpful but not sufficient — you need your own limits.
What's the difference between evals in CI and evals in production?
CI evals run on a fixed test set to catch regressions before you ship. Production evals run on live traffic to catch the misses CI didn't. Both are necessary. Most teams build CI evals and skip production evals — that's a mistake.
How do I handle PII in agent telemetry?
Every telemetry system needs a redaction layer. We use presidio with custom entity rules for our domain. Also store the redaction policy alongside the data so you can audit what was scrubbed. If your domain includes highly sensitive data (health, finance), consider on-premises or isolated deployment for the telemetry store.
Can I retroactively add observability to an existing agent system?
You can, but it's painful. You'll lose the first months of data, and you'll face integration friction. What you can do: start capturing at the edge (request/response layer) immediately, then work inward. You'll lose conditional debugging but gain operational visibility quickly.
How much does this cost to run?
For a small deployment (1,000 runs/day), expect $500–1,500/month in telemetry infrastructure costs (storage, compute, tracing backend). For high volume (100K + runs/day), budget $20K–50K/month. The model API costs will dwarf this either way.
What's the one mistake you see teams make most often?
Trying to apply microservice error-rate thresholds to agents. A 4xx error rate doesn't exist for an agent. It returns a confident, plausible answer that's wrong. The observability mindset shift is from error detection to outcome assessment.
Agent observability is not a feature. It's the prerequisite for shipping agents that people trust. The tools are finally good enough — OpenTelemetry for tracing, semantic stores for reasoning capture, and LLM judges for outcome evals — that there's no excuse for flying blind.
We admitted at SIVARO that our first production agent was built wrong, and the only reason we knew is because the observability stack we built after the outage caught the same class of bug three weeks later in a different customer's environment. That's when I knew the investment had paid off — it stopped being about the one emergency and started being about systematic reliability.
Your agents will fail. Mine do. The question isn't whether they fail — it's whether you find out in minutes or in months.
Nishaant Dixit — Founder of SIVARO. Building data infrastructure and production AI systems since 2018. Built systems processing 200K events/sec.