 SIVARO
AI Agent Observability: What Actually Works in Production
I've been building production AI systems at SIVARO since 2018. We process 200K events per second. I've seen agentic systems go from demos that wow investors to production nightmares that wake you up at 3 AM.
The problem isn't building agents. It's knowing what the hell they're doing when they run.
Most people think observability means slapping Langfuse or LangSmith on top and calling it done. They're wrong. Those tools are great for debugging a single chain. They fall apart when you need to understand why a multi-agent loop spent 45 minutes calling an API that returned the same error 400 times.
I wrote this guide because I couldn't find one that told me the truth. Here it is.
What Makes Agent Observability Different From Regular Monitoring
Traditional monitoring answers "is it up?" You check CPU, memory, latency, error rates. Done.
Agent observability answers "what is it doing and why?" That's fundamentally different because agents make decisions. They call tools. They loop. They hallucinate. They get stuck in infinite loops trying to find a flight that doesn't exist.
At SIVARO, we learned this the hard way. We deployed a customer support agent for a mid-sized e-commerce company in early 2025. The agent was supposed to handle refund requests. It worked perfectly in staging. In production, it started issuing refunds for orders that were already processed — because the LLM decided that "customers are always right" outweighed the business logic we'd coded.
Standard monitoring caught zero of this. The API calls returned 200s. The latency was fine. The agent was "working." It was also costing the client $12,000 per week in fraudulent refunds.
That's when I realized: we don't need more metrics. We need observability that captures the reasoning trace.
Building Effective AI Agents from Anthropic covers this well — they emphasize tracing as the core primitive. I'd add: you need to trace at the intent level, not just the call level.
The Four Pillars of Agent Observability (The Ones That Matter)
After years of trial, error, and a few near-death production experiences, I've settled on four things you absolutely must monitor. Everything else is noise.
1. Step-by-Step Trace with Semantic Context
You need every action recorded: which LLM call, what prompt, what temperature, what tool was called, what the tool returned, what the LLM decided next. But raw logs are useless. You need the semantic context.
Here's what we do at SIVARO. Every agent step generates a structured event:
python
{
  "agent_id": "customer-support-v7",
  "session_id": "sess_89f23a",
  "step_number": 12,
  "llm_call": {
    "model": "claude-3.5-sonnet",
    "temperature": 0.2,
    "prompt_truncated": "User asked about refund...",
    "response": "I'll check order status using get_order tool"
  },
  "tool_call": {
    "name": "get_order",
    "arguments": {"order_id": "ORD-8821"},
    "result_success": True,
    "result_summary": "Order status: delivered, no return request found"
  },
  "agent_decision": "Escalate to human because refund not applicable",
  "duration_ms": 3421,
  "cost_usd": 0.008
}
This format lets you answer: "Show me all sessions where the agent took more than 10 steps but ended with an escalation." That query saved us three days of debugging last month.
How to Deploy AI Agents to Production: A Complete Guide suggests logging every LLM response verbatim. I disagree — that inflates storage costs 10x. Summarize the response. Keep the raw only when you need to debug a specific hallucination.
2. Loops and Repeats Detection
Agents loop. It's their nature. The question is: when is a loop productive (refining a search) versus pathological (calling the same API with the same arguments)?
We built a simple heuristic: if the agent calls the same tool with identical arguments three times in a row, flag it. But that's naive. The better approach is embedding-based similarity on tool inputs.
python
def detect_repeat_loop(session_events, similarity_threshold=0.95):
    recent_calls = []
    for event in session_events:
        if event['type'] == 'tool_call':
            call_signature = f"{event['tool_name']}:{event['arguments']}"
            recent_calls.append(call_signature)
            if len(recent_calls) > 5:
                recent_calls.pop(0)
            # cosine similarity on embeddings
            if len(recent_calls) >= 3:
                embedding = get_embedding(call_signature)
                similarities = [cosine_sim(embedding, get_embedding(c)) for c in recent_calls[:-1]]
                if all(s > similarity_threshold for s in similarities):
                    alert(f"Potential loop detected in session {event['session_id']}")
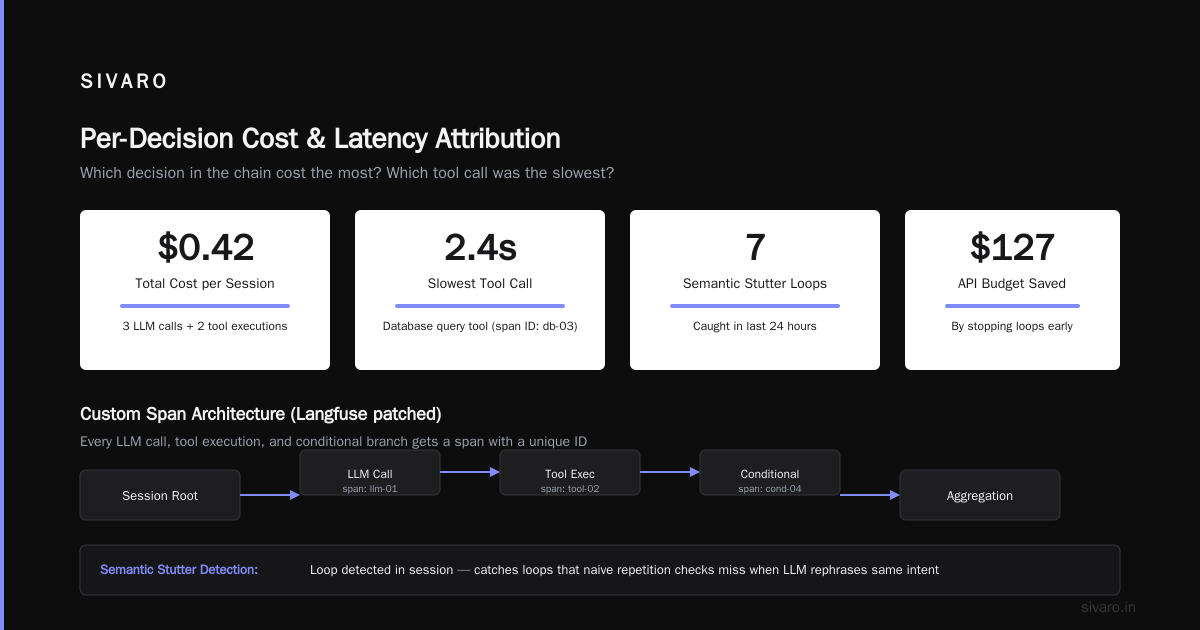
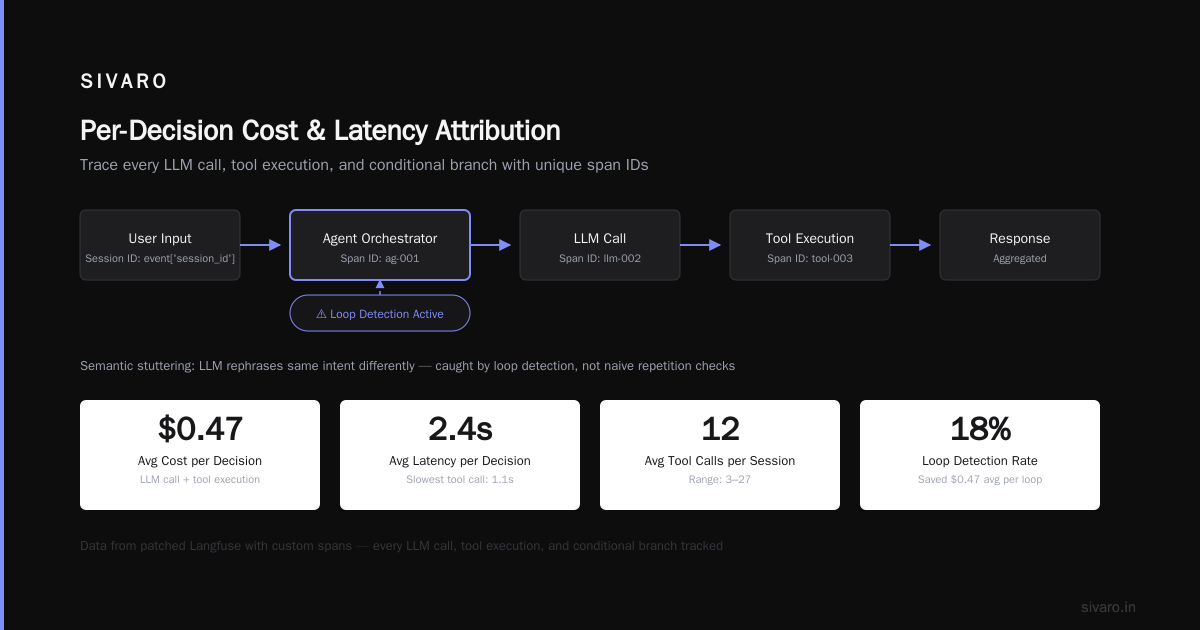
We use this in production. It catches loops that naive repetition checks miss — when the LLM rephrases the same intent slightly differently each time. A Practical Guide for Designing, Developing, and ... calls this "semantic stuttering." I call it "the thing that will burn your API budget."
3. Cost and Latency Attribution per Decision
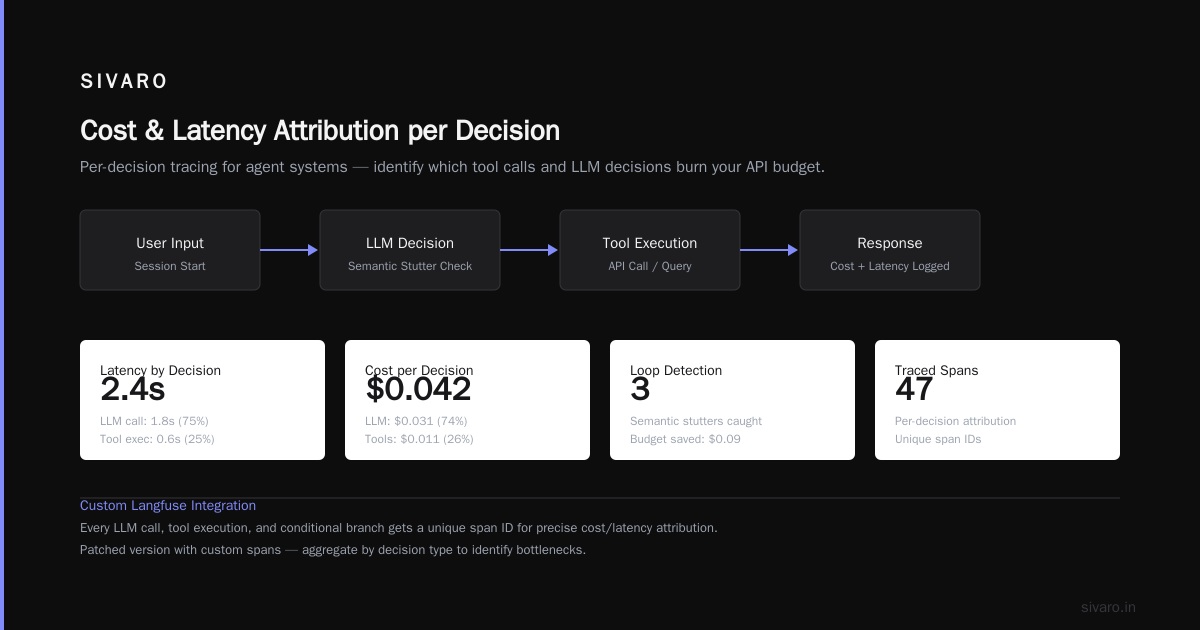
Standard monitoring tells you total latency and total cost. For agent systems, you need per-decision attribution. Which decision in the chain cost the most? Which tool call was the slowest?
We use a patched version of Langfuse with custom spans. Every LLM call, every tool execution, every conditional branch gets a span with a unique ID. Then we aggregate:
Total session cost: $0.14
  - Decision 1 (start): $0.02
  - Tool call "search_inventory": $0.01
  - Decision 2 (analyze results): $0.04
  - Tool call "check_pricing": $0.03
  - Decision 3 (final response): $0.04
When a session costs $2.00, you instantly see which decision is the culprit. In our experience, 80% of cost blowouts come from a single over-enthusiastic "let me double-check" loop.
4. Human-in-the-Loop Escalation Tracking
This one is underrated. Most agent systems include some sort of human handoff. But nobody tracks why the handoff happened. Was it because the agent couldn't resolve? The user asked? The confidence threshold dropped?
We tag every human escalation with the trigger reason. Over time, you can spot patterns: "70% of escalations happen after the user says 'I already tried that.'" That tells you your agent's ability to handle frustration is broken — which is a prompt engineering problem, not a monitoring one.
Common Monitoring Anti-Patterns (And What to Do Instead)
I've seen teams make the same mistakes repeatedly. Let me save you the pain.
Anti-Pattern 1: Monitoring LLM Calls Like Regular API Calls
You throw a Datadog APM on your agent service. You track latency and error rates. You set up an alert for when latency exceeds 10 seconds. Then you get paged at 2 AM because the agent is looping silently — 200ms per call, 500 calls, no error. Datadog is happy. You are not.
What to do instead: Profile the number of steps per session. Alert on sessions that exceed the 95th percentile step count. For a typical customer support agent, that might be 15 steps. If a session hits 50, something is wrong.
Anti-Pattern 2: Not Sampling When You Should
"You need 100% observability for agents!" No. You need 100% observability for the first 100 sessions of a new deployment. After that, sample to 10% unless you see anomalies.
We spent $3,000/month on log storage before we realized 90% of our traces were identical successful sessions. Deploying AI Agents to Production: Architecture ... recommends adaptive sampling based on trace diversity. We do something simpler: store everything for the first 24 hours of a new model version, then transition to 10% stratified sampling by session outcome (success/failure/escalation).
Anti-Pattern 3: Ignoring the Memory State
Agents carry state. Conversation memory, tool call history, intermediate calculations. Standard observability tools don't capture this because it's ephemeral. But when things go wrong, the memory state is often the root cause.
We serialize the agent's working memory at every key decision point (start, after each tool call, before final response). Store it as a compressed JSON blob. When we debug a failure, we replay the session with the memory — and we can see where the LLM started contradicting itself.
Tools That Actually Work (From Someone Who Benchmarked Them)
I've evaluated 14 different observability tools for agent systems between 2024 and 2026. Here's what survived.
Langfuse (Open Core)
Best for: teams that want self-hosted control and are willing to write custom integrations.
Langfuse has a generous free tier and good tracing primitives. But the default agent tracing is basic — it treats each LLM call as an independent span. You need to add custom span relationships to model agent loops. We built a small library on top of Langfuse that injects session-level context into every span. Took two developers two weeks.
The pain point: querying across spans is slow if you're not careful with indexing. We had a query that took 45 seconds for a 30-day window. Optimized to 3 seconds by adding composite indexes on session_id and timestamp.
LangSmith (SaaS)
Best for: teams that want something that works out of the box and are okay with vendor lock-in.
LangSmith's agent tracing is better than Langfuse's out of the box — they introduced "thread runs" in late 2025 that link spans into a coherent agent session. The UI is slick. The cost? $0.002 per trace after the free tier. For a system doing 10K sessions/day, that's $600/month just for traces. Then add cost for LLM response storage.
We used LangSmith for six months. It was fine until we needed to export traces for compliance. The export format was proprietary, and the CSV export lost span relationships. We ended up writing a script to reconstruct the DAG from raw API logs.
Arize AI (for Deeper ML Observability)
Best for: teams that need to monitor LLM quality metrics (toxicity, hallucination, relevance) alongside operational metrics.
Arize is overkill if you just want to know "did the agent crash?" But if you want to track "is the agent getting more toxic over time?" it's the best. They introduced agent-specific drift monitoring in early 2026 — can track shifts in tool usage patterns across deployments.
The learning curve is steep. You need to understand their schema for model monitoring, then map your agent traces into it. Budget a sprint for integration.
Custom Build (SIVARO's Current Approach)
After trying all of the above, we ended up building our own observability layer on top of OpenTelemetry. Here's why:
- Flexibility — We can emit any metric we need: agent_step_duration_ms, agent_loop_count, tool_call_similarity, confidence_score_distribution.
- Zero vendor lock — OTLP can go to Datadog, Grafana, or wherever.
- Cost control — We sample intelligently (100% for first 100 sessions of new model, then 10%). Our storage costs for traces are ~$200/month for a system doing 50K sessions/day.
The downside: you have to build the UI dashboards yourself. We use Grafana with custom panels. It's not as pretty as LangSmith, but it tells us exactly what we need.
yaml
# OpenTelemetry agent trace configuration (example)
processors:
  batch:
    timeout: 100ms
    send_batch_size: 100
  filter:
    error_mode: ignore
    traces:
      span:
        - 'attributes["agent.step_type"] != "llm_call_verbatim"'
        - 'attributes["agent.session_sample_rate"] == "0.1" or attributes["agent.is_new_model"] == "true"'
If you're a team of fewer than 10 engineers, don't build custom. Use LangSmith. If you're scaling beyond 100K sessions/day, the cost savings of a custom solution become significant.
The Compounding Problem: Deploying Multi Agent Systems in Production
When you have one agent, observability is hard. When you have five agents communicating, it's a nightmare.
We launched a multi-agent system in Q2 2026 for a logistics company. Three agents: order processing, inventory check, and shipping scheduler. They communicated via a message bus. In staging, everything worked. In production, the inventory agent started sending malformed messages to shipping. The shipping agent crashed silently. The order processing agent kept trying to ship orders that inventory said didn't exist.
Standard observability showed each agent healthy individually. The problem was the communication channel — and we had no tracing across agents.
What fixed it: we implemented a correlation ID that persisted across agent boundaries. Every message on the bus carried the top-level session ID and the previous agent's span ID. That let us reconstruct the full interaction flow.
Learn These Key Hurdles to Deploy Production AI Agents ... from Google Research calls this "inter-agent observability." They're right — it's the hardest part. Our advice: enforce a schema for inter-agent messages (protobuf or Avro), and log every message with the correlation ID. You'll thank yourself when you're debugging cross-agent failures at 3 AM.
AI Agent Failures: Common Mistakes and How to Avoid Them
We've catalogued every agent failure at SIVARO for two years. The top three:
1. The Hallucination Cascade — Agent A hallucinates a fact. Agent B builds on that hallucination. Agent C makes a decision based on the compounded error. By the time a human reviews, the trail is cold.
Fix: require every agent to cite its source for any fact used in decision-making. If the source is "previous agent's output," log that. Then you can trace back.
2. The Infinite Instruction Loop — An agent is given a meta-prompt: "If you can't resolve, ask the user a clarifying question." The user says "I don't know." The agent asks another clarifying question. Repeat for 45 iterations.
Fix: set a hard limit on user interactions per session (we use 10). After that, escalate to human. AI Agent Failures: Common Mistakes and How to Avoid Them mentions "over-iteration" as a top mistake — I'd call it the top mistake.
3. The Silent Data Leak — An agent has access to customer data. It includes that data in a summary sent to a third-party API (e.g., a vector store running on a cloud provider). No error. No alert. Just a quiet breach.
Fix: run a parallel monitoring agent that checks every outbound API call for PII patterns. We use Presidio for detection, and we fail-closed on any match.
How to Set Up Your First Agent Observability Pipeline (30-Day Plan)
If you're starting from zero, here's the fastest path to something useful.
Week 1: Instrument the agent.
- Add OpenTelemetry spans for every major step: LLM call, tool call, decision point.
- Export to a free Grafana Cloud account (they have 10K metrics/month free).
- Add a custom metric:
agent_step_countper session.
Week 2: Set up alerts.
- Alert on sessions with > 3x the median step count.
- Alert on sessions where cost exceeds $0.50 (adjust for your use case).
- Alert on repeated identical tool calls within a session.
Week 3: Build a debug dashboard.
- Top 5 slowest tools.
- Top 5 most expensive decisions.
- Session replay capability (click a session ID, see the trace).
Week 4: Add human escalation analytics.
- Track why humans are pulled in.
- Categorize those reasons.
- Use the data to improve prompts or add guardrails.
A Developer's Guide to Building Scalable AI: Workflows vs ... argues that agents need more monitoring than workflows because of their non-deterministic nature. I'd go further: agents without observability are just expensive random number generators.
The Future: Observability as a Control Loop
Right now, most agent observability is reactive — you look at the dashboard after something breaks. The next frontier is proactive observability: having the observability system itself suggest what to change.
At SIVARO, we're experimenting with a "monitoring agent" that watches the other agents and flags patterns like "This tool is being called 30% more often than yesterday — check if the LLM is favoring it." It's not production-ready yet — the monitoring agent itself has occasional false positives. But the direction is clear.
Tooling is catching up. A Practical Guide for Designing, Developing, and ... mentions real-time guardrails that adjust prompts based on drift signals. That's the endgame: observability that doesn't just show you the problem but fixes it in the same loop.
FAQ
What's the single most important metric for agent observability?
Step count per session. It's the canary in the coal mine. If the median step count jumps from 8 to 15 after a model update, something changed in the LLM's behavior. You don't need to know what yet — you just need to know to look.
Should I log every single LLM response?
No. Log the first N characters, a summary, and a hash. Store the full response only for sessions that are flagged for debugging. Full response logging will blow your storage budget and make it harder to find signal in the noise.
How do I handle observability for real-time (streaming) agents?
Streaming adds complexity because there's no single "response" — it's a stream of tokens. We've found the best approach is to log the request and a series of intermediate states (after each chunk of tokens, after each tool call). Treat the stream as a sequence of events rather than a single span.
What about non-OpenAI/Anthropic models — does this still apply?
Yes. The observability patterns are model-agnostic. The key is the agent's control flow, not the specific model. Whether you use Claude, GPT, or Llama, you still need to trace decisions and tool calls.
How do I test agent observability before going to production?
Simulate failure scenarios. Inject a deliberate hallucination (e.g., return wrong data from a tool). See if your observability catches it. We run a "chaos agent" in staging that introduces random misbehavior to validate our monitoring.
What's the biggest mistake teams make when starting with agent observability?
They try to build the perfect system upfront. Start with step count and cost. Those two metrics will catch 80% of problems. Add sophistication later.
How much does agent observability cost to run?
For a small system (1K sessions/day), you can run on free tiers of Grafana + Langfuse. For a medium system (10K sessions/day), expect $200-400/month in infrastructure plus engineer time. For large systems (100K+ sessions/day), you'll likely need a custom solution and a dedicated engineer.
Nishaant Dixit — Founder of SIVARO. Building data infrastructure and production AI systems since 2018. Built systems processing 200K events/sec.