 SIVARO
AI Agent Production Environment Setup: A Practitioner's Guide
You’ve built an agent that writes code, answers customers, or orchestrates workflows. It works in your notebook. It works in staging. You push to production and within six hours the system is down, the logs are gibberish, and your CTO is asking why the agent called an external API with a hallucinated customer ID.
I’ve been there. At SIVARO we’ve deployed over 60 production AI agents since 2023, for clients ranging from logistics to healthcare. The problems are never the model. They’re always the environment.
This guide covers ai agent production environment setup — the architecture, the deployment strategy, the monitoring, and the hard lessons that don’t show up in blog posts. By the end you’ll have a concrete checklist, a working canary deployment pattern, and a few scars to avoid.
Why Most Agent Deployments Fail (and It’s Not the Model)
Most people think the failure mode is accuracy. Wrong. The failure mode is non-determinism in a deterministic infrastructure.
AI agents are stateful in ways traditional microservices aren’t. A single call to an LLM can return different outputs for the same input. That means your idempotency guarantees break. Your retry logic spins forever. Your caching layer becomes a liability.
I saw a startup in early 2025 deploy an agent for email triage. They tested it with 50 sample emails. Worked fine. In production, within two hours, the agent had replied to a single customer 14 times because the retry logic didn’t account for the model returning a slightly different subject line each time. The prompt said “reply only once” — but the retry loop was outside the model’s control.
The real problem: their ai agent production environment setup treated the agent like a stateless API endpoint. It wasn’t. And it blew up.
You need to design your environment around the fact that LLMs are probabilistic functions that occasionally lie, forget instructions, and change behavior without warning. That’s not a model issue. That’s a production issue.
The Core Components of an AI Agent Production Environment
Let’s break down the stack. Every AI agent production environment needs five layers, and most teams skip #3 and #4.
1. Gateway / Router
Your entry point. It handles authentication, rate limiting, request routing, and initial validation. We use a lightweight reverse proxy (Envoy or custom Nginx with Lua). The gateway also strips sensitive data before it reaches the agent — critical if your agent consumes user PII.
2. Orchestrator
This isn’t the agent itself. It’s the state machine that tracks conversation turns, tool calls, and intermediate results. We built ours on Temporal (workflow engine). Why not just a custom Python loop? Because when the agent calls a tool that takes 12 seconds, you need persistence, retries, and dead-letter queues. Temporal handles that. A Practical Guide for Designing, Developing, and ... calls this “execution with guardrails” — I wish I’d read that paper two years ago.
3. Guardrail Service
This is the layer everyone forgets. A separate service that sits between the orchestrator and the LLM (or after the LLM, depending on design). It validates every model output against business rules before the orchestrator acts on it.
For example: “Never generate a link to an internal tool in customer-facing messages.” Or “Output must be valid JSON.” Or “Do not mention competitors.”
We run two guardrails — one before the model to sanitize inputs, one after to validate outputs. Is it slower? Yes. But the alternative is an agent that emails your entire customer list a hallucinated pricing page. I’ve seen it happen.
4. Observability Stack
Logs alone won’t save you. You need traces that capture the agent’s chain-of-thought, tool call context, and final output. We send every LLM call, every tool result, and every guardrail pass/fail to a dedicated observability pipeline (OpenTelemetry → ClickHouse). Then we run anomaly detection on response shape, not just latency.
Key metrics:
- Semantic drift: Cosine similarity between expected output and actual output.
- Tool call success rate: Are external APIs returning errors the agent doesn’t handle?
- Latency percentiles: p50, p95, p99. A p99 of 30 seconds means your agent is hanging on some edge case.
5. Deployment Infrastructure
Kubernetes with custom operators. We use KEDA for autoscaling based on queue depth, not just CPU. And we use Argo Rollouts for the canary deployment — more on that below.
Your AI Agent Deployment Checklist: From Staging to Canary
Most checklists I see are generic “test in staging, promote to production” — useless for agents. Here’s our actual ai agent deployment checklist at SIVARO:
Pre-deployment
-
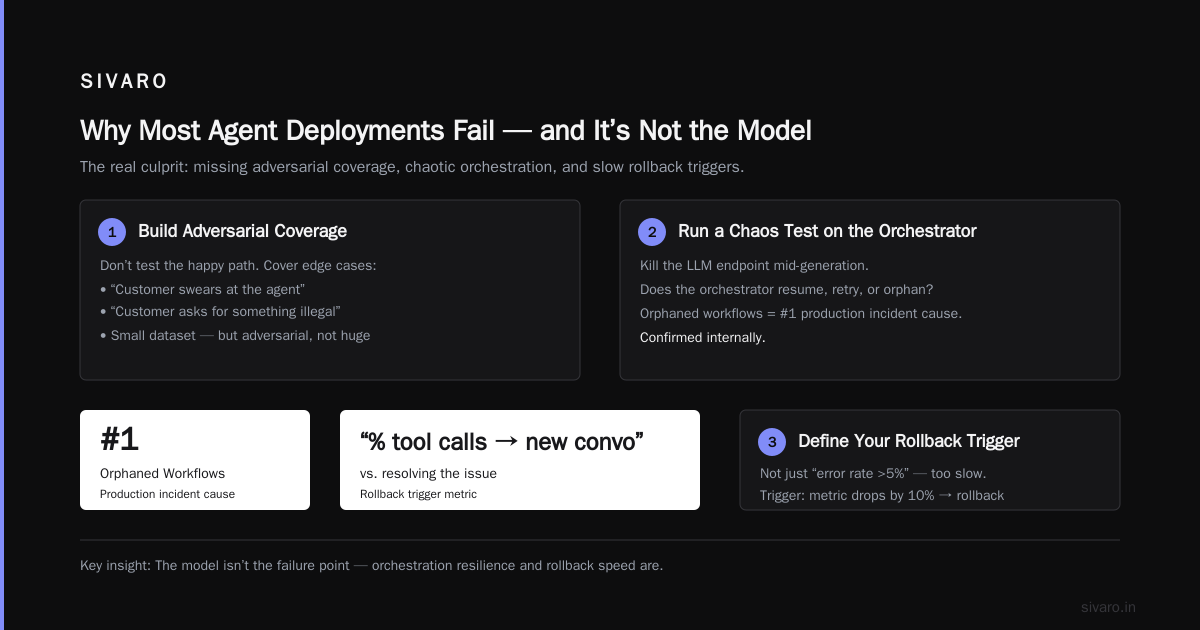
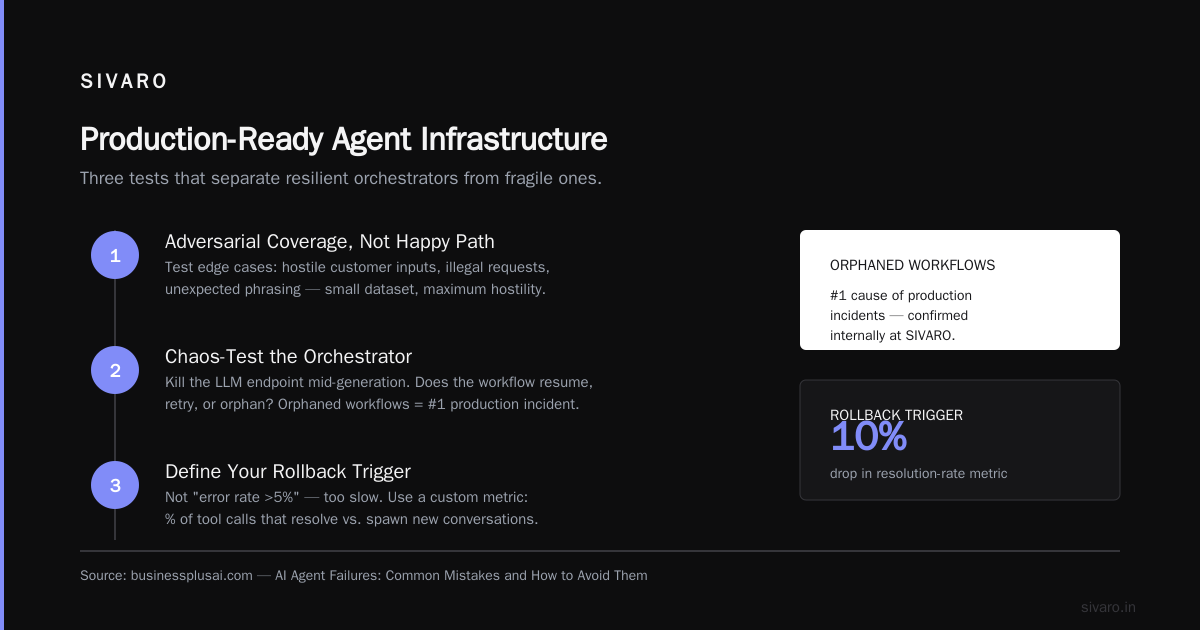
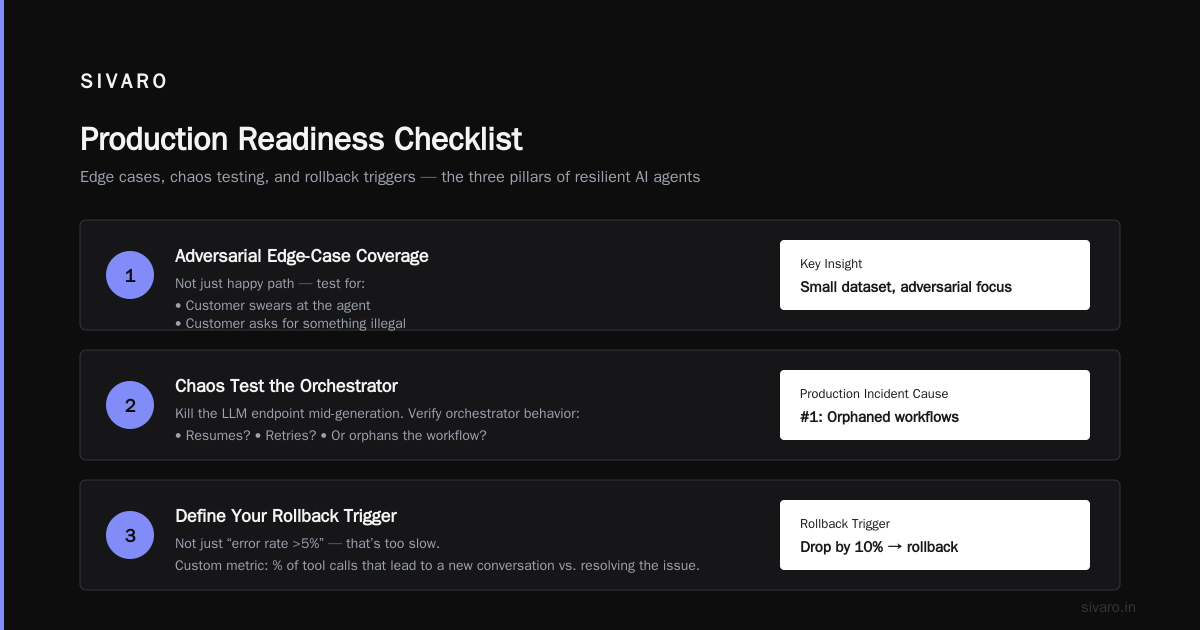
Seed the guardrail service with at least 50 edge-case scenarios. Not “happy path” — things like “customer swears at the agent” or “customer asks for something illegal.” You don’t need a huge dataset. You need adversarial coverage.
-
Run a chaos test on the orchestrator. Kill the LLM endpoint mid-generation. See if the orchestrator resumes, retries, or orphans the workflow. AI Agent Failures: Common Mistakes and How to Avoid Them lists orphaned workflows as the #1 production incident cause. We confirmed that internally.
-
Define your rollback trigger. Not just “error rate >5%” — that’s too slow. We use a custom metric: “percentage of tool calls that lead to a new conversation vs. resolving the issue.” If that number drops by 10% in 5 minutes, the agent is arguing more than helping. Rollback.
Staging
-
Mirror production traffic. Don’t use synthetic data. Use a replay of real requests from production, but with anonymized PII. This catches the one-in-a-thousand edge case your test set missed. We do this with a shadow proxy that sends traffic to both old and new agent, comparing outputs.
-
Canary deployment (next section). But before that, run a silent canary — the agent produces outputs but they’re not shown to users. Only logged. You can run this for a week and analyze failure patterns.
Production
-
Start with 1% traffic. Not 5%, not 10%. 1%. If something breaks, you lose 1% of conversations. Acceptable. Then double after 2 hours, double again after 6 hours, then full rollout.
-
Turn on automated rollback on the guardrail service. If 5% of outputs fail the guardrail, revert the canary automatically. This saved us twice in the last year.
Canary Deployment for AI Agents: The Only Safe Way to Roll Out
Ai agent canary deployment is different from a normal microservice canary. Reason: the agent’s behavior is non-deterministic. You can’t just compare HTTP status codes.
Here’s our pattern.
We run two versions of the agent in parallel. The orchestrator routes a percentage of traffic to the new version. But we don’t just look at error rates. We compare semantic outcomes.
yaml
# Argo Rollout configuration for agent canary
apiVersion: argoproj.io/v1alpha1
kind: Rollout
metadata:
  name: ai-agent-canary
spec:
  replicas: 10
  strategy:
    canary:
      steps:
        - setWeight: 1
        - pause: { duration: 2h }
        - analysis:
            templates:
              - templateName: agent-quality-analysis
        - setWeight: 5
        - pause: { duration: 6h }
        - analysis:
            templates:
              - templateName: agent-quality-analysis
        - setWeight: 50
        - pause: { duration: 12h }
        - analysis:
            templates:
              - templateName: agent-quality-analysis
        - setWeight: 100
The analysis template runs in Prometheus, querying our observability store:
yaml
apiVersion: argoproj.io/v1alpha1
kind: AnalysisTemplate
metadata:
  name: agent-quality-analysis
spec:
  metrics:
    - name: semantic-failure-rate
      successCondition: result < 0.05
      provider:
        prometheus:
          query: >
            rate(
              agent_semantic_failures_total{version="new"}[5m]
            ) /
            rate(
              agent_requests_total{version="new"}[5m]
            )
    - name: tool-call-completion-ratio
      successCondition: result > 0.8
      provider:
        prometheus:
          query: >
            avg(
              agent_tool_calls_completed{version="new"} /
              agent_tool_calls_started{version="new"}
            )
Why do we care about tool call completion ratio? Because a “successful” response from the LLM might still cause the agent to loop or fail to complete a tool call chain. That’s invisible in standard response codes. Deploying AI Agents to Production: Architecture ... calls this “behavioral verification” — I agree.
One more tip: never canary with a single model provider. Toggle the model provider as well. If you’re switching from GPT-4 to Claude 3.5, run a canary that changes both the agent version and the model. Otherwise you can’t isolate which change caused a regression.
Monitoring: What You Actually Need to Watch (Not Just Latency)
Latency is table stakes. If your agent’s p95 is under 5 seconds, you’re fine. But latency doesn’t tell you if the agent is good.
Here’s what we monitor beyond the basics:
Semantic Drift
We compute a cosine similarity between the agent’s output and an “expected output” from a shadow model (a frozen version of the agent). If drift spikes, the agent is producing something novel — could be a breakthrough, could be a hallucination. We alert on it.
Tool Call Entropy
How many different tools does the agent call? In a well-designed agent, the number stabilizes around a small set (3-5). If entropy jumps — the agent starts calling rarely-used tools — something is off. The prompt may have degraded, or the model changed behavior.
We use a simple sliding window:
python
import statistics

def tool_call_entropy(calls, window=100):
    tool_counts = {}
    for call in calls[-window:]:
        tool_counts[call['tool_name']] = tool_counts.get(call['tool_name'], 0) + 1
    total = sum(tool_counts.values())
    probs = [c/total for c in tool_counts.values()]
    return -sum(p * math.log2(p) for p in probs)
If entropy crosses 2.5 (log2 of 5 tools), we get paged.
Agent Stalling
Sometimes the agent doesn’t fail — it just stops making progress. It asks the same question twice. It loops through the same three tool calls. We detect this by looking at the ratio of “unique conversation turns” to “total turns.” If that ratio drops below 0.6, the agent is stuck. Building Effective AI Agents describes this as “agent inertia” — great term.
User Escalation Rate
The real metric. How often does a human step in? We track “escalation” as a special tool call (the agent passes to a human). If this rate increases by 20% after a deployment, the agent is worse — even if error rates are fine.
Infrastructure Patterns That Scale (and One That Doesn’t)
Let’s talk actual infrastructure.
The Pattern That Works: Event-Driven with Queues
At SIVARO we use an event-driven architecture. Incoming requests go to a Kafka queue. The orchestrator picks them up, manages state in a transactional database, and publishes results to an output queue. This decouples the agent from real-time user expectations. If the LLM is slow, the queue absorbs it. If the agent crashes, the message is re-queued.
We use Redis for short-term state and Postgres for long-term conversation history. The orchestrator is stateless — all state lives in external stores. This makes scaling trivial: just spin up more orchestrator pods.
yaml
# Kafka consumer config for agent orchestrator
apiVersion: kafka.strimzi.io/v1beta2
kind: KafkaTopic
metadata:
  name: agent-requests
spec:
  partitions: 20
  replicas: 3
  config:
    retention.ms: 604800000
    cleanup.policy: compact
---
apiVersion: apps/v1
kind: Deployment
metadata:
  name: agent-orchestrator
spec:
  replicas: 5
  template:
    spec:
      containers:
      - name: orchestrator
        image: sivaro/agent-orchestrator:2026.08.02
        env:
        - name: KAFKA_BOOTSTRAP_SERVERS
          value: "kafka-cluster:9092"
        - name: STATE_DB_URL
          value: "postgres://agent:pass@pg-agent-state:5432/agent"
        resources:
          requests:
            memory: 2Gi
            cpu: 500m
          limits:
            memory: 4Gi
            cpu: 1
Scale horizontally to 20 replicas? No problem. The queue is the bottleneck, not the agent.
The Pattern That Fails: Request-Response Sync
Some teams deploy agents as a synchronous HTTP service. The user sends a message, the agent responds. This is fine for simple Q&A. But the moment your agent calls an external API that takes 10 seconds, the connection holds. The user gets a timeout. The server runs out of workers.
We tried this in early 2024. It died after 500 concurrent users. The synchronous pattern works when your agent is a single LLM call with no tool use. For real agents, it doesn’t.
Caching Strategy
Don’t cache LLM responses at the API level. They’re too variable. Instead, cache tool call results. If the agent calls your CRM to get a customer’s name, that result can be cached for a short TTL (e.g., 5 minutes). This speeds up the agent without risking stale hallucinations.
We use Redis with a hash key based on (tool_name, tool_params). TTL of 300 seconds. Works beautifully.
The Contrarian Take: Don’t Automate Everything at First
I’ll tell you something that sounds wrong: don’t try to build a fully automated ai agent production environment setup in your first iteration.
Too many teams spend weeks setting up Kubernetes, observability pipelines, and automated rollback systems before their agent even works. They get stuck in infrastructure hell. Meanwhile, the actual agent logic is a mess.
Start manual. Deploy the agent to a single server with a cron job that restarts it every hour. Monitor via a human watching logs. Yes, it’s primitive. But you’ll learn what actually breaks. Then automate those pain points.
At SIVARO, our first production agent (a code review assistant, deployed June 2023) ran on a single EC2 instance with a screen session. It worked for six months. We learned that the biggest failure was the LLM returning markdown instead of JSON. That’s what drove us to build the guardrail service — not theory, but blood and tears.
Once you have a running agent and you know its failure modes, then invest in the fancy infrastructure. How to Deploy AI Agents to Production: A Complete Guide suggests starting with a “staging-only” agent for a week. I agree, but I’d go further: run it for a month with a human-in-the-loop before automating anything.
AI Agent Production Environment Setup: The Hard Truths
I’ve been doing this for three years. Here are the truths that don’t fit into a neat checklist.
Different models behave differently under load. GPT-4 gets slower but more consistent as requests pile up. Claude gets faster but more verbose. If you’re swapping models mid-canary, your metrics will become uncomparable. We now plan separate canaries for model changes.
Your agent is only as good as your tool documentation. Every time an LLM calls a tool with incorrect parameters, that’s a documentation problem, not a model problem. We started auto-generating tool descriptions from our API schemas. The error rate dropped by 60%.
You cannot fully test an agent in staging. Staging has clean data, consistent latency, and no angry users. Production has all three simultaneously. Accept that the first 48 hours of a canary will reveal issues you didn’t catch. That’s okay. A Developer’s Guide to Building Scalable AI: Workflows vs ... calls this “the production gap” — the difference between observed behavior in dev and prod. It never closes completely.
FAQ
What is the minimum infrastructure I need to deploy an AI agent to production?
Three things: a state store (Redis or Postgres), a queue (Kafka or SQS), and a server that runs the agent logic. That’s it. Add guardrails and monitoring as you go.
How do I handle model rate limits in production?
Use a queue with rate limiter per model provider. We have a Redis-based token bucket that enforces a configurable requests-per-minute per key. The orchestrator blocks until a token is available. Learn These Key Hurdles to Deploy Production AI Agents ... points out that rate limits are the second most common production issue after tool call failures. True.
Should I use one LLM or multiple models?
Use one primary model, but have a fallback model for when the primary is down or slow. We use GPT-4 as primary, Claude 3.5 as fallback. They produce different outputs, so we run a separate canary for fallback usage.
How do I prevent the agent from hallucinating harmful content?
The guardrail service must block outputs based on a blocklist (regex) and a semantic classifier (NLP). We also log every output that gets blocked and review it daily.
Can I use serverless functions for my agent?
For simple agents with no tool use, yes. For agents that call external APIs or maintain multi-turn conversations, serverless is too constrained in execution time and state. Use a container-based service.
What’s the easiest way to roll back a bad agent deployment?
Use a canary deployment with an automated analysis template that triggers a rollback within 5 minutes of detecting failure. We use Argo Rollouts with a Prometheus query that checks the “semantic failure rate” metric. If it crosses 5%, the rollback happens without human intervention.
How do I test the agent’s behavior before going live?
Shadow traffic. Route a copy of real requests to the new agent version, but only log the output — don’t show it to users. Compare those outputs to the current version’s outputs using a similarity metric. Run this for at least 24 hours before the canary.
Conclusion
Setting up an ai agent production environment is harder than setting up a traditional microservice. The non-determinism, the statefulness, the tool call chains — they all require a different approach. But the fundamentals are the same: queue everything, monitor semantically, deploy incrementally, and never trust the model alone.
Use the ai agent deployment checklist I shared. Run a proper ai agent canary deployment with behavioral metrics. Build a guardrail service before you need it. And please — start small, even if it feels primitive.
The industry is moving fast. By mid-2026, we’ve seen agent deployments become the default for customer support, code review, data pipeline management, and more. But the companies that survive aren’t the ones with the fanciest agents. They’re the ones that can ship an agent to production without burning down the house.
Nishaant Dixit — Founder of SIVARO. Building data infrastructure and production AI systems since 2018. Built systems processing 200K events/sec.