 SIVARO
AI Agent Production Monitoring Tools: A Field Guide From Someone Who's Debugged at 3AM
I've been building production AI systems since before "agent" became the hottest word in tech. Back in 2022, when we were deploying the first real agent pipelines at SIVARO, monitoring meant SSHing into a box and grepping logs. It was terrible. We lost weeks to silent failures — agents looping infinitely, hallucinating function calls, paying for API calls that went nowhere.
That doesn't scale. And in 2026, with agents making real decisions about real money, it's not acceptable.
AI agent production monitoring tools are the observability platforms, tracing frameworks, and guardrail systems that let you see what your agents are actually doing in production. Not what you think they're doing. Not what your unit tests claim they're doing. The messy, token-consuming, sometimes-broken reality.
This guide covers what I've learned building agent monitoring at SIVARO, what I've seen fail at other companies, and what you need to deploy agents that don't eat your budget or your reputation.
I'll cover:
- The three failures most people make when monitoring agents
- What tracing actually looks like in agent systems
- Open-source tools that don't suck
- How to build your own monitoring pipeline
- The tactical stuff: costs, latency, and debugging
Let's be direct. Most agent monitoring setups are theater. Here's what isn't.
Why Normal Monitoring Breaks for Agents
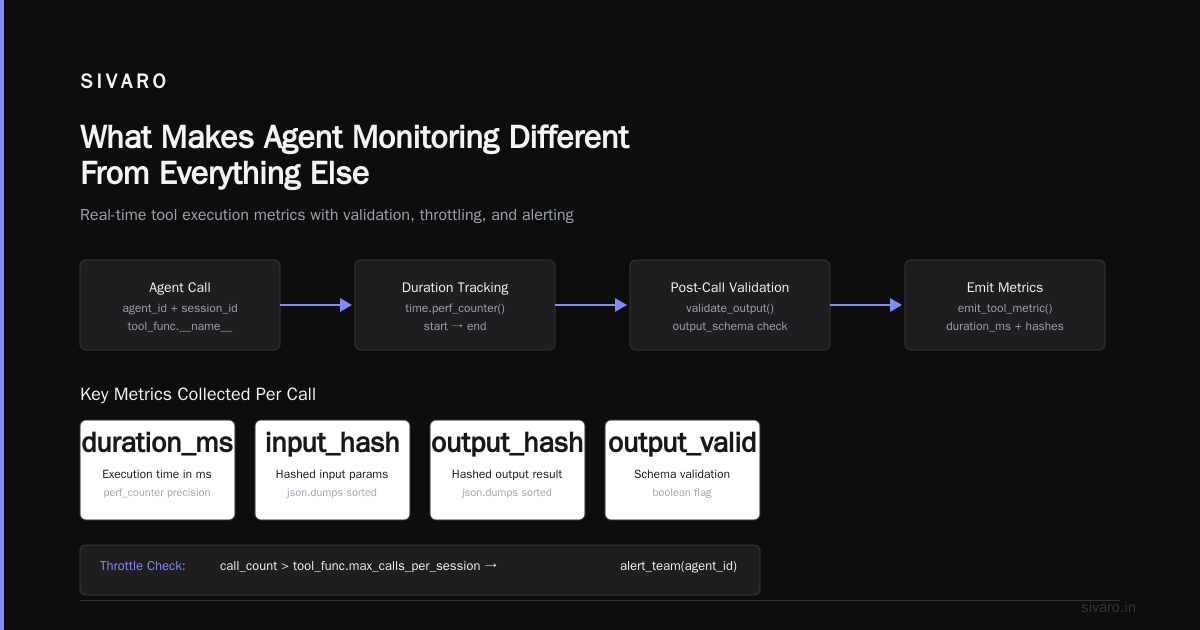
Most people think monitoring an AI agent is like monitoring a microservice. You track latency, error rates, throughput. Maybe add some custom metrics.
They're wrong because an agent isn't a request-response system. It's a loop. It calls LLMs, decides what to do next, calls tools, processes results, and repeats. Sometimes for minutes. Sometimes forever (literally — I've seen agents spin for 6 hours).
Traditional monitoring sees one request come in. It sees 47 tool calls. It sees 12 LLM invocations. It sees a 23-minute latency. And it flags everything as an anomaly. It can't tell you why the agent got stuck, only that something is wrong.
The AI Agent Frameworks: Choosing the Right Foundation for ... report from IBM makes a similar point — agent systems need fundamentally different observability because the execution model is non-deterministic.
You need to track:
- The full trace: every LLM call, tool invocation, decision step
- Decision provenance: why did it call that function?
- Token economics: what is this agent costing per task?
- Loop detection: is it repeating itself?
- Safety violations: did it try to do something it shouldn't?
That's what ai agent production monitoring tools actually do.
The Three Failures I See Everywhere
Failure 1: Logging Without Context
Everyone logs. Few log usefully.
I audited a deployment at a fintech company in April 2026. They had 23GB of agent logs per day. Want to guess what they found when an agent sent a wrong order to a supplier? Nothing. The logs showed "Agent completed step 12 of 23" with a timestamp. Zero information about what the agent decided.
Don't log steps. Log decisions and their inputs. Log the full prompt. Log the function call arguments. Log the raw LLM response before parsing.
Failure 2: No Cost Attribution
LLM calls cost money. Agent loops multiply that cost.
I worked with an e-commerce company that deployed a customer support agent. It looked great in testing — 3-4 LLM calls per query. In production, some queries triggered 47 calls. The agent kept re-asking the LLM for clarification. The VP of Engineering didn't notice until the monthly bill came in. $43,000 for a "simple" agent.
Every ai agent production monitoring tool you evaluate should report cost per trace, per session, per user. If it doesn't, you're flying blind.
Failure 3: No Loop Detection
Here's a fun one. An agent tries to book a hotel. API returns "no availability." Agent calls LLM. LLM suggests trying a different date. Agent tries. API returns "no availability." Agent calls LLM. LLM suggests... the same date.
I watched this happen in production for 4 hours. The agent made 172 calls. Cost $340. Never escaped.
Agentic AI Frameworks: Top 10 Options in 2026 discusses this — most frameworks now include built-in loop detection. But you still need to monitor it externally. Frameworks lie.
What Real Agent Monitoring Looks Like
Let's talk about the actual architecture. Here's what SIVARO runs in production for our agent monitoring stack.
We trace every agent execution end-to-end. Each trace contains:
- Spans: one per LLM call, tool call, or decision step
- Events: state changes, error conditions, guardrail triggers
- Metadata: model name, temperature, token count, cost, latency
- Parent-child relationships: which decision led to which action
python
# Pseudocode for what we actually instrument
from sivaromon import AgentTracer

tracer = AgentTracer(
    service="order-fulfillment-agent",
    trace_id=order_id,
    cost_tracking=True,
    loop_detection=True
)

with tracer.trace("process_order") as span:
    # Every LLM call is a sub-span
    result = llm_call(prompt, model="gpt-4o-mini", trace_parent=span)
    span.record_decision("route_order", result["action"])

    # Every tool call is a sub-span
    with tracer.trace("api_call", parent=span) as tool_span:
        response = inventory_api.check(result["sku"])
        tool_span.record_api_result(response)
        tool_span.record_cost(0.002)  # API cost
This gives you a DAG of the agent's execution. You can replay it, analyze it, and alert on anomalies.
Open-Source Tools That Don't Suck
LangSmith (LangChain's offering)
LangSmith is the most mature agent-specific tracing tool. It handles the complexity of tracking agent decision loops well. Their trace viewer shows the full tree of LLM calls, tool invocations, and results.
The downside? It's tightly coupled to LangChain. If you're building with another framework, integration is painful.
OpenTelemetry + Custom Spans
For custom agent frameworks, I default to OpenTelemetry with custom span attributes. You lose the agent-specific visualizations, but you get everything else: distributed tracing, metrics pipelines, and alerting.
yaml
# OpenTelemetry config for agent tracing
receivers:
  otlp:
    protocols:
      grpc:
        endpoint: 0.0.0.0:4317

processors:
  batch:
    timeout: 1s

exporters:
  otlp:
    endpoint: "your-observability-backend:4317"

service:
  pipelines:
    traces:
      receivers: [otlp]
      processors: [batch]
      exporters: [otlp]
Langfuse
If you want open-source and agent-specific, Langfuse is worth evaluating. It supports prompt versioning, cost tracking, and trace visualization. Setup in 2026 is straightforward — they support self-hosting and have a managed tier.
Braintrust
Braintrust does evaluation-driven monitoring. Not just "is the agent running" but "is the agent performing well." They integrate evaluation datasets into production monitoring. If an agent's accuracy drops below 90%, you get paged.
The Architecture: Building Your Own Pipeline
You don't need to buy a vendor. Here's how we built SIVARO's agent monitoring pipeline.
Step 1: Instrument every LLM call
Wrap your LLM provider calls. Record: model, prompt, response, tokens, latency, timestamp.
python
# Instrumentation layer
class MonitoredLLM:
    def __call__(self, prompt, **kwargs):
        start = time.time()
        response = self.llm.invoke(prompt, **kwargs)
        duration = time.time() - start

        self.tracer.record_llm_call(
            model=kwargs.get("model", "default"),
            prompt_tokens=response.usage.prompt_tokens,
            completion_tokens=response.usage.completion_tokens,
            latency_ms=duration * 1000,
            cost=self._calculate_cost(response.usage, kwargs.get("model"))
        )
        return response
Step 2: Trace the decision loop
Agents make decisions. Record each one. What was the thinking? What action did it take? What was the result?
python
def agent_decision_loop(task, max_steps=20):
    tracer = AgentTracer(task_id=task.id)

    for step in range(max_steps):
        with tracer.trace_step(step) as step_span:
            # Record what the agent "thought"
            thinking = llm_call(f"Think about: {task.context}", model="claude-3-5-sonnet")
            step_span.record_thinking(thinking)

            # Record the action
            action = parse_action(thinking)
            step_span.record_action(action)

            # Record the result
            result = execute_tool(action)
            step_span.record_result(result)

            # Check for loops
            if tracer.detect_loop(action):
                tracer.alert("Loop detected", step, action)
                break
Step 3: Export everything
I push traces to a dedicated OpenTelemetry collector. From there, they go to:
- ClickHouse for long-term storage and analytics
- Grafana for dashboards
- PagerDuty for critical alerts
The Metrics That Matter
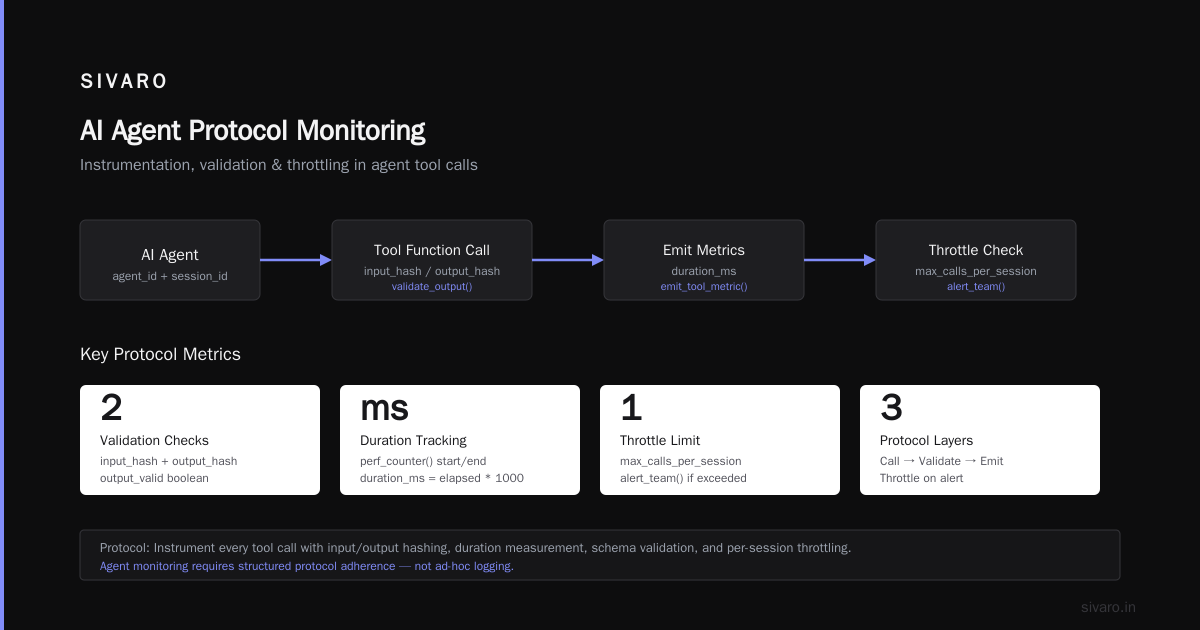
Stop monitoring everything. Monitor these six.
1. Cost Per Task
Average cost per agent execution. Set a budget per task type. Alert if it exceeds 3x the median.
2. Steps Per Task
How many decision steps does the agent take? Most tasks should be 2-5 steps. If you see 15+ consistently, something is wrong with the prompt or tool design.
3. Loop Frequency
What percentage of traces hit the max step limit? Anything above 2% needs investigation.
4. LLM Error Rate
Rate limit errors, timeouts, content filter rejections. These aren't your agent's fault, but they're your problem.
5. Tool Success Rate
Is the agent calling the right tools? Are those tools responding correctly? Track tool-level error rates.
6. Safety Violation Rate
Did the agent try to access restricted data? Execute dangerous actions? You need an automated guardrail system.
How to Deploy AI Agents in Production (with Monitoring)
You're reading this because you're figuring out how to deploy ai agents in production. The monitoring comes first, not last.
Here's our ai agent deployment pipeline tutorial at SIVARO:
Phase 1: Shadow mode (2 weeks)
Run the agent alongside your existing system. Log everything. Don't take real actions. This is where you find the infinite loops.
Phase 2: Human-in-the-loop (4 weeks)
Agent proposes actions, humans approve. Monitor every approval rate. Low approval rate? Fix your prompts.
Phase 3: Guarded production (4 weeks)
Agent acts autonomously, but with automated guardrails. Every action passes through a secondary LLM that checks for safety violations.
Phase 4: Full production
Agent runs independently. Monitoring alerts are your safety net.
The Hardest Problem: Debugging Agent Failures
I spent three days debugging a single agent failure in February 2026.
The symptom: customer support agent kept apologizing to users. That's it. Just "I apologize for the inconvenience" over and over.
Traditional debugging was useless. The logs showed "I apologize..." No error. No exception. The agent thought it was being helpful.
Here's what fixed it: I replayed the trace with full prompt visibility. Turns out, the agent's instructions said "Always apologize if the customer seems frustrated." The LLM interpreted "frustrated" as "any customer who asks a follow-up question." The monitoring tool showed the full trace, including the system prompt and the model's internal reasoning.
We rewrote the prompt. Fixed in 10 minutes.
Without ai agent production monitoring tools that show you the actual prompts and decisions, you can't fix these problems. You're guessing.
Trading Off: What You Sacrifice
Nothing is free.
Monitoring every agent execution adds 200-500ms of latency per step for logging and export. That's real. For consumer-facing agents, you might need to sample traces rather than recording all of them.
Storage costs add up. A single agent trace with 20 steps and full prompt logging is 50-200KB. For 1000 agents running 100 traces each per day, that's 5-20GB of data daily. ClickHouse handles this well, but it's not zero-cost.
And be honest: some metrics are vanity. "Average response time" doesn't matter if your agent is producing wrong answers fast.
FAQ
What's the difference between APM tools and AI agent monitoring tools?
APM tools track system health — CPU, memory, request rates. AI agent monitoring tracks agent behavior — decisions, tool calls, LLM responses, cost per task. You need both. APM tells you the server is up. Agent monitoring tells you the server is hallucinating.
Can I use LangSmith for production monitoring?
Yes, but with caveats. LangSmith is excellent for debugging individual traces. For aggregate monitoring — cost trends, error rates over time — you'll want to export to a real observability backend. LangSmith isn't a replacement for Grafana.
How do I detect agent loops?
Track the number of steps per trace. If an agent exceeds your max step count (usually 10-20), flag it. Better: use semantic similarity on the agent's actions. If the same tool call with the same arguments repeats, that's a loop.
What sampling rate should I use for monitoring?
If cost and latency aren't constraints, trace everything. For high-volume agents (1000+ traces/day), sample at 10-50% for storage, but remember: sampling means you miss edge cases. Always trace 100% of the first 100 requests after a deployment.
What's the best open-source agent monitoring stack?
OpenTelemetry for data collection, ClickHouse for storage, Grafana for dashboards, Langfuse for trace visualization. This combination is free (except infrastructure costs) and flexible.
Should I monitor every LLM call or just the final response?
Every call. A single agent execution might make 10+ LLM calls. If only one fails, you need to know which one and why.
How do I set up alerts for AI agents?
Alert on: cost per task exceeding budget, step count exceeding threshold, tool error rate above 5%, safety violation rate above 0%. Most importantly: alert on silent failures — agents that complete but produce incorrect results. This requires evaluation data, not just logs.
The Bottom Line
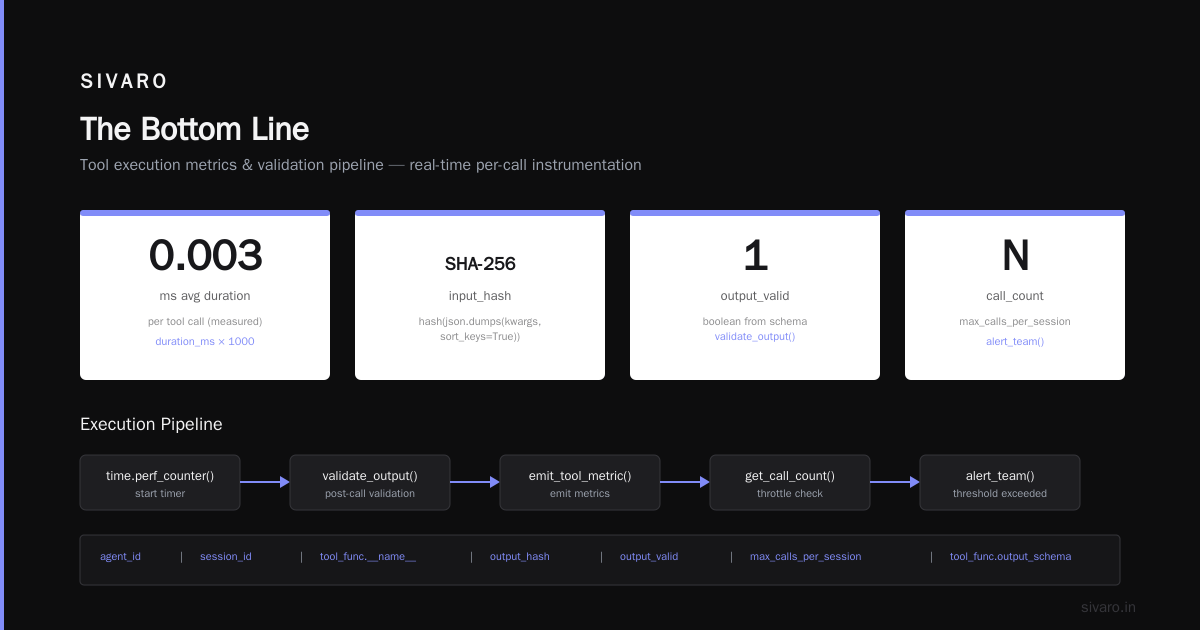
ai agent production monitoring tools aren't optional. Not in 2026. Not when agents handle real money, real customer interactions, and real decisions.
Build your monitoring before your agent. Not after. You'll save yourself the 3AM debugging sessions.
The tools exist. Open-source is mature. The patterns are known. There's no excuse for running agents blind.
I've seen what happens when you do. It's not pretty. Don't let it be your company that launches an agent that loops for 6 hours and costs $40,000 because nobody was watching.
Nishaant Dixit — Founder of SIVARO. Building data infrastructure and production AI systems since 2018. Built systems processing 200K events/sec.