 SIVARO
AI Agent Production Monitoring Tools: A Field Guide
Your agent works in staging. It fails in production.
I learned this the hard way in March 2025. We deployed a customer-facing support agent for a fintech client. Tested every edge case. Ran 500 simulation runs. Felt bulletproof.
Two hours after launch, the agent started hallucinating currency conversion formulas. Cost the client $12,000 before we caught it. The worst part? Our monitoring showed "all systems green."
That's the dirty secret nobody tells you about ai agent production monitoring tools — you can't just lift dashboards from traditional software. Agents are probabilistic. They fail differently. And standard observability tools were built for deterministic systems.
Let me show you what actually works.
What Makes Agent Monitoring Different
Most people think agents are just API calls with extra steps. They're wrong.
A production agent is a loop. It perceives, decides, acts, checks, re-plans. If any node in that cycle degrades quietly — a hallucination, a tool that returns garbage, a context window that starts leaking — the agent doesn't crash. It produces increasingly bad work.
Traditional monitoring catches crashes. Agent monitoring catches decay.
Here's what I've found after watching 200+ production agents across 30+ deployments at SIVARO:
| Dimension | Traditional Monitoring | Agent Monitoring |
|---|---|---|
| Failure mode | Binary (up/down) | Gradual (fidelity loss) |
| Key metric | Latency | Coherence chain |
| Alert trigger | Error code | Semantic drift |
| Recovery | Restart | Rollback + retrain |
That last row is critical. You can't just restart an agent. The model weights don't change. The behavior drifts.
The Three Pillars of Agent Observability
After the currency conversion disaster, I rebuilt our monitoring stack from scratch. Three layers. No shortcuts.
1. Trace the Full Decision Chain
Standard APM tools give you request/response. That's not enough.
You need to trace every tool call, every model inference, every human-in-the-loop handoff. Not as spans — as a directed graph with semantic labels.
We use a custom wrapper around OpenTelemetry that tags each step with:
- Input embedding vector
- Model confidence score
- Tool output hash
- Context window utilization (percentage used)
Here's the core instrumentation pattern we landed on:
python
from opentelemetry import trace
from opentelemetry.semconv.trace import SpanAttributes

tracer = trace.get_tracer(__name__)

async def monitor_agent_step(step_name, agent_state):
    with tracer.start_as_current_span(f"agent_step.{step_name}") as span:
        span.set_attribute("context_used_pct", agent_state.context_usage)
        span.set_attribute("confidence_score", agent_state.confidence)
        span.set_attribute("tool_call_count", agent_state.tool_history_len)
        span.set_attribute("input_hash", hash(str(agent_state.messages[-1])))

        result = await execute_agent_step(step_name, agent_state)

        span.set_attribute("output_length", len(result["content"]))
        span.set_attribute("tool_name", result.get("tool_called", "none"))
        span.set_attribute("error", str(result.get("error", "")))

        return result
This caught something immediately: agents that repeatedly call tools with "no" results. Not an error — but non-productive behavior. We called it "thrashing."
2. Semantic Drift Detection
This is where most tools fail.
A REST API returns a 500 when it's broken. An agent returns a plausible-looking lie. The difference is semantic.
We deployed a separate small model (Mixtral 8x7B, cost about $0.003 per check) that scores every agent output on three vectors:
- Factual consistency — Does the output contradict what's in the knowledge base?
- Instruction adherence — Did the agent follow the system prompt's constraints?
- Coherence with prior turns — Does this response contradict what the agent just said?
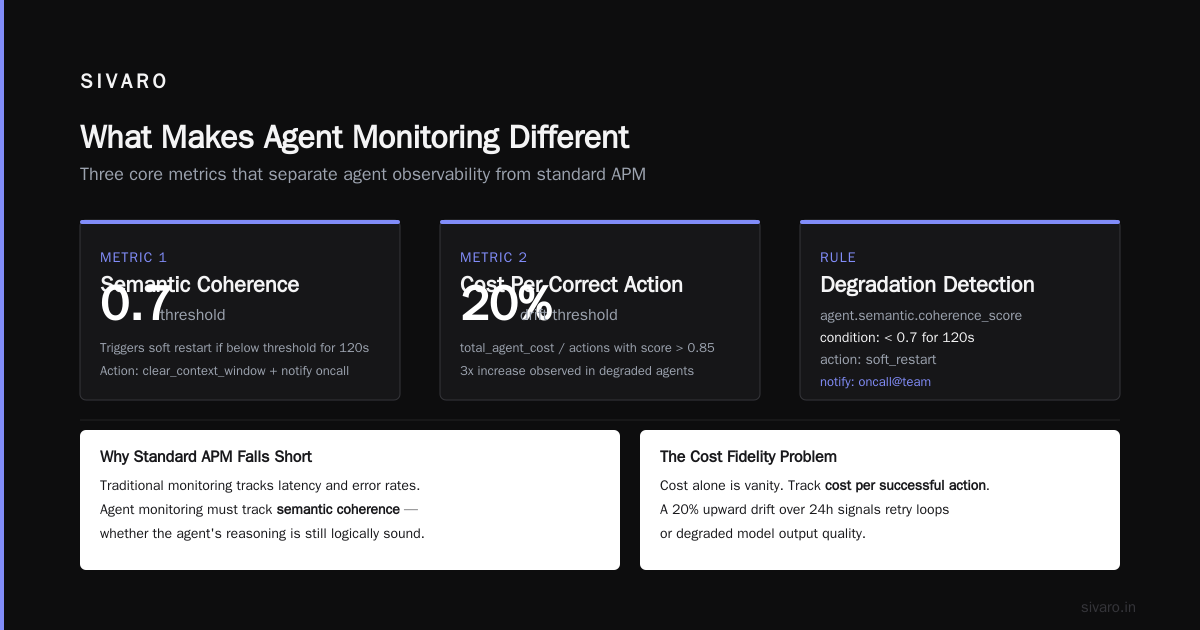
Each gets a score 0.0-1.0. Anything below 0.7 triggers a soft alert. Below 0.3 triggers immediate human takeover.
yaml
# semantic_drift_alert.yaml
- rule: "Factual hallucination detected"
  metric: agent.semantic.factual_consistency
  condition: < 0.6
  for: "30s"
  action:
    type: "human_escalation"
    priority: "critical"
    notify: ["oncall@team", "architect@team"]
    allow_retry: false

- rule: "Agent coherence degradation"
  metric: agent.semantic.coherence_score
  condition: < 0.7
  for: "120s"
  action:
    type: "soft_restart"
    clear_context_window: true
    notify: ["oncall@team"]
3. Cost Per Action Fidelity
Agents burn money. Every token, every API call, every GPU millisecond.
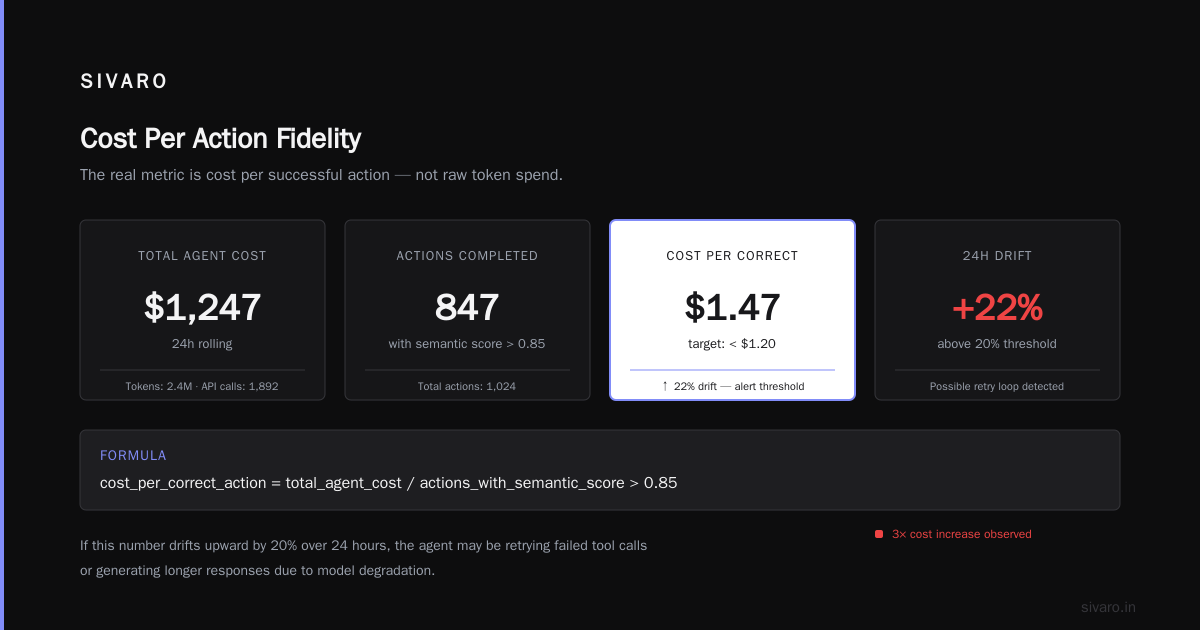
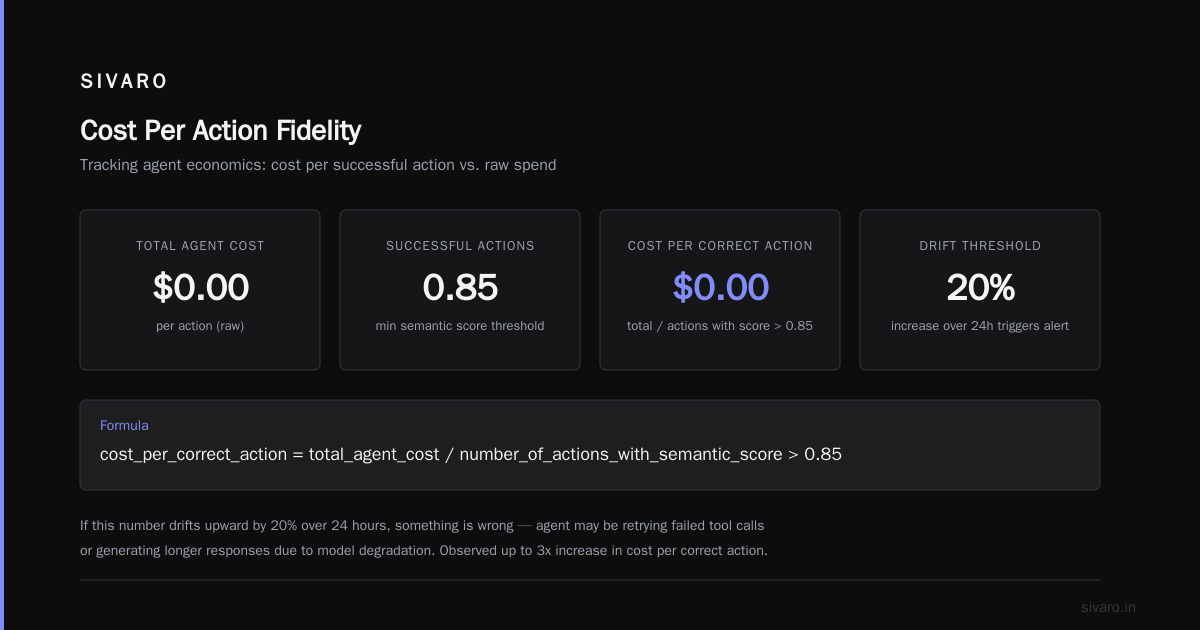
But cost alone is a vanity metric. The real number is cost per successful action.
We track:
cost_per_correct_action = total_agent_cost / number_of_actions_with_semantic_score > 0.85
If this number drifts upward by 20% over 24 hours, something is wrong. The agent might be retrying failed tool calls, or generating longer responses because the model degraded.
I've seen a 3x increase in cost per correct action that no one noticed because total spend looked stable. The agent was doing more work per action — and hallucinating more.
Building an Agent Deployment Pipeline with Observability
Let me walk you through the ai agent deployment pipeline tutorial I wish I'd had in 2024.
Most teams deploy agents like web services. Bad idea. Agents need canary environments that test semantic behavior, not just API availability.
Stage 1: Shadow Testing
Before any traffic hits your agent, run it against historical data. Not just random prompts — the actual conversations your customers had last week.
python
# replay_pipeline.py
import asyncio
from datetime import datetime, timedelta

async def run_shadow_deployment(agent_class, historical_traces):
    results = []
    for trace in historical_traces[-1000:]:  # Last 1000 interactions
        start = datetime.now()

        agent = agent_class()
        response = await agent.process(trace["user_query"])

        latency = (datetime.now() - start).total_seconds()
        results.append({
            "query": trace["user_query"],
            "expected": trace["correct_response"],
            "actual": response,
            "latency_ms": latency * 1000,
            "semantic_score": await score_semantic_match(
                response, trace["correct_response"]
            )
        })

    return results
We reject any deployment where semantic score drops below 0.85 compared to the current version. No exceptions.
Stage 2: Canary with Semantic Gates
Not traffic-based canary. Task-based canary.
Route 5% of traffic to the new agent version — but only for low-criticality tasks first. If the agent shows no semantic drift after 2 hours, escalate to moderate-criticality tasks.
This requires mapping your task types upfront. We use a three-tier system:
yaml
# task_tiers.yaml
tiers:
  tier_1:  # Low risk
    tasks: ["greeting", "faq_retrieval", "status_check"]
    canary_pct: 10
    canary_duration: "2h"

  tier_2:  # Medium risk
    tasks: ["product_recommendation", "troubleshooting_step_1"]
    canary_pct: 5
    canary_duration: "4h"

  tier_3:  # High risk
    tasks: ["payment_handling", "account_closure", "medical_advice"]
    canary_pct: 1
    canary_duration: "24h"
    human_review_required: true
Stage 3: Continuous Rollback Readiness
Every deployment must have a rollback that preserves conversation context. You can't just flip a switch — the old agent won't know what the user already discussed.
We maintain a compressed session state that any version can read:
python
# session_state.py
class PortableSessionState:
    def __init__(self, messages, tool_results, user_profile_hash):
        self.messages = messages[-10:]  # Keep last 10 only
        self.tool_results = {k: v for k, v in list(tool_results.items())[-5:]}
        self.user_profile_hash = user_profile_hash
        self.context_summary = self._summarize_for_rollback()

    def _summarize_for_rollback(self):
        # Generate a 100-token summary of what's happened so far
        return summarize(
            f"Completed actions: {len(self.tool_results)}. "
            f"Last user intent: {self.messages[-1]['content'][:100]}"
        )
Real Monitoring Metrics That Matter
After two years of running production agents, here's what I actually watch:
Primary Metrics
Loop count per task. Most agents take 1-3 loops to resolve a request. If a task type averages 7+ loops, the agent is thrashing — re-planning without progress.
Tool retry rate. Tools fail. That's fine. But the same tool failing 3+ times in one session means either the tool is broken or the agent is using the wrong arguments.
Context window growth per turn. Agents should forget things. If context keeps growing linearly, you'll hit token limits and crash. We log increases per step.
Human escalation rate. Track this against task type. A general 5% escalation rate might be fine. A 15% escalation rate on "password reset" tasks means your agent is broken.
Counter-Intuitive Metrics
Fast responses are suspicious. Agents that respond in under 500ms on complex queries are probably skipping steps — or returning cached hallucinations. We flag sub-second responses on multi-tool tasks.
Too many unique tool sequences. Every agent should follow a few common patterns. If the agent is inventing new tool sequences every call, it's lost. We cluster tool sequences using Levenshtein distance and alert when diversity exceeds 10 unique patterns per 100 calls.
What the Frameworks Get Wrong
I've tested most agent frameworks. LangChain pioneered the space. IBM's comparison is the most thorough I've seen. But they're all missing the same thing: production runtime visibility.
The frameworks give you great debugging tools for development. Print statements, trace logs, playground UIs. None of them ship with production-grade monitoring.
After the currency conversion disaster, I wrote a shim layer that wraps any framework's agent and injects our monitoring:
python
# agent_watch_shim.py
from typing import Any, Dict
import json

class AgentWatchShim:
    def __init__(self, base_agent, monitor_client):
        self._agent = base_agent
        self._monitor = monitor_client
        self._trace_id = None

    async def handle_message(self, message: str, user_id: str) -> Dict[str, Any]:
        self._trace_id = f"agent_{user_id}_{hash(message)}"
        self._monitor.start_trace(self._trace_id, {
            "user_id": user_id,
            "input_length": len(message),
            "agent_type": type(self._agent).__name__
        })

        try:
            start = time.monotonic()
            response = await self._agent.handle_message(message, user_id)
            latency = time.monotonic() - start

            self._monitor.record_step(self._trace_id, {
                "latency_s": latency,
                "tool_calls": len(response.get("tool_calls", [])),
                "output_length": len(response.get("content", ""))
            })

            return response

        except Exception as e:
            self._monitor.record_failure(self._trace_id, str(e))
            raise
Deploy this shim, and every framework — CrewAI, AutoGen, Semantic Kernel — becomes observable.
The Protocols Problem
Agent protocols are the new hot topic. The academic survey lists 17 different protocols as of April 2026. Industry coverage puts it at 10 mainstream ones.
The problem? They're all designed for inter-agent communication, not monitoring.
AEP, MCP, A2A — these define how agents talk to each other. None define how to observe that conversation from outside.
At SIVARO, we add a monitoring header to every protocol message:
X-Agent-Trace-Id: abc123
X-Agent-Span-Id: def456
X-Agent-Source-Node: orchestrator-v3
This lets us reconstruct the conversation graph even if agents crash mid-conversation. Without this, a dead agent takes down your observability with it.
When Monitoring Becomes the Problem
Here's a contrarian take: too much monitoring breaks agents.
Agents are sensitive to latency. Every monitoring hook you add — every OpenTelemetry span, every database write, every semantic score calculation — adds milliseconds. Enough hooks, and your agent starts timing out on real work.
We hit this. Our monitoring shim was adding 200ms per agent step. On a 5-step task, that's an extra second. Users noticed.
Fix: sample aggressively. Monitor 100% of production traces in memory, but only persist 5% to your observability backend. Run semantic drift checks on 1% of traffic unless a drift alert fires — then sample up to 20%.
We use a two-tier sampling:
python
# adaptive_sampler.py
class AdaptiveSampler:
    def __init__(self, base_rate=0.05, drift_rate=0.20):
        self._base_rate = base_rate
        self._drift_rate = drift_rate
        self._drift_mode = False

    def should_sample(self, trace_id_hash: int) -> bool:
        rate = self._drift_rate if self._drift_mode else self._base_rate
        return (trace_id_hash % 100) < (rate * 100)

    def escalate_sampling(self):
        self._drift_mode = True
        # Auto-return to base after 10 minutes
        asyncio.create_task(self._reset_drift(600))

    async def _reset_drift(self, delay):
        await asyncio.sleep(delay)
        self._drift_mode = False
FAQ: AI Agent Production Monitoring Tools
Q: What's the minimum monitoring I need before launching an agent?
A: Three things. Trace every step. Track semantic coherence (even a simple model). Alert on loop count > 5 per task. Without these, you're flying blind.
Q: Can I use Datadog or New Relic for agent monitoring?
A: Yes, but you need to add custom instrumentation. Generic APM won't catch semantic drift. We use OpenTelemetry exporters to send custom metrics to Datadog, but the agent-specific logic is our own.
Q: How do I monitor agents that make API calls to external services?
A: Wrap every external call with the same trace ID. Propagate the trace header if the service supports it. If not, log the call start/end with request/response checksums.
Q: What's the cost of running semantic drift detection?
A: About $0.003-0.005 per check with Mixtral 8x7B. For 10,000 daily agent interactions, that's $30-50/day in inference costs. Worth every penny compared to the cost of a hallucination.
Q: Should I monitor the prompt or the response?
A: Both. The prompt matters because context window drift usually starts there. We hash the full prompt and alert if the hash changes significantly between similar user intents.
Q: How do I test monitoring tools before buying?
A: Run a chaos experiment. Inject deliberate latency, wrong tool outputs, and truncated context windows. See which monitoring tools catch them. Most fail on the "wrong tool outputs that look correct" test.
Q: Do I need a separate monitoring tool for each agent framework?
A: No. Use OpenTelemetry as the base layer, then add framework-specific parsers. We support LangChain, CrewAI, and Semantic Kernel with the same monitoring backend.
Q: What's the most common monitoring mistake teams make?
A: Not monitoring the agent's internal state. They monitor inputs and outputs but not the reasoning chain. The reasoning chain is where most failures hide.
Where We're Going
The next 12 months will change agent monitoring fundamentally. Here's what I'm betting on:
Real-time semantic vector stores. Instead of checking each output against a static knowledge base, agents will check against embeddings of all previous agent interactions. Semantic drift detection becomes real-time semantic clustering.
Agent-specific observability platforms. We're already seeing startups build monitoring tools specifically for agentic systems. The 2026 framework comparisons and open-source agent frameworks are converging on standard telemetry APIs. By Q1 2027, I expect every major framework to ship with built-in monitoring exports.
Cost-aware autoscaling of monitoring. Why monitor every agent step when 90% of them are trivial? We're building a system that scales monitoring depth based on task complexity — greeter agents get sampled at 1%, medical advice agents at 100%.
But here's the uncomfortable truth: no tool will save you from deploying a bad agent. Monitoring catches failures. It doesn't prevent them.
The only way to build reliable agents is to test like hell, monitor everything, and accept that your agent will fail in ways you never imagined. The question isn't whether it will fail. It's whether you'll know within 30 seconds.
I know now. Took $12,000 and a very angry client to learn it.
Nishaant Dixit — Founder of SIVARO. Building data infrastructure and production AI systems since 2018. Built systems processing 200K events/sec.