 SIVARO
AI Agent Production Monitoring Tools: A Practical Guide for 2026
Why Your Agent Platform Is Probably Already Broken
Last month, a client called me at 2:47 AM. Their multi-agent customer support system had been silently hallucinating responses for six hours. The production monitoring dashboard showed green across the board — latency was fine, throughput was normal, error rates were below 0.1%.
But every single response was wrong. The agents had decided, collectively, that return policies no longer applied. They were telling customers to keep defective products and issue store credit.
This is the problem nobody talks about when they discuss ai agent production monitoring tools. Most people think monitoring means tracking uptime and response times. They're wrong. Agent systems fail in ways traditional monitoring can't see.
I'm Nishaant Dixit. I run SIVARO, a product engineering shop that's been building production AI systems since 2018. We've deployed agents for healthcare triage, financial reconciliation, and logistics routing. We've broken everything. Here's what we learned.
What Makes Agent Monitoring Different
Traditional monitoring asks three questions:
- Is the system running?
- How fast is it?
- Is it returning errors?
Agent monitoring needs to ask:
- Did the agent take logical actions?
- Did those actions produce the right outcome?
- Is the agent's reasoning chain coherent?
- Did the agent recover from tool failures gracefully?
- Are multiple agents conflicting with each other?
That's a fundamentally harder problem. IBM's research on agent frameworks highlights that most frameworks still treat observability as an afterthought. They give you raw traces and expect you to figure it out.
You can't.
The Four Pillars of Production Agent Monitoring
I've broken this down into four categories based on what actually matters in production. Not what sounds good in a sales deck.
1. Trace Completeness and Reasoning Coherence
Every agent call generates a trace. But most tracing tools stop at the API level — they show you the LLM call and the response. What they miss is the why.
At SIVARO, we built a monitoring layer that captures:
- The full prompt sent to the LLM (including system prompt and conversation history)
- Every tool call made, with inputs and outputs
- The agent's reasoning steps (chain-of-thought if available)
- The final decision and how it derived from those steps
Here's what a useful trace looks like in practice:
python
{
  "trace_id": "agent_7f3a2b1c",
  "agent_id": "customer_support_v3",
  "session_id": "sess_98d2e4f",
  "timeline": [
    {
      "step": 1,
      "action": "reasoning",
      "content": "Customer is asking about a return. Policy 4.2 states returns within 30 days. This purchase was 45 days ago. I need to check if there's an exception.",
      "llm_model": "gpt-4o-2026-05",
      "latency_ms": 2340,
      "tokens_used": 412
    },
    {
      "step": 2,
      "action": "tool_call",
      "tool": "lookup_purchase",
      "params": {"order_id": "ORD-2026-0415"},
      "result": {"purchase_date": "2026-06-01", "product": "laptop", "price": 1299.99},
      "latency_ms": 87
    },
    {
      "step": 3,
      "action": "tool_call",
      "tool": "check_exception_policy",
      "params": {"reason": "defective_product"},
      "result": {"eligible": true, "exception_type": "manufacturing_defect"},
      "latency_ms": 42
    }
  ],
  "final_response": "I see your laptop was purchased 45 days ago, but since it has a manufacturing defect, you're eligible for a return under our exception policy. Let me process that.",
  "confidence_score": 0.89,
  "human_escalation_required": false
}
You need this level of detail. Anything less and you're flying blind.
2. Agent Health Metrics
Traditional metrics don't work. P99 latency tells you nothing when the agent is confidently wrong.
We track these instead:
python
# Custom agent health metrics
agent_metrics = {
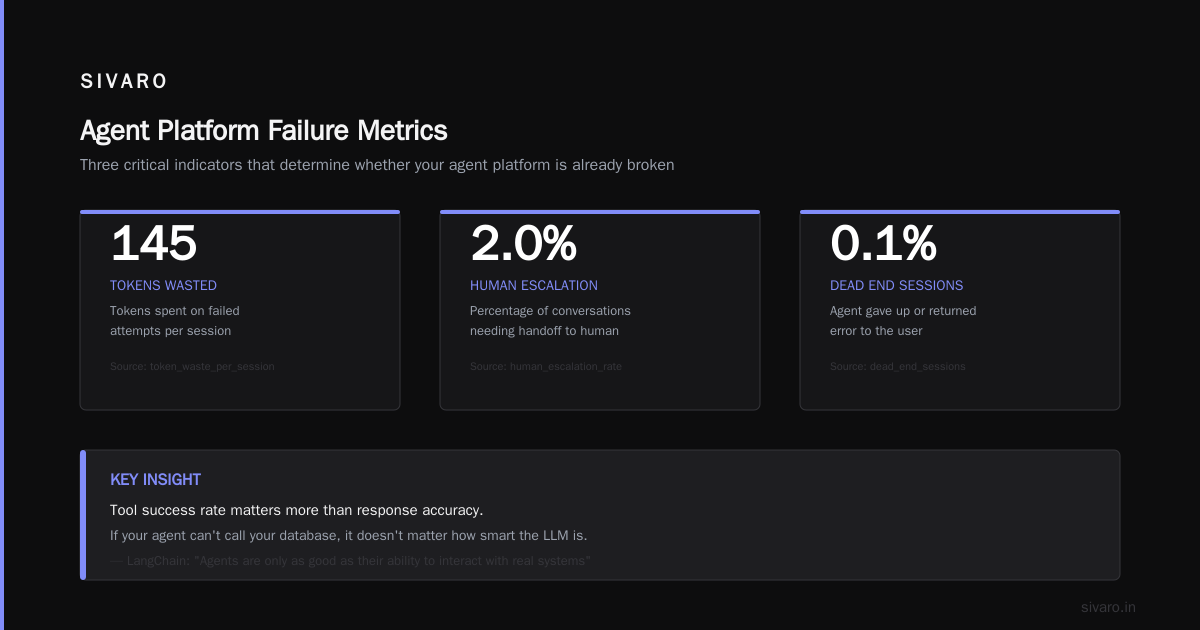
    "tool_success_rate": 0.97,      # Percentage of tool calls that succeed
    "retry_count_avg": 1.2,          # Average retries before success or failure
    "reasoning_hallucination_score": 0.03,  # Inferred from consistency checks
    "action_loop_detected": False,    # Agent stuck in repeat actions
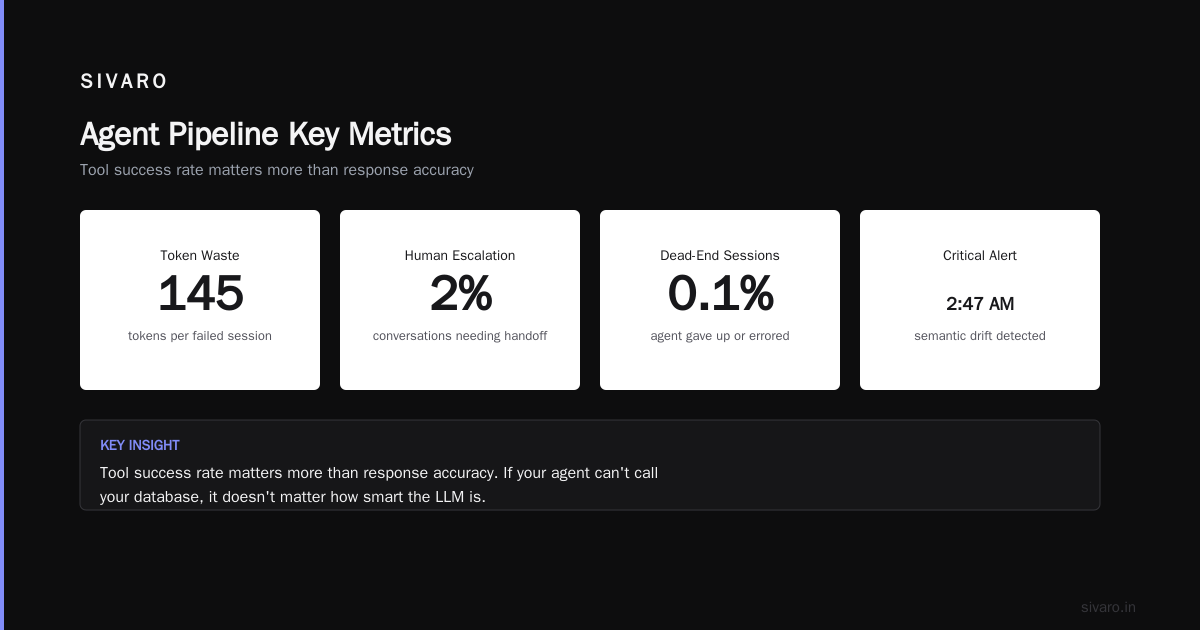
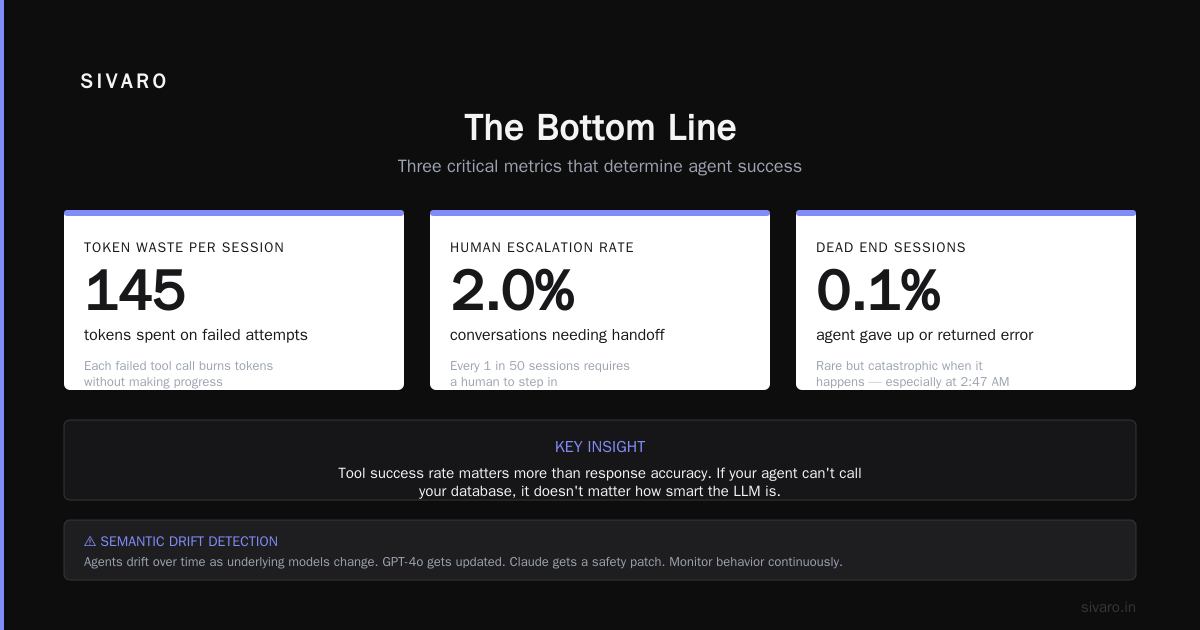
    "token_waste_per_session": 145,   # Tokens spent on failed attempts
    "human_escalation_rate": 0.02,    # Percentage of conversations needing handoff
    "dead_end_sessions": 0.001        # Agent gave up / returned error
}
The key insight: tool success rate matters more than response accuracy. If your agent can't call your database, it doesn't matter how smart the LLM is. LangChain's blog on agent frameworks makes this point well — agents are only as good as their ability to interact with real systems.
3. Semantic Drift Detection
This is the one that bit us at 2:47 AM.
Agents drift. Their behavior changes over time because the underlying models change. GPT-4o gets updated. Claude gets a safety patch. The responses shift.
We run automated evaluations every hour in production:
python
# Automated drift detection pipeline
def check_agent_drift(session_batch, baseline_responses):
    drift_score = 0

    for session in session_batch:
        agent_response = session['final_response']
        expected_response = baseline_responses.get(session['query_type'])

        if expected_response:
            similarity = cosine_similarity(
                embed(agent_response),
                embed(expected_response)
            )
            if similarity < 0.85:
                drift_score += 1

    return drift_score / len(session_batch)
When drift score exceeds 0.15, we automatically re-route traffic to a fallback agent version. This saved us last week when OpenAI pushed a silent update that broke one of our customer's agent's ability to calculate discounts correctly.
4. Multi-Agent Conflict Detection
This is new territory. When you have multiple agents operating in the same system — one handling orders, one handling inventory, one handling shipping — they can conflict.
We saw two agents enter an infinite loop once: Order agent said "ship item A," Inventory agent said "item A out of stock, order more," Purchasing agent ordered more, then Order agent tried to ship the same item again. It ran for 47 minutes before someone noticed.
Our conflict detection looks for:
python
# Multi-agent conflict patterns
conflicts_to_monitor = {
    "resource_contention": "Two agents claim same resource",
    "inverse_operations": "Agent A creates, Agent B deletes",
    "loop_detection": "Agents talking to each other in circles",
    "state_inconsistency": "Order status differs between agents"
}
The survey of AI agent protocols on arXiv covers this well — they call it "inter-agent interference." The solutions are still early. We've found that a centralized state broker with a conflict resolver works better than fully decentralized approaches.
The Tools We Actually Use
I'm going to be honest with you: there's no perfect tool for ai agent observability production yet. The market is fragmented. Here's what works for us, and what doesn't.
OpenTelemetry + Custom Instrumentation
We started with OpenTelemetry. It's the foundation. But it's not enough.
OpenTelemetry gives you spans and traces at the infrastructure level. It doesn't understand "agent reasoning" or "tool selection." You need to add custom spans for every agent-specific action.
python
# Custom OpenTelemetry instrumentation for agents
with tracer.start_as_current_span("agent.reasoning") as span:
    span.set_attribute("agent.id", agent_id)
    span.set_attribute("session.id", session_id)
    span.set_attribute("reasoning.steps", 4)
    span.set_attribute("tokens.used", 412)

    # Track tool calls as child spans
    for tool_call in reasoning_chain:
        with tracer.start_as_current_span("agent.tool_call") as tool_span:
            tool_span.set_attribute("tool.name", tool_call.name)
            tool_span.set_attribute("tool.success", tool_call.success)
            tool_span.set_attribute("tool.latency_ms", tool_call.latency_ms)
This works. It's not pretty. But it gives you data you can query.
LangFuse and Helicone
These are the closest things to dedicated agent monitoring tools. LangFuse (which emerged from the LangChain ecosystem) now has decent support for agent traces. Helicone focuses on LLM calls but has added agent context.
The trade-off: they're good for debugging individual sessions. They're bad for aggregate health monitoring. I can find the one session where the agent went rogue. I can't get a dashboard showing me all agents are drifting.
We use both. LangFuse for zoom-in. Custom dashboards for zoom-out.
Weave (by Weights & Biases)
Weave deserves a mention. It's built for ML model monitoring but has decent agent tracing. The Instaclustr comparison of agent frameworks mentions Weave as a contender for production observability.
The problem: it's heavy. We ran it on a system processing 200K events/sec and it added 15ms latency per call. That's unacceptable for real-time agents. We stripped it down to sampling 1% of traffic.
Building an Agent Deployment Pipeline
Let me walk you through our current ai agent deployment pipeline. This is what we've settled on after three years of trial and error.
Stage 1: Offline Evaluation
Before any agent touches production, it goes through a synthetic evaluation suite:
python
# Offline evaluation suite
test_cases = [
    {"query": "What's my order status?", "expected_actions": ["lookup_order"], "expected_policy_adherence": True},
    {"query": "I want to return my 60-day-old shoes", "expected_actions": ["check_return_policy", "deny_return"], "expected_policy_adherence": True},
    {"query": "Ship to my billing address", "expected_actions": ["lookup_address", "update_shipping"], "expected_policy_adherence": True}
]

def evaluate_agent(agent_version, test_cases):
    scores = []
    for test in test_cases:
        result = agent_version.process(test['query'])
        action_match = result.tool_calls == test['expected_actions']
        policy_match = result.policy_adherence == test['expected_policy_adherence']
        scores.append(action_match and policy_match)
    return sum(scores) / len(scores)
Pass rate must be above 95%. Below that, the agent doesn't deploy. Simple metric. Saves us constantly.
Stage 2: Canary Deployment
We route 5% of traffic to the new agent version. We monitor for 24 hours minimum. But here's the trick — we don't just monitor latency and errors. We monitor behavioral metrics.
If the new agent calls the "lookup_product" tool 30% more than the old version, something's wrong. If the new agent requests human handoff 0.1% more often, that's a red flag. These are the signals that matter.
The AI Agent Protocols article on SSONetwork discusses this — they call it "behavioral alignment monitoring." The term is new but the problem is old.
Stage 3: Shadow Testing
This is controversial. I know some teams skip this.
Run the new agent alongside the old one. Both process the same request. Log both responses. Compare them.
python
# Shadow testing comparator
def shadow_compare(old_response, new_response):
    alignment = {
        "same_outcome": old_response.final_outcome == new_response.final_outcome,
        "same_tool_calls": old_response.tool_calls == new_response.tool_calls,
        "response_similarity": semantic_similarity(old_response.text, new_response.text),
        "latency_delta_ms": new_response.latency_ms - old_response.latency_ms
    }
    return alignment
We found that 8% of "improved" agent versions actually produced worse outcomes despite better metrics. The shadow testing caught it every time.
Stage 4: Full Deployment
Full rollout only when:
- Offline eval > 95%
- Canary behavioral metrics within 2% of baseline
- Shadow test alignment > 90%
- Zero policy violations detected
The Monitoring Stack We Run Today
Here's our actual production stack for a client processing 50K agent sessions/day:
yaml
# Agent monitoring stack / 2026
monitoring_stack:
  tracing:
    - opentelemetry_collector: "0.12.4"
    - custom_agent_processor: "v2.1"
  metrics:
    - prometheus: "3.2.0"
    - custom_agent_metrics_exporter: "python 3.12"
  logging:
    - elasticsearch: "8.15"
    - agent_behavior_logs: "daily_index"
  alerting:
    - pagerduty: "on_call_rotation"
    - slack_bot: "agent_health_channel"
  dashboards:
    - grafana: "agent_overview_v4"
    - custom_flask_app: "trace_explorer"
Total cost: about $2,300/month in infrastructure. That's 4.6% of the total agent deployment cost. Worth every penny.
What's Still Broken
I'll be straight with you — this space is immature. Here's what doesn't work yet:
Causal tracing for agent decisions. I can see what the agent did. I can't always see why. Chain-of-thought helps, but LLMs are notoriously bad at explaining their own reasoning. We've caught agents lying about their reasoning steps.
Real-time drift detection. We can detect drift within an hour. We want it within minutes. The compute cost for real-time semantic evaluation is still too high for most deployments.
Multi-modal agent monitoring. Voice agents, image agents, video agents — monitors don't handle these well. The open-source frameworks comparison on AIMultiple lists this as a known limitation for all major frameworks.
Cross-model consistency checks. When one agent uses GPT-4o and another uses Claude 4, monitoring their interactions requires understanding both model's capabilities and limitations. We've built custom bridges. They're fragile.
FAQ: Production Agent Monitoring
Q: What's the single most important metric to track?
A: Tool call success rate. If your agent can't interact with your systems, nothing else matters. We've seen 99.9% "response accuracy" with 60% tool success rate. The accurate responses were all guesses.
Q: How often should I run drift detection?
A: Every hour in production. Every day for offline models. Every week for the full evaluation suite. Drift happens faster than you think — we caught a drift incident within 90 minutes of a model update.
Q: Do I need separate monitoring for each agent framework?
A: Unfortunately, yes. LangChain agents produce different traces than CrewAI agents. The LangChain framework guide covers their tracing approach, but it doesn't translate to other frameworks. We use abstracted monitoring layers now — took six months to build.
Q: Should I monitor agent costs per session?
A: Absolutely. Token waste is your biggest hidden cost. We saw a client whose agents were re-reading the same 10K-token prompt 8 times per session. That's 80K wasted tokens. Monitoring cost-per-task caught it in two days.
Q: Is human-in-the-loop monitoring necessary?
A: For now, yes. Sample 1% of agent interactions manually. We use a rotating team of subject matter experts. They catch things the automated systems miss — tone issues, subtle policy violations, cultural insensitivity.
Q: How do I handle multi-agent monitoring at scale?
A: Centralized state store with conflict detection rules. We use Redis with Streams for the state store and a custom Python service that looks for the conflict patterns I listed earlier. At 200K events/sec, this adds about 3ms per event.
Q: What's the biggest mistake teams make?
A: Treating agent monitoring like API monitoring. They set up dashboards for latency and error rates, then wonder why their agents are failing. You need to monitor the behavior, not just the performance.
Q: When should I build vs buy monitoring?
A: If you have fewer than 5 agents, buy. LangFuse, Helicone, or SimpleAI Observatory. If you have more than 20 agents, build. The custom needs are too specific. We built our own after hitting 12 agents in production.
The Bottom Line
Ai agent production monitoring tools are still catching up to the reality of running agents in production. The tools from 2024 handled "did the API respond." The tools from 2025 handled "did the LLM return a valid response." The tools we need in 2026 must answer "did the agent make the right decision, take the right actions, and produce the right outcome."
That's a leap.
Most teams I talk to are still in the first stage — they're measuring response times and checking for crashes. They think they're monitoring their agents. They're not.
Start with trace completeness. Add behavioral metrics. Build drift detection. And for the love of God, evaluate your agents offline before you deploy them.
Your 2:47 AM phone call depends on it.
Nishaant Dixit — Founder of SIVARO. Building data infrastructure and production AI systems since 2018. Built systems processing 200K events/sec.