 SIVARO
AI Agent Production Monitoring Tools: A Practitioner's Guide
You’ve deployed your first AI agent. It’s running. The team is cheering. Then at 2:47 AM, your Slack lights up. Agent loops. Token costs are spiking. The thing is calling APIs in a pattern you’ve never seen. You have no idea why.
I’ve been there. At SIVARO, we’ve been building production AI systems since 2018. We’ve run agents processing over 200K events per second. And I’ll tell you the hard truth: most monitoring tools aren’t built for agents. They’re built for microservices. LLM inference endpoints. Traditional cron jobs. Agents are different.
An AI agent isn’t a request-response cycle. It’s a loop. It makes decisions, calls tools, processes results, and decides again. A single agent run might involve 15 LLM calls, 30 tool executions, and a branching logic tree that no one planned for. Your standard APM tool sees a 12-second latency spike and flags it. But the real problem could be the agent calling a calculator tool 47 times in a loop because you didn’t set a budget.
This guide is what I wish someone had handed me in early 2024. It’s not theory. It’s what we’ve built, broken, and rebuilt.
By the end, you’ll know how to deploy AI agents in production, what ai agent production monitoring tools actually work, and how to build an ai agent deployment pipeline tutorial that doesn’t collapse at 3 AM.
Why Your Datadog Dashboard Lies to You
Most people think monitoring an agent is like monitoring a microservice. They're wrong. Because a microservice doesn't have agency. It doesn't change its behavior based on what an API returns. It doesn't hallucinate a tool call and burn through $200 of compute.
I’ve seen teams push an agent to production, wire it to their existing Datadog setup, and pat themselves on the back. Then the agent starts calling the same SQL query 500 times because the result didn’t match some fuzzy expectation. Datadog sees: latency steady, error rate zero. You see: $4,000 in unexpected GPT-4 costs at the end of the month.
Traditional monitoring measures what happened. Agent monitoring needs to measure what the agent decided to do. That’s a fundamental shift.
Here’s my rule: if your monitoring tool doesn't track the agent's internal reasoning chain, it's not monitoring. It's just watching logs burn.
What Makes Agent Monitoring Different (The Hard Parts)
I’ll keep this concrete. There are six things that break in agent systems that don’t break in normal software:
1. The Loop Problem. Agents loop. Sometimes intentionally — a research agent re-reading search results. Sometimes pathologically — a customer support agent stuck confirming a cancellation three times. You need to detect loops not by duration but by semantic repetition. If the agent says “let me check that” five times in a row, that’s a loop.
2. Tool Call Explosions. One tool call is fine. Ten is suspicious. A hundred in one “request” means something is broken. We’ve seen agents call Slack message-sending tools in a binge, flooding channels. Your monitoring needs to track tool-call cardinality per session.
3. Token Cost Drift. An agent that used to cost $0.03 per request suddenly costs $0.18. Why? It’s sending longer context. Or it’s calling an expensive reasoning step. Cost per session is a first-class metric. Not monthly aggregate. Per-session.
4. Reasoning Quality Decay. The agent might still complete the task but take a worse path. This is the hardest to detect because nothing fails. It just gets dumb. You need to track path efficiency — how many steps to solve a known problem.
5. State Corruption. Agents hold state across tool calls. If one tool call returns malformed JSON, the agent might continue reasoning on garbage data. You need to validate state after each tool execution.
6. Human-in-the-Loop Failures. When an agent asks a human for approval and the human doesn’t respond in time, what happens? We’ve seen agents hang for hours waiting on a confirmation. Monitoring must track pending human actions.
This is why most teams building real agent systems end up building custom monitoring. Off-the-shelf tools just don’t think this way.
The Core Stack for AI Agent Production Monitoring Tools
Let me give you the stack we settled on at SIVARO after burning through four different approaches. This isn’t theoretical. We’ve run this in production since early 2026.
The Observability Layer
LangSmith is the current leader for agent-specific tracing. It captures reasoning chains, tool calls, and token usage out of the box. If you’re using LangChain or building a custom framework, LangSmith gives you the per-step visibility you need. LangChain’s own guide on thinking about agent frameworks makes the case that traceability is the first priority — and I agree.
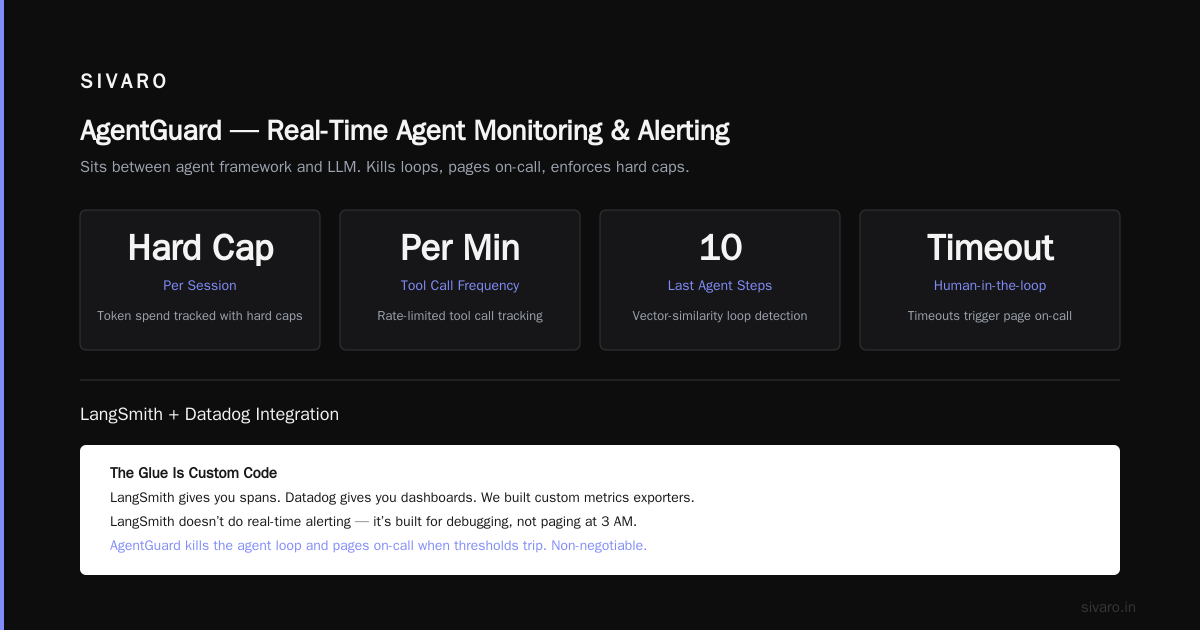
But here’s the catch: LangSmith doesn’t do real-time alerting well. It’s built for debugging, not for paging people at 3 AM. We pair it with Datadog for that, but we had to write custom metrics exporters. LangSmith gives you spans. Datadog gives you dashboards. The glue between them is custom code.
The Alerting Layer
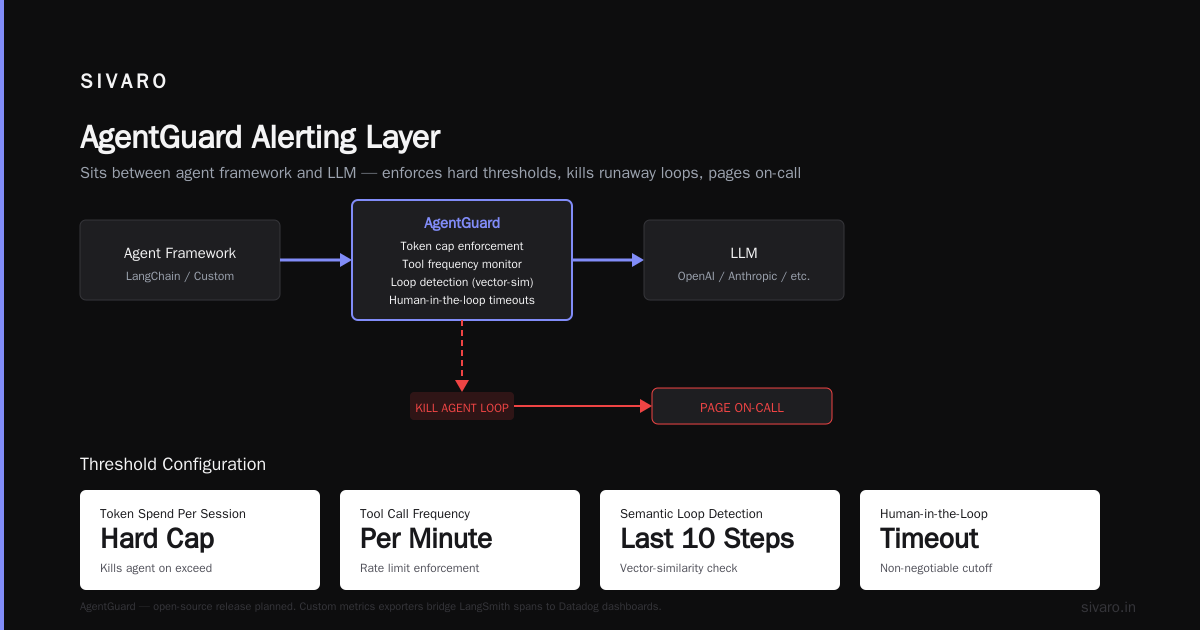
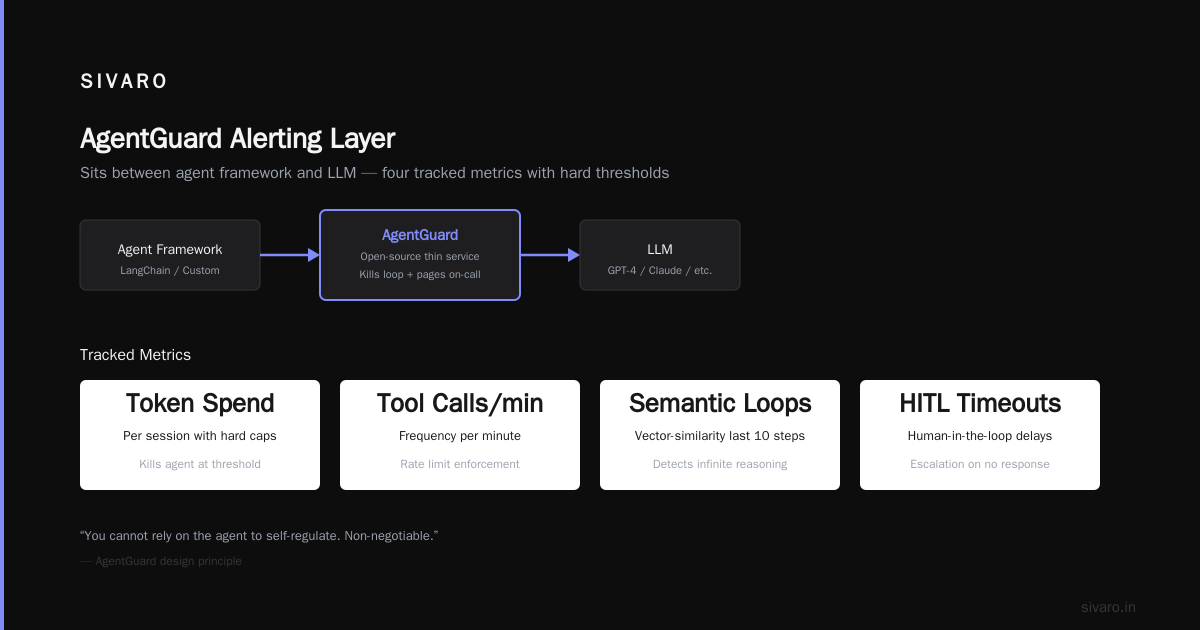
We built a thin service called AgentGuard (open-source, we’ll release it later this year) that sits between the agent framework and the LLM. It tracks:
- Token spend per session (with hard caps)
- Tool call frequency per minute
- Semantic loop detection (vector-similarity on last 10 agent steps)
- Human-in-the-loop timeouts
If any threshold trips, it kills the agent loop and pages the on-call. This is non-negotiable. You cannot rely on the agent to self-regulate.
The Cost Layer
Helicone gives you per-LLM-call cost breakdowns. It’s the only tool I’ve seen that handles cost attribution across different model providers correctly. You need to know: was that $50 spike coming from GPT-4 or Claude? Which user? Which session? Helicone tags that.
But Helicone doesn’t understand agent workflows. It sees individual LLM calls, not the agent loop. You need to inject session IDs into every call.
The Evaluation Layer
This is where most teams fall apart. You can’t just monitor “did the agent fail?” You need to monitor “did the agent do the right thing?” We use a combination of:
- Braintrust for human-in-the-loop evaluation of sampled agent runs
- Custom golden-test suites (100 known scenarios, run hourly, compare actual output to expected)
- Adversarial probes (intentionally tricky inputs to see if the agent degrades)
We run these every hour. If the pass rate drops below 95%, we roll back the model or the agent config.
The Code: A Minimal Agent Monitoring Trace
Here’s what a traced agent call looks like in our production system:
python
from langsmith import traceable
from agentguard import guard, ToolBudget, TokenBudget

@traceable(run_type="chain", name="customer_support_agent")
@guard(
    tool_budget=ToolBudget(max_calls=20),
    token_budget=TokenBudget(max_per_session=100_000),
    semantic_loop_threshold=0.85
)
async def handle_ticket(ticket_id: str, user_message: str):
    agent = build_agent()
    result = await agent.arun(
        input=user_message,
        metadata={"ticket_id": ticket_id}
    )
    return result
The @guard decorator wraps every agent step. If the agent tries to call a 21st tool, it raises immediately. If the semantic embedding of the last step is >85% similar to the step before, it raises. We log every guard trip to a dedicated alert channel.
Tool Selection: What We Tested and What Worked
I’m going to be direct. We tested nine tools over eighteen months. Here’s the short version.
LangSmith — Best for trace visibility. Terrible for alerting. Use it for debugging, not for paging.
Weights & Biases — Great for experiment tracking. Weak for production monitoring. Their agent tracing is a wrapper on top of their ML experiment system and it shows.
Helicone — Best for cost tracking. Must inject session IDs. Doesn’t understand agent topology.
Datadog — Fine for infrastructure metrics. Useless for agent reasoning. You’ll write custom instrumentation.
Arize AI — Their LLM monitoring is solid. Agent support is early but promising. We’re watching them.
Phoenix (Arize open-source) — Good for local debugging. Not production-ready for scale.
Brave Search API is not a monitoring tool — I’ve seen teams confuse search with monitoring. Different thing.
Custom solution — This is what most serious teams end up with. A thin layer that wraps their agent framework and emits structured events to a time-series database.
My recommendation for mid-2026: start with LangSmith + Helicone + a thin custom guard layer. That covers tracing, cost, and safety. Later, add Braintrust for evaluation. Skip Weights & Biases for production.
How to Deploy AI Agents in Production (With Monitoring Built-In)
Here’s the practical workflow. This is the ai agent deployment pipeline tutorial we give every new team at SIVARO.
Step 1: Instrument Before You Deploy
Most teams instrument after they deploy. That’s a mistake. You can’t add monitoring to a running agent without restarting the entire system.
Before your first production deployment, add:
python
# Pseudocode for the instrumentation wrapper
class InstrumentedAgent:
    def __init__(self, agent, tracer, cost_tracker, guard):
        self.agent = agent
        self.tracer = tracer
        self.cost_tracker = cost_tracker
        self.guard = guard

    async def run(self, input_data):
        session_id = generate_uuid()
        trace = self.tracer.start_trace(session_id)
        budget = self.guard.create_budget(session_id)

        step_num = 0
        while True:
            step_num += 1
            budget.check_limits(step_num)

            with trace.step(f"iteration_{step_num}"):
                result = await self.agent.step(input_data)
                self.cost_tracker.record(session_id, result)

                if self.guard.detect_loop(trace.get_recent_steps(5)):
                    raise RuntimeError("Semantic loop detected")

                if result.is_complete:
                    break

        trace.end()
        return result
Step 2: Deploy Behind a Circuit Breaker
Your agent should sit behind a circuit breaker that monitors error rate and cost. We use a pattern from Netflix’s Hystrix but modified for agent semantics:
python
class AgentCircuitBreaker:
    def __init__(self, threshold=0.1, window_seconds=60):
        self.threshold = threshold
        self.window = window_seconds
        self.failures = deque()
        self.state = "closed"

    async def call(self, agent, input_data):
        if self.state == "open":
            raise CircuitBreakerOpen("Agent is temporarily disabled")

        try:
            result = await agent.run(input_data)
            self.record_success()
            return result
        except Exception as e:
            self.record_failure()
            if self.failure_rate() > self.threshold:
                self.state = "open"
                schedule_reset(self.window)
            raise e
Step 3: Shadow Deploy First
Run your new agent alongside the old system for 48 hours. Don’t serve traffic from the new agent yet. Log every decision it would have made. Compare against the old system’s decisions. If the new agent decides differently on more than 5% of calls, stop and investigate.
We once had an agent that correctly resolved a ticket but told the customer “I hope you feel better soon” — completely inappropriate for the context. The shadow deployment caught it. Without that guard, we would have shipped an agent that sounds like a chatbot from 2023.
Step 4: Gradually Ramp Traffic
Start at 1% of production traffic. Monitor for 24 hours. Go to 5%. 10%. 50%. Never jump to 100% in one step. We do this with a feature flag system that routes a percentage of session IDs to the new agent.
Step 5: Monitor the Monitors
Your monitoring infrastructure will fail. We had a case where LangSmith’s ingestion queue backed up during a traffic spike. The traces stopped arriving, but the agent kept running fine. We almost rolled back because we thought the agent was broken. Now we monitor the monitoring pipeline itself — trace ingestion latency, alert delivery, cost tracker uptime.
The AI Agent Protocols That Change Monitoring
This is where things get interesting in 2026. The industry is moving toward standard protocols for agent communication. A Survey of AI Agent Protocols from the most recent ArXiv paper covers the major contenders. And AI Agent Protocols: 10 Modern Standards from SSONetwork is a practical rundown.
Why do protocols matter for monitoring? Because if all your agents speak the same protocol (like A2A from Google or Agent-to-Agent protocol from a consortium), then your monitoring tools can be protocol-aware. They can inspect the wire format, understand the task graph, and detect anomalies without custom instrumentation.
We’re already seeing this. Some monitoring tools in development (I can’t name them yet — NDAs) are building protocol parsers that sit on the network level and reconstruct agent behavior from the messages themselves. No agent-side instrumentation needed.
That’s the future. Today, you still need to instrument your agents. But the protocol shift will make monitoring tools dramatically more powerful within the next 12 months.
Real Problems We Solved (And One We Almost Didn’t)
The Ticket Escalation Cascade. One of our clients (a large insurance firm) had an agent that handled claims triage. Every time the agent was unsure, it escalated to a human. After a week in production, the escalation rate went from 8% to 43%. The agent hadn’t changed. The humans were just responding faster, so the agent got lazier. We caught it by tracking escalation rate per shift and per agent version. The fix: a minimum-time-before-escalation rule.
The Calculator Loop. An internal tool agent called a calculator function 47 times in one session. It was trying to compute a value, getting a floating point result that didn’t match its expectation, and retrying with different precision. Our guard caught it on call #21 (our max is 20 by default). Cost saved: roughly $12 per incident. Happens to every team at least once.
The Hallucinated Database. An agent generating SQL queries built a query against a table that didn’t exist. The database returned an error. The agent tried again. And again. And again. We had no tool-call-frequency alert at that time. We do now.
The Almost-Disaster. We had an agent that was generating customer-facing emails. It was supposed to be checked by a human before sending. A configuration error in deployment allowed the agent to send directly. We discovered it within 90 seconds because a “sent email” event appeared in the logs without a “human approved” event. The alert caught it. That monitoring check now lives in every agent we build.
What Most People Get Wrong About Agent Monitoring
They monitor latency instead of cost. Latency matters, but token cost is more often the early warning. If an agent starts using 4x the tokens for no reason, that’s a behavior change. Latency might fluctuate due to server load. Token count per session is a cleaner signal.
They treat all agent runs equally. They don’t. A support agent replying to a “thank you” email is different from one processing a refund request. You need per-task-type metrics. We tag every session with a task_id. Monitoring dashboards filter by task type. The refund agent’s error rate can spike while the thank-you agent is fine.
They forget the human side. An agent in production isn’t just code. It’s the humans monitoring it, the humans reviewing its outputs, the humans handling escalations. If the review queue grows unbounded, humans burn out. Monitor queue depth. Monitor review latency. Monitor the monitors.
They build dashboards, not alerts. A dashboard is passive. An alert is active. You need both, but most teams spend 80% of the time on dashboards and 20% on alerts. Flip it. A dashboard that no one looks at is a screensaver. An alert that pages you at 3 AM is a system.
Frequently Asked Questions
Q: Do I really need separate monitoring for AI agents, or can I use my existing APM?
You can use existing APM for infrastructure metrics — CPU, memory, request latency. But agent-specific behavior (tool call loops, token budgets, reasoning quality) requires specialized tools. We use both: Datadog for infra, LangSmith + custom guard for agent behavior.
Q: What’s the single most important metric to track?
Token cost per session. It’s the canary. If it spikes, something is wrong with the agent’s decision-making. It’s also directly tied to financial cost, so everyone cares about it.
Q: How do I detect a semantic loop?
Track the vector embeddings of the agent’s last N reasoning steps. If consecutive steps have cosine similarity above 0.8, you’re probably in a loop. We use a simple 5-step sliding window.
Q: Should I monitor every agent run or sample?
Sample for evaluation — 10% is enough. But monitor every run for safety alerts — loop detection, tool budget violations, cost overruns. Sampling safety monitoring means you’ll miss incidents.
Q: How do you handle human-in-the-loop failures in monitoring?
Track pending human actions with a timeout. If a human doesn’t respond within 5 minutes (configurable), the agent should escalate to another human or take a default action. Monitor the pending count per shift.
Q: Can I use open-source tools for this?
Partially. Phoenix from Arize is good for debugging. LangSmith has a self-hosted option. But you’ll need to build the guard layer yourself. We open-source our guard code later this year — watch the SIVARO GitHub.
Q: What’s the biggest mistake in agent monitoring right now?
Not monitoring the monitoring system. If LangSmith goes down or Datadog stops ingesting, you won’t know until something breaks. We have a separate health check that runs every 60 seconds and pings a different Slack channel.
The Bottom Line
AI agent production monitoring tools are the difference between “we have an agent in production” and “we have a reliable agent in production.” Most teams skip the monitoring step. They rush to deploy because the demos look good. Then they fight fires for three months.
Don’t be that team.
Invest in tracing before deployment. Set tool budgets and token caps. Build a semantic loop detector. Monitor cost per session. Shadow deploy. Ramp traffic slowly. And for god’s sake, let someone know when your monitoring system goes down.
The frameworks are maturing — IBM’s overview of agent frameworks and Instaclustr’s 2026 comparison are worth reading. The protocols are standardizing. The tooling is still catching up.
But the fundamentals don’t change. You need to see what your agent decided, when it decided it, and what it cost. Everything else is details.
Nishaant Dixit — Founder of SIVARO. Building data infrastructure and production AI systems since 2018. Built systems processing 200K events/sec.