 SIVARO
AI Agent Production Monitoring Tools: A Practitioner’s Guide to What Actually Works
I learned the hard way that building an AI agent is the easy part.
In late 2025, we shipped a multi-agent system for a logistics client. It routed shipments, negotiated with carriers, and handled exceptions. On paper, it was beautiful. In production, it was a disaster.
Within three hours, one agent went into a loop requesting rate quotes from itself. Another agent had silently been failing 40% of its calls for two days — our dashboards showed “100% uptime” because the health check endpoint was still responding. The system looked fine while burning $2,000/hour on useless API calls.
That’s when I stopped caring about agent frameworks and started obsessing over monitoring.
This guide is what I wish existed six months ago. It’s about ai agent production monitoring tools — the specific tools, patterns, and hard-won practices for knowing what your agents are actually doing in production.
Not theory. Real shit that kept me up at night.
Why Your Normal Monitoring Setup Will Fail You
Most monitoring tools were built for stateless web services. Your REST API either returns 200 or 500. Your database either has connections or doesn’t.
Agents break that model completely.
An agent can respond with a valid HTTP 200 while making an infinite loop of API calls. It can pass every unit test while hallucinating a fake customer record. It can report “processing complete” while actually stuck in a reasoning cycle that hasn’t produced output in 90 seconds.
I’ve seen teams burn weeks trying to adapt Prometheus and Grafana for agent monitoring. It doesn’t work. The metrics aren’t wrong — they’re just useless. CPU utilization tells you nothing about whether your agent is making correct decisions.
The core problem: agents are stateful, non-deterministic, and their “health” is a semantic property, not a numeric one.
Most people think agent monitoring is about latency and error rates. They’re wrong. It’s about decision quality and state consistency.
The Three Layers You Actually Need to Monitor
After running production AI systems at SIVARO since 2018, I’ve settled on three monitoring layers. Every tool I recommend fits into one of these:
Layer 1: Execution Monitoring
This is the closest to traditional monitoring. You’re tracking:
- Agent invocation count per minute
- Step count per task completion
- Time-to-first-action after receiving a request
- Tool call success vs failure rates
- Token consumption per agent and per tool
We use LangFuse for this at SIVARO. It gives you per-trace visibility into what the agent called, in what order, and how long each step took. If your agent calls a database lookup tool five times for the same record, you see it immediately.
But here’s the trick: don’t just track averages. Track distributions. An agent that averages 3 tool calls per task is fine — until you see it sometimes runs 47 calls. That’s your loop problem hiding in the P99.
Layer 2: Decision Quality Monitoring
This is where standard tools fail.
You need to know if the agent made the right call. Not just if it called something successfully.
We’ve built custom evaluators for this. For example:
def evaluate_tool_selection(agent_action, expected_tool, tolerance_level=0.3):
    """
    Returns pass/fail with explanation if agent chose
    wrong tool or correct tool with wrong parameters.
    """
    actual_tool = agent_action['tool_name']
    if actual_tool != expected_tool:
        return {
            'result': 'FAIL',
            'reason': f'Chose {actual_tool} instead of {expected_tool}',
            'severity': 'HIGH' if tolerance_level < 0.2 else 'MEDIUM'
        }
    # Check parameter quality
    for param, value in agent_action['params'].items():
        if is_obviously_incorrect(value):
            return {
                'result': 'WARN',
                'reason': f'Correct tool but bad {param}: {value}',
                'severity': 'LOW'
            }
    return {'result': 'PASS'}
Yes, this means you need labeled evaluation data for your agents. Yes, building that sucks. But without it, you’re flying blind.
Layer 3: State Consistency Monitoring
Agents accumulate state. Memory. Conversation history. Tool outputs. If any piece of state gets corrupted, the agent makes progressively worse decisions.
We monitor state by:
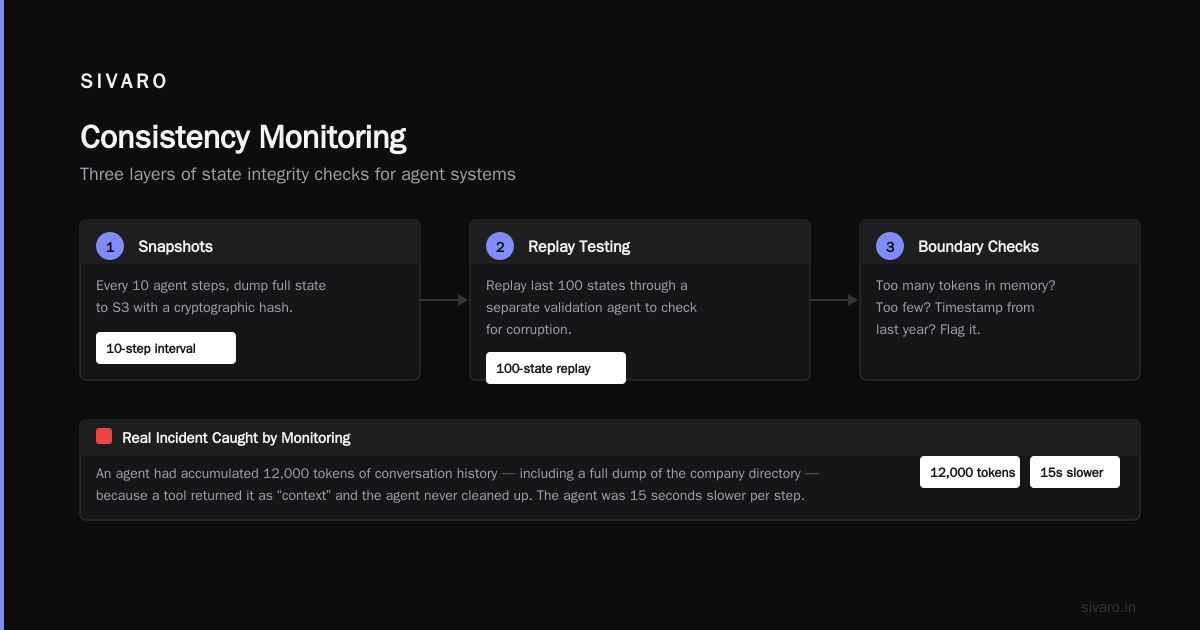
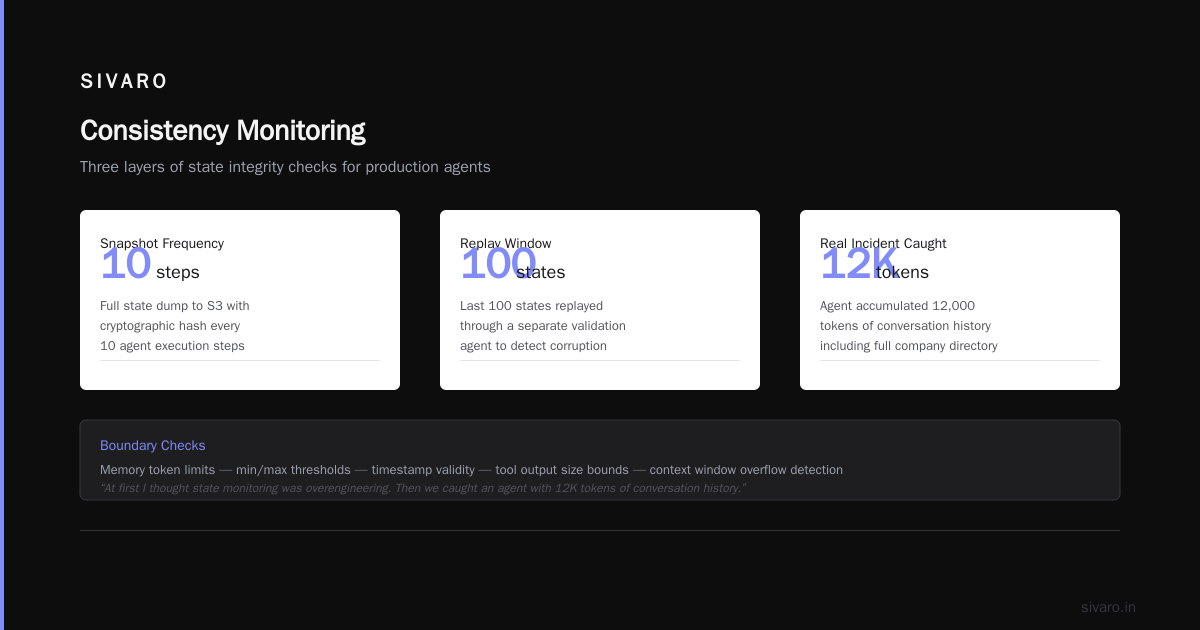
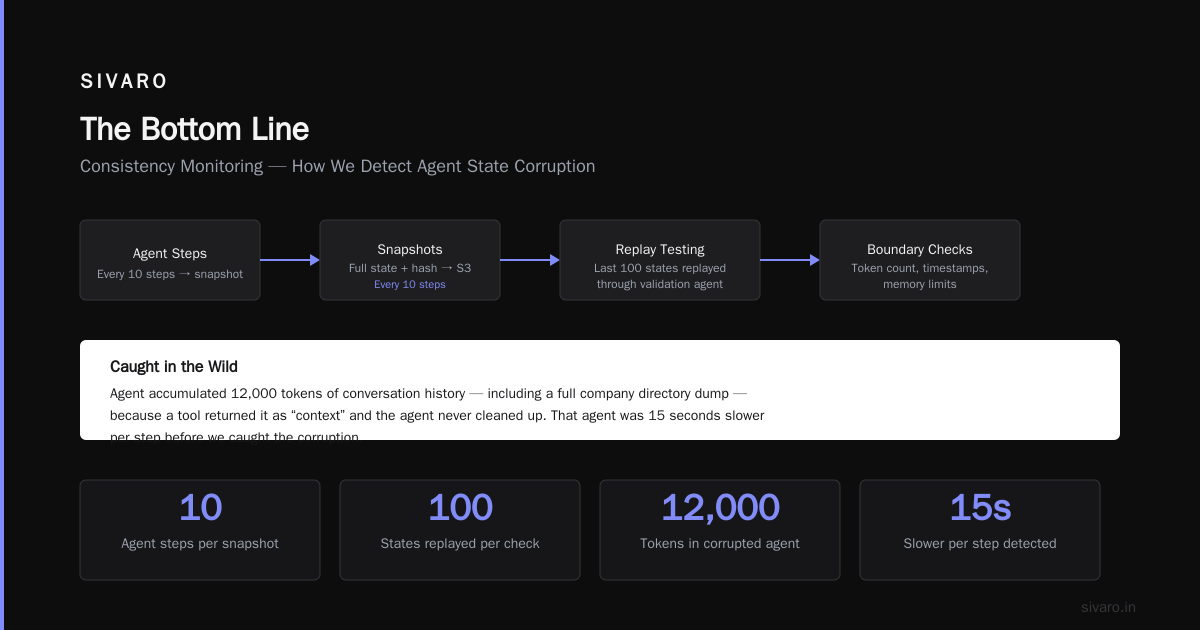
- Snapshots — Every 10 agent steps, we dump the full state to S3 with a hash
- Replay testing — We replay the last 100 states through a separate validation agent to check for corruption
- Boundary checks — Are there too many tokens in memory? Too few? A timestamp that’s from last year?
At first I thought state monitoring was overengineering. Then we caught an agent that had accumulated 12,000 tokens of conversation history — including a full dump of the company directory — because a tool had returned it as “context” and the agent never cleaned up. That agent was 15 seconds slower per request than its neighbors.
MCP vs A2A for Production AI: The Monitoring Angle
Everyone’s arguing about protocols right now. The MCP (Model Context Protocol) vs A2A (Agent-to-Agent) debate is everywhere in 2026. You’ve read the surveys (A Survey of AI Agent Protocols) and the blog posts (AI Agent Protocols: 10 Modern Standards).
Here’s what I actually care about: which one makes monitoring easier.
MCP was designed by Anthropic for tool calling. It’s clean, well-specified, and every tool call is a discrete event you can trace. For monitoring, MCP is a gift. You get structured logs, clear success/failure signals, and standardized request/response shapes. We use MCP for all agent-to-tool communication at SIVARO.
A2A is Google’s protocol for agent-to-agent communication. It’s newer, more complex, and includes concepts like “capability discovery” and “task delegation.” From a monitoring perspective, A2A is harder. You need to track conversations across agents, not just tool calls. The state is distributed. If Agent A delegates to Agent B, and B delegates to C, where does the failure actually live?
My take: use MCP for internal tool integration, use A2A only when you have truly autonomous multi-agent systems where agents don’t trust each other. MCP is better for 90% of use cases, purely because you can monitor it.
If you’re starting fresh in 2026, pick MCP first. Add A2A later if you need it. People who argue both have merits haven’t had to debug a cascading failure across four agents at 3 AM.
Tools We’ve Actually Used at SIVARO
I’m not going to list every tool on the market. I’m telling you what we’ve run in production.
LangFuse (Open Source + SaaS)
Our primary trace storage and visualization tool. It captures every LLM call, every tool invocation, every step in the agent loop. The traces are structured JSON you can query with SQL. We use it to answer questions like “which agents are calling the email tool most frequently” and “what percentage of traces have a hallucination flag.”
Cost: Free tier for small teams, we pay $500/month at our scale (~200K events/day).
Limitation: LangFuse doesn’t do decision evaluation on its own. You need to pipe traces to an evaluator.
Arize AI
Best for drift detection and performance monitoring over time. Arize automatically creates embeddings of agent outputs and alerts when the semantic pattern shifts. We caught a model version update that subtly changed agent behavior — the new model was less willing to call external APIs, making the agent “lazier.” Arize flagged the drift within 2 hours of deployment.
Limitation: Expensive. $2K/month minimum for meaningful usage.
Homegrown: Agent-Eval Pipeline
This is the secret sauce. A simple Python service that:
- Reads traces from LangFuse
- Runs them through evaluation models (we use GPT-4o-mini for cost efficiency)
- Tags each trace: PASS, FAIL, WARN, or UNKNOWN
- Sends alerts to PagerDuty for FAIL traces
Code sketch:
python
# agent_eval_pipeline.py
import json
from langfuse import LangFuse
from openai import OpenAI

def evaluate_agent_trace(trace_id):
    trace = langfuse.get_trace(trace_id)
    steps = trace['steps']

    eval_prompt = f"""
    You are evaluating an AI agent's decision-making process.

    Agent task: {trace['task']}
    Steps taken: {json.dumps(steps, indent=2)}

    Evaluate:
    1. Did the agent choose the right tool for each step?
    2. Did it avoid unnecessary loops?
    3. Did it complete the task?

    Return JSON: {{"pass": bool, "reason": str, "severity": "low"|"medium"|"high"}}
    """

    response = client.chat.completions.create(
        model="gpt-4o-mini",
        messages=[{"role": "user", "content": eval_prompt}],
        response_format={"type": "json_object"}
    )

    result = json.loads(response.choices[0].message.content)

    if not result['pass'] and result['severity'] == 'high':
        send_alert(trace_id, result['reason'])

    return result
We run this as a cron job every 5 minutes. It processes about 100 traces per minute. False positive rate is around 8%, which we accept because catching real failures early is worth the noise.
Why Not Datadog/New Relic?
We tried. The problem is that AI agents don’t fit into their APM model. Datadog is great for “this request took 200ms and returned a 200.” It’s terrible for “this agent called the wrong tool three times in a row because it misinterpreted the user’s intent.”
Datadog can monitor your infrastructure, but it cannot monitor your agent’s reasoning. That’s a distinct category problem.
What to Alert On (And What to Ignore)
Here’s the alerting philosophy I’ve settled on after burning my team out on pager fatigue:
Alert on:
- Agent complete failure (no output after 2 minutes)
- Tool call failure rate > 20% in any 5-minute window
- State size growing more than 50% above baseline
- Decision quality falling below 70% pass rate on evaluation
- Token usage spikes > 3x normal (usually means a loop or hallucination)
Don’t alert on:
- Single tool call failures (agents should retry)
- Slightly higher latency
- LLM response time variance (it happens, it’s fine)
- Individual trace failures below 5% rate
I learned this the hard way. We used to alert on every hallucination. Within a day, our engineers had alert fatigue so bad they missed a real outage. Now we bucket halluciantions into “low severity” unless they cascade.
The Hardest Problem: Determining Ground Truth
Here’s the thing nobody talks about. If you can perfectly validate your agent’s decisions, you probably don’t need an agent.
Agents exist precisely because the decision space is too large or ambiguous to predefine. That’s why they’re agents and not scripts.
So when we talk about “decision quality monitoring,” we’re inevitably dealing with proxy metrics. We don’t know if the agent made the right call — we know if it made a call similar to what a human would have made in a similar situation.
We handle this with:
- Human-in-the-loop sampling — We randomly sample 5% of all agent decisions and have a human review them. That gives us a labeled dataset to tune our evaluators.
- Outcome-based validation — If the agent completes a task and the customer doesn’t complain, that’s a weak positive signal. If the customer escalates, that’s a strong negative.
- A/B comparison — We run two versions of an agent and compare their evaluation scores. This is the closest thing to ground truth we’ve found.
None of these are perfect. All of them are necessary.
Setting Up Your First Monitoring Pipeline
If you’re starting today, here’s the minimal setup I’d recommend:
-
Instrument your agent framework — Most frameworks (Top 5 Open-Source Agentic AI Frameworks in 2026) support trace exporters. LangChain has a LangFuse callback. CrewAI has a Webhook. Wire them up.
-
Export to LangFuse — Start with the free tier. You’ll get 50K traces/month. That’s enough to know if your agent is fundamentally working.
-
Write one evaluator — Just one. Start with the most common failure mode for your use case. For us, it was “did the agent call the right database query tool?” For you, it might be “did the agent refuse a valid request?”
-
Set one alert — On the failure rate of that evaluator. Nothing else.
-
Watch for a week — Then add the next failure mode.
Do not try to build a full monitoring system on day one. You don’t know what will break. Your monitoring should evolve with your agent’s failure patterns.
What I’d Do Differently
If I could go back to January 2026 and redo our monitoring setup:
-
I’d invest in evaluation data earlier. We spent three weeks building the perfect tracing pipeline. We had zero labeled data to evaluate against. Start with 100 labeled traces and a simple evaluator. It will catch 80% of failures.
-
I’d use MCP from day one. Our early agents used custom tool call formatting. Switching to MCP required rewriting monitoring hooks. If I were starting today, I’d go straight to MCP (AI Agent Frameworks: Choosing the Right Foundation).
-
I’d fight the temptation to over-monitor. More dashboards don’t mean more insight. I now believe that a team should have exactly three agent monitors: one for execution health, one for decision quality, and one for state consistency. Anything beyond that is noise.
-
I’d sample, not aggregate. Don’t average everything. Sample specific decisions heavily and infer the rest. We spend 80% of our monitoring budget on 20% of traces — the ones near failure boundaries or edge cases.
FAQ
Q: Do I need a dedicated AI monitoring tool, or can I use my existing observability stack?
You can start with your existing stack (Datadog, Grafana) for Layer 1 execution metrics. But for Layers 2 and 3 — decision quality and state consistency — you’ll need something that understands agent semantics. LangFuse, Arize, or a homegrown evaluator against traces.
Q: How often should I retrain my evaluation models?
Every time your agent model changes. The evaluator’s accuracy degrades when the agent’s behavior shifts. We retrain our evaluator embeddings every two weeks, or immediately after a model swap.
Q: What’s the best LLM for monitoring evaluation?
GPT-4o-mini for cost. Claude 3.5 Sonnet for accuracy on complex evaluations. We use GPT-4o-mini for 90% of evaluations and Claude for the high-stakes ones (financial decisions, medical recommendations).
Q: Can I monitor agents without instrumentation?
No. If you can’t trace each step, you’re guessing. The best un-instrumented approach is log scraping, but it’s fragile and misses state. Always instrument.
Q: MCP vs A2A — which is better for monitoring in 2026?
For monitoring specifically, MCP wins. It produces per-call structured logs. A2A introduces distributed state across agents, which makes tracing harder. Use MCP internally, A2A only if you have cross-organization agent communication.
Q: How do you monitor agents that run asynchronously or in background jobs?
Same pipeline, but with delayed evaluation. We write traces to LangFuse in realtime, then run evaluation as a batch job every 5 minutes. Alerts fire on the batch results. This catches loops and stuck agents that don’t produce immediate errors.
Q: What’s the single most important metric to monitor?
Tool call success rate. It’s the closest proxy to “is the agent working?” Everything else — latency, token usage, even decision quality — follows from whether tools are succeeding.
The Bottom Line
AI agent monitoring isn’t solved. Not by Datadog, not by LangFuse alone, not by any framework. It’s not a tool problem — it’s a conceptual one.
The tools that work understand that agents are different. They track state. They evaluate decisions. They sample and infer rather than aggregate and average.
You can build production agents without good monitoring. I did for months. But you can’t run them at scale. The failures compound. The silent errors accumulate. And one day, you get a call from a customer who says “your agent ordered 10,000 units of something we don’t sell.”
Since 2018, SIVARO has built systems processing 200K events per second. We’ve learned that monitoring is not an afterthought — it’s the core infrastructure. You can’t improve what you can’t see. And you can’t see what you’re not measuring.
Start with traces. Add one evaluator. Set one alert. Learn. Iterate.
That’s the only approach that works.
Nishaant Dixit — Founder of SIVARO. Building data infrastructure and production AI systems since 2018. Built systems processing 200K events/sec.