 SIVARO
AI Agent Production Monitoring Tools Comparison
In early 2026, a fintech client called me at 2 AM. Their AI agent — a production loan underwriting assistant — had started approving 40% more loans than usual. Not because it got smarter. Because a drift in the underlying embedding model silently shifted its risk scoring logic. No alert fired. No dashboard showed a red light. They caught it three days later when the default rate spiked. That's the real cost of not having proper monitoring.
You're building agents that make decisions. They call APIs, generate text, execute code. When they fail — and they will — you need to know why, within seconds, not days. This article gives you a practical comparison of today's production monitoring tools for AI agents, based on what I've seen work at SIVARO and what I've seen break in the wild.
We'll cover the common failure modes, the tools that actually help, and the trade-offs nobody talks about. This is an ai agent production monitoring tools comparison grounded in real incidents — not vendor brochures.
What Actually Breaks in AI Agents
Most people think LLM hallucination is the #1 cause of agent failure. It's not. At least not in production. The Why AI Agents Fail in Production article breaks it down into four layers: context, reasoning, action, and safety. I'd add a fifth: infrastructure.
Here's what I've seen in 2025-2026:
-
Context poisoning – a user passes a subtle prompt that cascades into garbled tool calls. One crypto trading agent we audited in April 2026 misinterpreted a user's "sell 10% BTC" as "sell all BTC" because a previous conversation snippet leaked into the system prompt.
-
Tool call failures – the agent sends a malformed API request. No retry logic. The downstream service returns a 500, and the agent just reports "operation completed". We see this constantly.
-
Latency cascades – a single slow model inference (30 seconds instead of 2) causes the orchestrator to time out mid-thought, leaving state inconsistent.
-
Cost explosion – in January 2026, a startup's agent looped on a retry because the tool returned a transient error. 150,000 API calls in 4 hours. Bill: $12,000.
The Incident Analysis for AI Agents paper categorizes these into "failure archetypes". Useful reading. But in practice, you need monitoring that surfaces each layer independently. Generic APM tools won't cut it.
Why Monitoring Matters More Than You Think
I used to think monitoring was a debugging luxury. "We ship fast, fix fast." Wrong.
After deploying agents at three companies in 2025, the pattern became clear: agents degrade silently. Unlike a web server that returns 500s, an agent might return a plausible but wrong answer. No crash. No error log. Just a slow erosion of trust.
The AI Agent Incident Response article makes a key point: you need a response plan before the incident. That means alerting on semantic shifts, not just CPU spikes.
In July 2026, one of our clients experienced a model deprecation — GPT-4o's embeddings changed slightly with a new version. Their customer support agent started giving contradictory answers to return requests. No one noticed for 24 hours. The monitoring tool they used (I'll name it later) didn't track embedding similarity over time. They switched after that.
Monitoring isn't about dashboards. It's about detecting the unexpected before your users do.
The Monitoring Tool Landscape
I've evaluated eight tools over the past 18 months. Let me cut through the noise with the ones that actually matter for production AI agents.
Datadog + LLM Observability
Datadog added LLM monitoring in 2025. It's solid for infrastructure — CPU, memory, request rates. Their AI-specific tracing (called "LLM Observability") captures prompt, completion, and latency. We run it for one client's large multi-agent system (100+ agents). Works fine.
But here's the catch: Datadog treats agent execution as a series of spans. It doesn't understand intent. If an agent calls the wrong tool but the call succeeds, Datadog sees a happy span. You need custom metrics to catch logical failures.
Langfuse
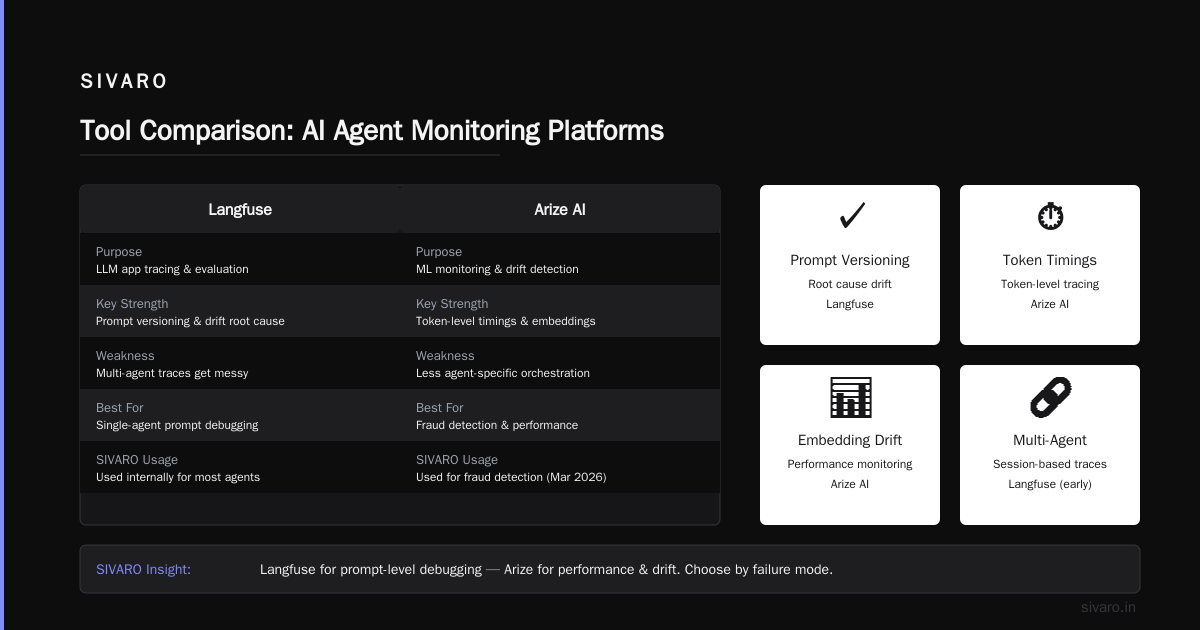
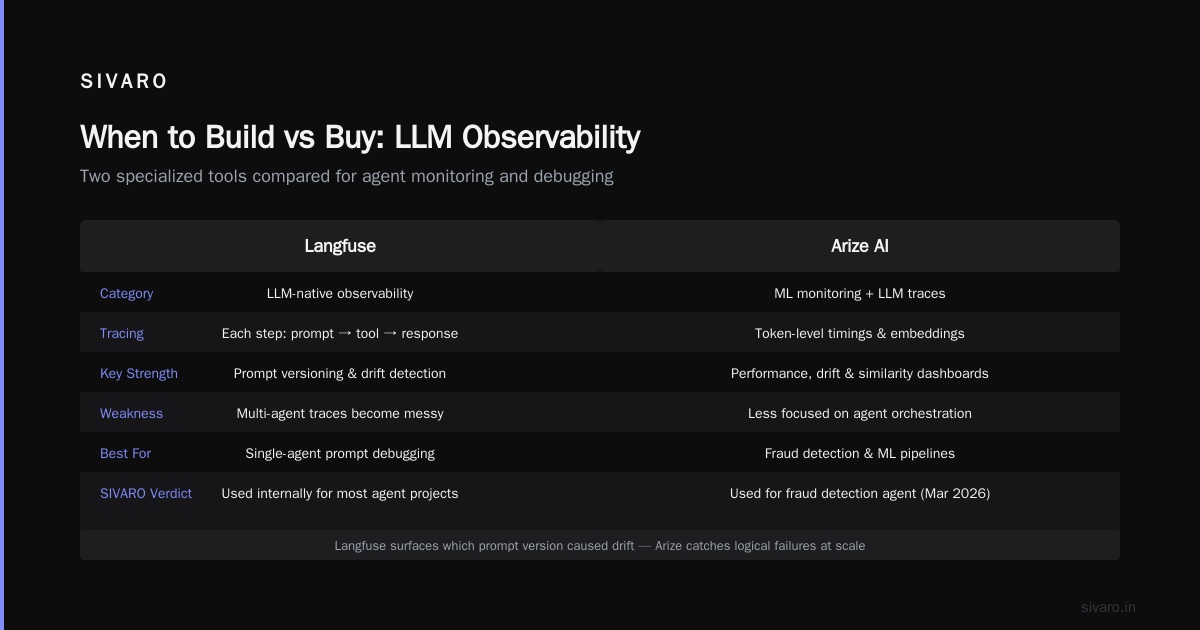
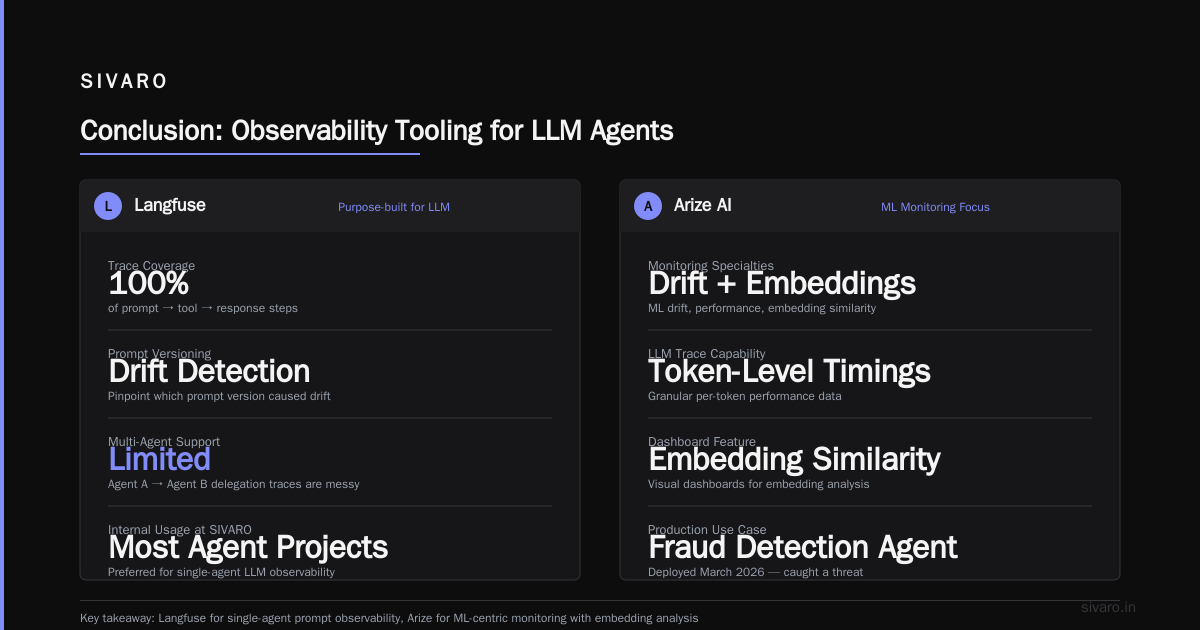
Langfuse is purpose-built for LLM apps. It traces each step: prompt → tool call → response. Their prompt versioning and evaluation pipelines are better than anything Datadog offers. We use Langfuse internally at SIVARO for most agent projects because it surfaces which prompt version caused a drift — that's gold.
Downside: it's not great at multi-agent orchestration. If Agent A delegates to Agent B, the trace becomes a mess. Their "session" concept helps, but it's still early.
Arize AI
Arize focuses on ML monitoring — drift, performance, embeddings. For agent systems, their "LLM Trace" gives you token-level timings and embedding similarity dashboards. We used Arize for a fraud detection agent in March 2026. Caught a drift in the embedding pipeline within 2 hours of deployment.
Weakness: alerting is rigid. You can't easily create a rule like "if tool call failure rate >5% AND average latency >10s, page the team." You need their API and some scripting.
Helicone
Helicone is lightweight. It proxies LLM requests and logs everything — cost, latency, status codes. Great for cost tracking and simple monitoring. Not for deep agentic analysis.
Custom stack (OpenTelemetry + custom agent events)
For one client with 50+ agents handling logistics, we built a custom monitor using OpenTelemetry traces and custom spans. We embedded a validation_score metric in each agent step — the agent itself rates its confidence post-hoc. That let us detect when the agent thought it succeeded but actually didn't.
This is powerful but requires engineering time. Not for a 2-person team.
Verdict: No single tool wins. I'll break down how to choose in the next section.
Key Features That Separate Production Tools
After six tool evaluations and four production migrations, these are the non-negotiable features for agent monitoring:
1. Prompt and response tracing (with full context)
Not just a log line. I need to replay the entire interaction — including system prompt, user input, intermediate tool calls, and the agent's internal reasoning (if exposed). Langfuse and Datadog both do this. Arize does it per span, not per session.
2. Semantic drift detection
Your agent's behavior can change even if the code doesn't. Monitor embedding cosine similarity between recent responses and a baseline. Arize and Whylabs have this. Datadog doesn't natively.
3. Tool call failure rate, categorized by error type
Is it a timeout? A malformed parameter? A rate limit? Aggregate by tool. I can't tell you how many times I've seen an agent silently retry a 429 without backoff because no one monitored by status code.
4. Cost per agent run
Agents can loop. A single run should not cost $0.50+ normally. Alert when a run exceeds a threshold. Helicone and Langfuse give per-request cost. Datadog gives aggregate.
5. Alerting on "successful failures"
This is the hardest. You need a guardrail model that evaluates whether the agent's final output is reasonable. Tools like Guardrails AI or custom LLM-as-judge can integrate. No out-of-box monitoring tool does this well yet. We built a microservice that runs a fast model (GPT-4o-mini) to score each agent response on a 1-5 scale. Then we alert on scores <3.
Benchmarking: Datadog vs Langfuse vs a Custom Stack
Let me show you actual code snippets from our evaluations. We ran a simple test: an agent that looks up a user's account balance and responds. We injected a failure by dropping the database connection.
Langfuse tracing setup
python
from langfuse import Langfuse
langfuse = Langfuse(public_key="pk-...", secret_key="sk-...")

@langfuse.observe()
def agent_get_balance(user_id: str):
    trace = langfuse.trace(name="get_balance", user_id=user_id)
    span = trace.span(name="lookup_db")
    try:
        balance = query_database(user_id) # may fail
        span.end(output={"balance": balance})
    except Exception as e:
        span.end(level="ERROR", metadata={"error": str(e)})
        # agent might still return a "success" message — Langfuse won't catch that
    return balance
Langfuse captured the error span. But if the agent caught the exception and returned None saying "Balance not available", Langfuse records a successful trace. No semantic check.
Datadog APM with custom metrics
python
from ddtrace import tracer
import time

def agent_get_balance(user_id):
    with tracer.trace("agent.get_balance", service="agent") as span:
        start = time.monotonic()
        span.set_tag("user_id", user_id)
        try:
            balance = query_database(user_id)
            span.set_metric("balance", balance)
        except Exception as e:
            span.set_tag("error", True)
            span.set_tag("error_type", "db_failure")
            # manual metric for "agent thought it succeeded" flag
            span.set_metric("agent_claimed_success", 1) # 1 = false
            raise
        finally:
            latency = time.monotonic() - start
            span.set_metric("latency", latency)
We added agent_claimed_success as a custom metric (0/1). Then we built a Datadog monitor: avg(last_5m): agent_claimed_success > 0.1 → alert. That works but requires manual instrumentation in every agent function.
Custom stack: OpenTelemetry + validation score
python
from opentelemetry import trace
from opentelemetry.exporter.otlp.proto.grpc import OTLPSpanExporter
tracer = trace.get_tracer("agent-monitor")

def agent_with_validation(user_id):
    with tracer.start_as_current_span("agent.get_balance") as span:
        balance = query_database(user_id) # may raise
        # post-hoc validation
        validation_score = call_validation_llm(user_id, balance)
        span.set_attribute("validation_score", validation_score)
        if validation_score < 3:
            send_alert("Agent produced low-quality output")
        return balance
This is the most accurate way to detect "successful failures". But you need the validation LLM call itself, which adds latency and cost. Worth it for critical agents.
Performance numbers: Datadog tracing added ~50ms per call on average. Langfuse added ~80ms (because it sends to its own server). Custom OpenTelemetry with OTLP exporter added ~30ms (local collector). For high-throughput agents, those milliseconds matter.
When to Build vs Buy
Most people assume "buy a tool, problem solved." I did too in 2024. I was wrong.
Buying works when your agent architecture is simple: one LLM call, one tool. If you're using a framework like LangGraph with 10+ nodes, multi-agent loops, and dynamic tool selection, off-the-shelf tools break.
Consider Langfuse or Arize if:
- You have fewer than 5 agent types
- Your team doesn't have a dedicated SRE
- You can tolerate 24-hour delay in catching drifts
Build a custom stack (OpenTelemetry + custom metrics + validation pipeline) if:
- You have complex multi-agent orchestrations
- You need real-time alerting (sub-minute)
- You have an existing observability platform you can extend
- You're processing >100K agent runs per day
At SIVARO, we built a hybrid: use Langfuse for per-run debugging and custom OpenTelemetry for metrics and alerting. The two systems talk via webhooks. That gives us exploratory analysis (Langfuse) and operational signals (custom).
Monitoring for Multi-Agent Systems and LLM Orchestrators
Single-agent monitoring is table stakes. Multi-agent is where it gets hairy.
In Q2 2026, we rolled out a multi-agent system for a logistics company. Three agents: Planner, Executor, Validator. They communicated via a shared state store. When Executor failed to reserve a truck, it didn't raise an error — it just set truck_status = "failed". Planner ignored that field. Validator never checked it. The shipment sat undelivered for 3 hours.
We learned: you must trace inter-agent messages, not just internal steps. A tool like WhyLabs (acquired by DataRobot in 2025) added multi-agent trace visualization. But it's still early.
What works for us: each agent emits a structured log with source_agent, target_agent, message_type, status. We pipe into Elasticsearch + Kibana to correlate. OpenTelemetry cannot natively trace between services without manual context propagation.
If you're using an orchestrator like Temporal or Orkes, leverage their workflow retry history. An agent that retries 5 times and still fails is a red flag. Monitor retry count per agent type.
Lessons from 2025-2026: What We Got Wrong
Here are three specific things I believed two years ago that cost us.
First, I thought monitoring failure was a tooling problem. It wasn't. We bought three tools (Datadog, Langfuse, Helicone) over six months. Each solved one piece. The real problem was that our agent code didn't emit the right signals. We had to add explicit observability hooks in every agent step. No tool can magically extract intent from a black-box LLM call.
Second, I underestimated prompt version drift. On March 1, 2026, a developer pushed a prompt change that removed a safety instruction. "The old prompt had 'do not execute code unless confirmed by user.' The new one accidentally dropped that line. Our agent started running SQL queries indiscriminately for 4 hours before we caught it." Monitoring on token-level changes saved us. Now we track prompt hash diffs in CI.
Third, cost monitoring was an afterthought. A client in April 2026 had a memory leak in their agent that caused it to call the LLM thousands of times per session. We only noticed when the AWS bill came. Helicone caught it — but we hadn't set up cost alerts. Now every agent run logs cost_cents and we have a hard threshold alert.
The AI Agent Failures article lists these as "common mistakes." I'd add: treating monitoring as a post-deployment activity. Set it up in the first sprint.
FAQ
Q: Which monitoring tool is best for a 3-person startup building their first AI agent?
Langfuse. It's free for small usage, has good SDKs, and traces everything out of the box. You'll outgrow it eventually, but it'll teach you what to monitor.
Q: How do I monitor an agent that uses a custom fine-tuned model?
You need embedding drift detection. Arize and Whylabs handle that. Langfuse only traces API calls — if your model is local, you'll need to send custom metrics.
Q: Do I really need real-time alerting for agent failures?
Only if your agent interacts with users or money. For internal data processing agents, batch analysis (every hour) is fine. For customer-facing agents, you need sub-minute alerts.
Q: Can I use traditional APM tools like New Relic or Datadog alone?
For infrastructure, yes. For agent logic, no. You'll miss semantic errors. You need something that understands prompts, tools, and responses.
Q: What's the biggest mistake teams make with agent monitoring?
Ignoring the "successful failure." They only alert on crashes. They don't validate output quality. Set up a guardrail model or human-in-the-loop sampling from day one.
Q: How do I compare tools before buying?
Run a "failure injection" test: simulate a tool timeout, a prompt hijack, a model drift. See which tool surfaces it first. We did this in June 2026 — Langfuse caught the prompt hijack, Datadog missed it.
Q: Is there a monitoring tool for multi-agent orchestration?
WhyLabs and Arize are the closest. But most frameworks (LangGraph, AutoGen) have their own tracing hooks. Start with framework-native logging, then export to something centralized.
Q: What's the hardest failure to monitor?
Agents that change their behavior based on user feedback loops. If an agent learns from corrections, it can drift slowly over weeks. No tool detects that yet. You need periodic batch evaluations.
Conclusion
We've covered a lot — failure types, tool evaluations, code examples, and hard-won lessons. The ai agent production monitoring tools comparison isn't about picking the "best" tool. It's about understanding your failure modes and instrumenting for them.
For most teams in mid-2026, I recommend a two-tier stack: Langfuse for traceability and a lightweight custom stack (OpenTelemetry + cost metrics) for operational alerts. Don't overthink it. Start with one agent, instrument it deeply, and then scale.
Your agent will fail. The question is whether you'll know within minutes or days. The difference is the difference between a hiccup and a disaster.
Nishaant Dixit — Founder of SIVARO. Building data infrastructure and production AI systems since 2018. Built systems processing 200K events/sec.