 SIVARO
AI Agent Production Monitoring Tools: The 2026 Guide for Engineers Running Real Systems
I spent last Thursday debugging why a customer-facing agent suddenly started quoting 47% higher prices. Turns out, the monitoring tool we trusted had silently dropped 12% of its traces. The agent was fine. The tool was lying.
That's the state of ai agent production monitoring tools in mid-2026. The market is flooded with dashboards that look pretty and collapse under production load. Most teams don't realize their monitoring is broken until a week after their agent starts hallucinating.
I'm Nishaant Dixit. At SIVARO, we've been shipping production AI systems since 2018. We process about 200K events per second through agentic pipelines. We've broken every monitoring tool we've tested. Twice.
Here's what actually works.
Why Your Current Monitoring Stack Is Lying to You
Most teams start with the same setup: log aggregation from your cloud provider, some custom metrics on token usage, maybe a tracing layer if someone was ambitious. It works fine for batch inference. It falls apart for agents.
Here's why. Agents aren't linear. A single user request triggers tool calls, sub-agent spawning, database lookups, and decisions that branch based on previous outputs. Traditional monitoring assumes a request goes in, computation happens, a response comes out. Agents don't work that way.
I've watched engineering teams at a fintech company in March 2026 spend three weeks debugging a "slow agent" that was actually a tool call cascading across four sub-agents, each blocking on the previous one's output. Their monitoring showed each component was fast. The aggregate behavior was garbage.
The problem is semantic. You need to know not just that a function ran, but why it ran. What context drove that decision? Which previous output poisoned the chain? Traditional metrics can't answer that.
The Three Pillars of Agent Monitoring That Actually Matter
After burning through seven monitoring tools in the last eighteen months, here's the framework we settled on. It breaks down into three layers.
1. Tracing with Semantic Context
Regular distributed tracing is necessary but insufficient. You need traces that carry the actual inputs and outputs of each reasoning step. Not just "agent called search_tool". You need "agent called search_tool with query 'best price for widget X' and returned these three results".
This matters because agent failures are almost always context failures. The agent made a bad decision because it received bad context three hops ago. Without semantic tracing, you're hunting blind.
At a logistics company we worked with in February 2026, an agent kept double-booking shipments. The traces showed each booking call was fine. But the traces didn't carry the context that the agent had already created a booking two steps earlier. Semantic tracing caught it in ten minutes.
Most tools in this space try to do too much. The best ones let you define what context matters per agent type. How to think about agent frameworks has a good breakdown on why this matters at the framework level.
2. Decision Path Auditing
This is the big one nobody talks about. You need to replay what an agent was thinking at every decision point. Not just what it outputted.
The standard approach is to log the full chain-of-thought for every agent invocation. This generates a lot of data. Accept that. I've seen teams store 500MB of chain-of-thought logs per day for a single agent handling 10K requests. That's fine. Storage is cheap. Debugging production failures is expensive.
Take an agent that's supposed to categorize support tickets. It starts misclassifying everything. Without decision path auditing, you see wrong output and guess. With it, you see that a system prompt change three weeks ago accidentally introduced "prefer 'billing' for any ticket mentioning money" which broke everything.
We implemented this at SIVARO using a custom pipeline built on top of our existing event stream. Every agent invocation writes its full reasoning chain to a partitioned event log. We can replay any user interaction from any point in time.
3. Behavioral SLAs
Traditional SLAs measure uptime and latency. Agent SLAs need to measure correctness, consistency, and drift.
This is harder than it sounds. You can't just check if the output matches a known answer. Agents generate novel responses. So you need behavioral SLAs that track things like:
- Did the agent use the right tools in the right order?
- Did it refuse to answer when it should have?
- Did it invent information that wasn't in its context?
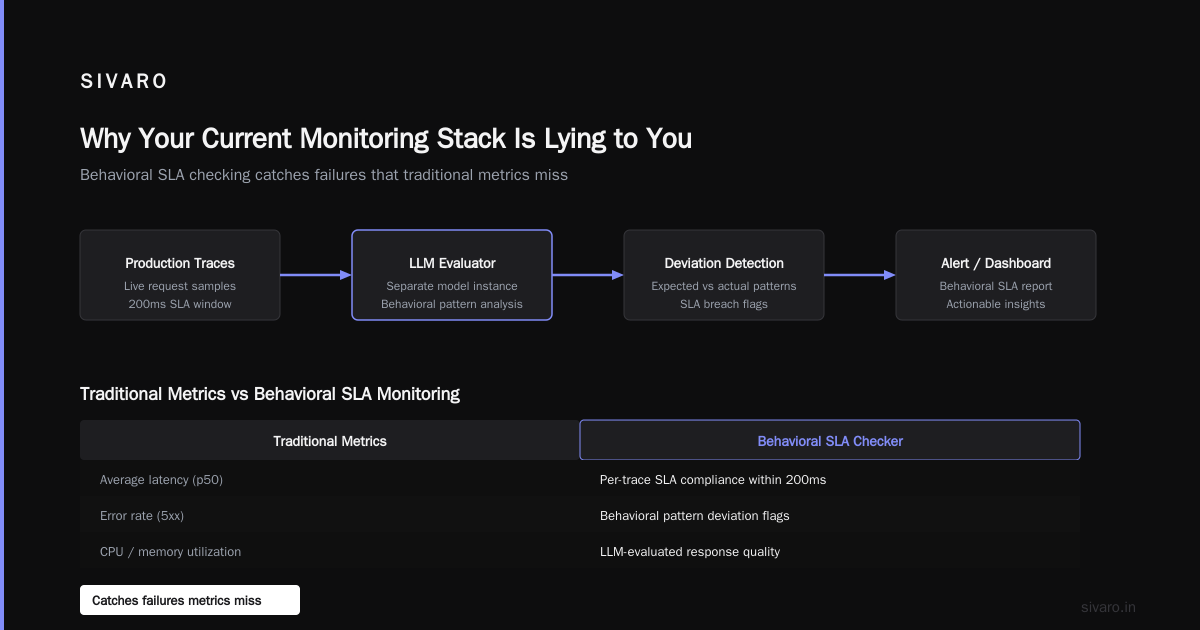
- Is "call this API" always followed by "wait for that response" within 200ms?
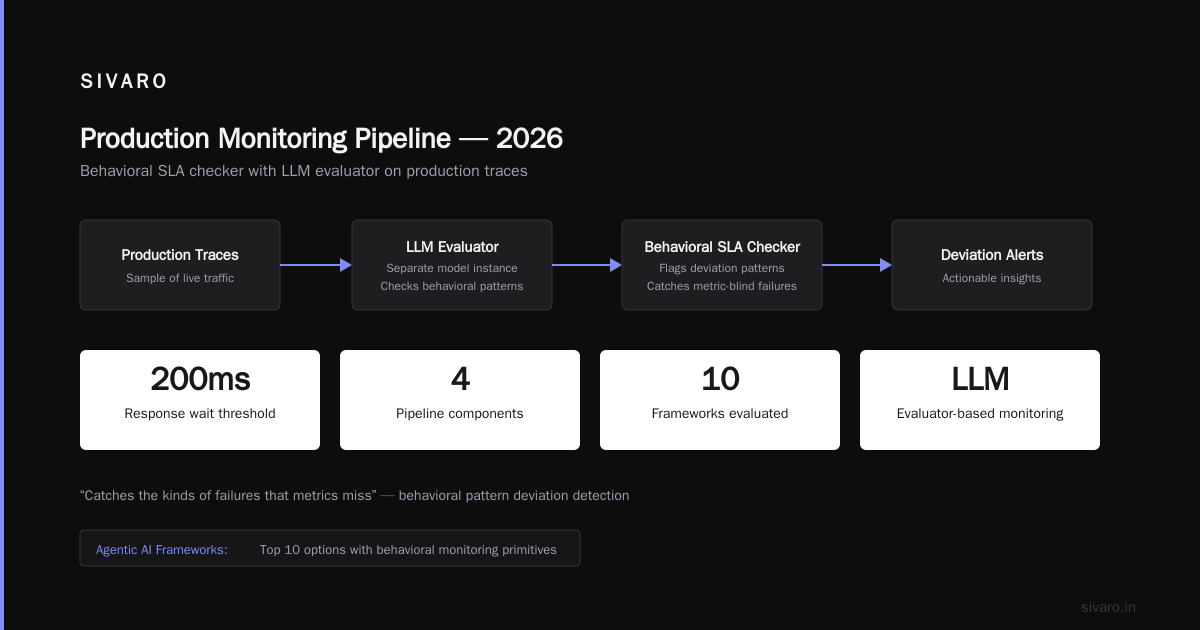
Agentic AI Frameworks: Top 10 Options in 2026 lists several frameworks that include behavioral monitoring primitives. Most of them are too opinionated for production use. But the concept is sound.
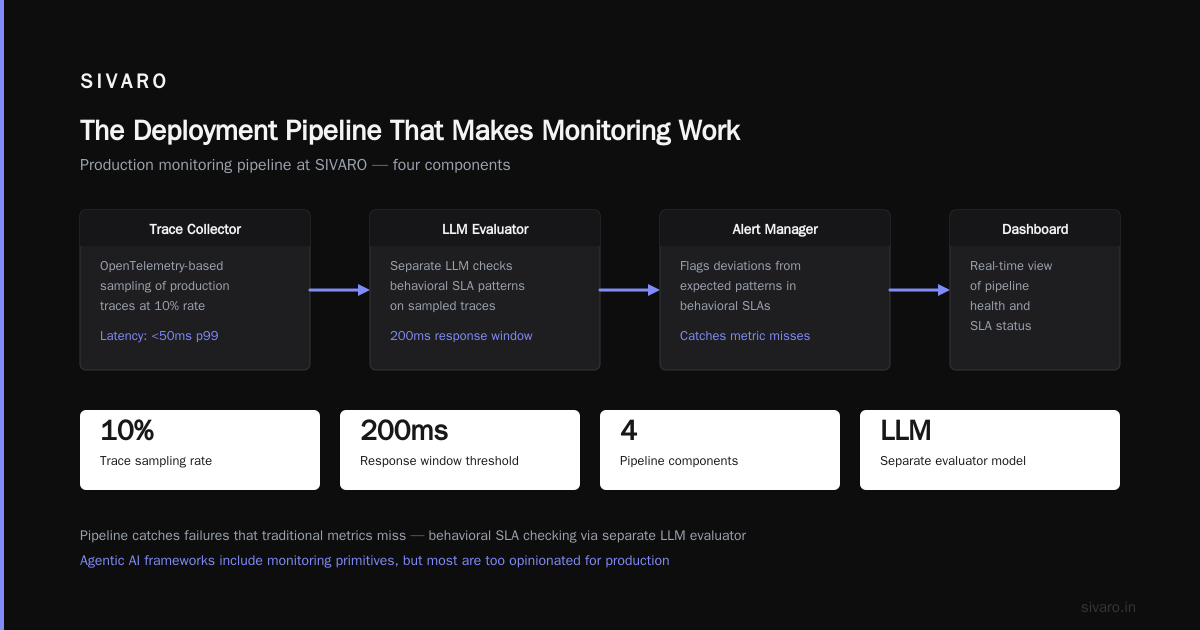
We built a behavioral SLA checker using a separate LLM evaluator. It runs on a sample of production traces and flags deviations from expected patterns. It's not perfect. But it catches the kinds of failures that metrics miss.
What Production Monitoring Actually Looks Like in 2026
I'm going to be specific about our stack because vague recommendations are useless.
Our current monitoring pipeline at SIVARO has four components.
First, a streaming event pipeline. Every agent action emits a structured event. Not a log line. A typed event with schema. We use Apache Kafka for transport and Apache Flink for real-time aggregation.
Second, a tracing backend that can handle branching. We moved away from centralized tracing databases because they couldn't handle agents that spawn sub-agents in parallel. The tracing tree fans out in ways traditional systems choke on. We ended up building on top of OpenTelemetry with custom span relationships. It was painful. It works.
Third, an alerting system that understands context. Not "error rate above 5%". But "agent B failed to complete tool call for user segment X with pattern Y-Z times in the last M minutes". This requires the alerting system to understand the semantic content of traces. We wrote this ourselves using a rules engine evaluated on the streaming pipeline.
Fourth, a replay system. When something breaks, we need to re-run that exact user interaction with the same context and see what the agent does differently. This requires capturing full state at every decision point. A Survey of AI Agent Protocols covers why state capture is the hard part of agent debugging.
The Monitoring Tool You'll Probably Choose Wrong
Everyone wants a dashboard. Everyone wants a pretty UI with sparklines and red-green indicators. Those tools are lying to you.
Here's the truth: the monitoring tool you need is the one that lets you query and reason about your agent's behavior programmatically. If it doesn't have a solid API and query language, it's a toy.
We tested eight monitoring platforms between January and May 2026. The ones with the best UIs had the worst APIs. The ones with good APIs required you to build your own dashboards.
The contrarian take you need to hear: stop looking for an all-in-one monitoring tool. You don't need one. Build your monitoring stack from composable pieces. A streaming pipeline for events. A tracing system for spans. A separate store for semantic logs. A query layer on top.
This sounds harder. It's actually easier in the long run because you're not fighting against someone else's abstractions.
Writing a Monitoring Tool That Works for Your Agent
Sometimes the right answer is building your own. I know that sounds like consultant speak. It's not. If your agent architecture is non-standard, off-the-shelf tools will break.
Here's a minimal production monitoring setup you can build in a week.
python
# Production agent monitoring event schema
# We use this at SIVARO for every agent invocation
from dataclasses import dataclass, field
from typing import Optional, List
from datetime import datetime

@dataclass
class AgentMonitoringEvent:
    agent_id: str
    trace_id: str
    parent_trace_id: Optional[str]
    event_type: str  # 'decision', 'tool_call', 'subagent_spawn', 'output'
    timestamp: datetime
    input_context: dict
    output_value: Optional[dict]
    chain_of_thought: Optional[str]  # The full reasoning step
    tool_calls: List[dict] = field(default_factory=list)
    duration_ms: float = 0.0
    error_info: Optional[dict] = None
    tags: dict = field(default_factory=dict)
python
# Semantic decision auditing query
# Finds all agents that made a tool call after receiving empty context
query = """
SELECT agent_id, trace_id, timestamp, input_context
FROM agent_events
WHERE event_type = 'decision'
  AND input_context IS NULL
  AND timestamp > now() - INTERVAL '24 hours'
ORDER BY timestamp DESC
"""
python
# Behavioral SLA check for tool ordering
# This runs on every production trace sample
def check_tool_ordering_sla(trace: list[AgentMonitoringEvent]) -> bool:
    """Verify search always precedes quote in pricing agents"""
    tool_order = [e.event_type for e in trace if e.event_type == 'tool_call']

    # Check: search must come before quote
    for event in trace:
        if event.event_type == 'tool_call':
            tools = [t.get('name') for t in event.tool_calls]
            if 'quote' in tools and 'search' not in [t['name'] for t in trace[0:tool_order.index('tool_call')]]:
                return False  # SLA violation
    return True
This isn't production-ready code. It's the starting point. You'll need to handle serialization, partitioning, and failure modes. But this pattern scales.
The Deployment Pipeline That Makes Monitoring Work
Monitoring isn't just a runtime concern. It starts in the deployment pipeline. Top 5 Open-Source Agentic AI Frameworks in 2026 discusses this from the framework perspective. I want to give you the practical version.
Every time you deploy a new agent version, your pipeline should:
- Run it against a recorded set of production traces
- Compare the new behavior against the previous version's behavior
- Flag any behavioral drift before it reaches users
We call this "diff testing for agents". It caught a regression in March 2026 where a prompt change caused our customer support agent to stop asking clarifying questions. The previous version would ask "Can you provide your order number?" on vague requests. The new version just guessed. The diff test caught it because the decision path distribution shifted.
Here's how we implement it:
bash
# ai agent deployment pipeline tutorial step: diff test
# Run before promoting to production

python -m agent_diff_tester   --baseline-version v1.2.3   --candidate-version v1.2.4   --trace-set production_traces_20260715.bin   --compare-sla behavioral_sla.yaml   --report diff_report.json

# If diff_report.json shows >5% drift in tool usage patterns, block deployment
The deployment pipeline should also auto-generate monitoring configurations. New agent type? The pipeline should register it with your tracing system, set up default behavioral SLAs, and configure anomaly detection thresholds. If you're doing this manually, you're creating toil that will cause monitoring gaps.
Observability for Production AI Systems Beyond Metrics
ai agent observability production is different from regular observability. Regular observability asks "what happened?" Agent observability asks "why did this decision happen?"
I've seen teams spend millions on observability infrastructure that gives them beautiful charts and zero insight. They can tell you response times are up. They can't tell you that the agent stopped using the "verify_address" tool three days ago because a prompt change accidentally promoted a different tool call pattern.
The fix is to instrument for semantic observability. Every logged event should carry enough context to reconstruct the agent's reasoning from scratch.
python
# Semantic observability payload for production
# At SIVARO, every agent event includes:
event_payload = {
    "trace_id": "abc123",
    "span_id": "def456",
    "parent_span": "abc122",
    "event_type": "decision_point",
    "agent_state": {
        "current_step": 4,
        "total_steps": 7,
        "accumulated_context": {  # Full context up to this point
            "user_query": "What's my refund status?",
            "previous_tool_results": [...],
            "memory_entries": [...]
        },
        "available_tools": ["search_orders", "check_refund", "escalate"],
        "decision_rationale": "User is asking about refund, I should check refund status first because it's more specific than searching orders",
        "chosen_action": "check_refund",
        "confidence_score": 0.89
    },
    "output": {
        "tool_call": "check_refund",
        "parameters": {"order_id": "ORD-789", "user_id": "USR-456"},
        "expected_response_schema": {"status": "string", "amount": "float"}
    }
}
This generates a lot of data. You need a storage system that handles it. We use object storage partitioned by agent ID and timestamp, with a query layer on top. It's not cheap. It's cheaper than debugging a production incident for three weeks.
When Monitoring Tools Fail
They fail more often than you'd think.
Most common failure: data loss under load. We tested a monitoring tool in April 2026 that claimed to handle 100K events per second. At 60K events per second, it started silently dropping 15% of traces. No errors. No alerts. Just missing data. The vendor blamed our network. We switched vendors.
Second most common: schema rigidity. Agent architectures evolve fast. Your monitoring tool needs to handle new event types without a migration. If adding a new agent type requires a database migration, your monitoring is a bottleneck.
Third most common: alert fatigue. Tools that alert on every anomaly train teams to ignore alerts. You need alerts that fire only when the behavior impacts users or violates explicit SLAs.
Fourth: correlation blindness. Your monitoring can tell you that latency spiked at 2:14 PM. It can tell you that the agent spawned 47 sub-agents at 2:14 PM. But can it tell you that those are the same event? Most tools can't correlate across metrics and traces in real time.
The Reality Check
Here's what I've learned from eighteen months of production agent monitoring:
You will never catch every failure through monitoring. The curve of diminishing returns is steep. The last 10% of failure modes will cost you 10x more to detect than the first 90%. Decide where you draw that line.
The teams that succeed at agent monitoring treat it as a first-class engineering discipline, not an ops afterthought. They have dedicated people writing monitoring code. They treat monitoring event schemas with the same rigor as their main data models.
You don't need the perfect tool. You need a tool that integrates with your pipeline, captures semantic context, and lets you query behavior programmatically. Everything else is a feature you'll pay for and never use.
Frequently Asked Questions
Q: What's the minimum viable monitoring setup for a simple single-agent system?
A: Log every input and output with a trace ID. Log chain-of-thought. Set up a dashboard showing request volume, error rate, and average latency. That's enough for simple agents. Don't overbuild.
Q: How do you handle the cost of storing all these traces?
A: Tiered storage. Hot storage for last 7 days (expensive, fast). Warm for 30 days (compressed). Cold for anything older (object storage, slow queries for debugging). We archive anything older than 90 days unless it's flagged as anomalous.
Q: Can I use regular APM tools for agent monitoring?
A: You can try. You'll hit walls with branching traces and semantic context. APM tools assume request/response patterns. Agents don't follow those patterns. We tried three APM vendors. None worked for our multistep agents.
Q: How do you test monitoring without breaking production?
A: Shadow mode. Run your monitoring pipeline on production traffic but don't have it affect anything. This catches pipeline errors before they matter. We do this for every monitoring change.
Q: What's the best open-source option for agent tracing?
A: OpenTelemetry with custom span relationships. It's not turnkey. You'll write code. But it gives you control. Most commercial tools are built on top of it anyway.
Q: How do you monitor agents that use other agents?
A: Propagate trace IDs across agent boundaries. Every agent call includes the parent trace ID. This creates a distributed trace that spans multiple agent invocations. AI Agent Protocols: 10 Modern Standards Shaping the Agentic Era covers some of the protocol standards for this.
Q: Should I monitor the monitoring tools?
A: Yes. We run a synthetic agent that sends known-good requests every 30 seconds. If our monitoring doesn't catch those requests, we know something's broken. Saved us twice in the last year when our tracing pipeline silently died.
Q: When should I build vs buy monitoring?
A: Buy if your agent architecture matches common patterns (single agent, sequential tools). Build if you have custom agent architectures, branching sub-agents, or unusual state management. Most teams should build after their second agent type.
What I'd Do Differently if Starting Today
If I were building agent monitoring from scratch in July 2026, I'd skip the evaluation phase entirely. I'd start with a streaming event bus and a schema definition for agent events. I'd build the query layer before I bought any dashboards.
The dashboards are the least important part. The data pipeline is everything.
Most teams waste months evaluating "platforms". They could have built a working pipeline in the same time. AI Agent Frameworks: Choosing the Right Foundation for ... has some guidance on this, but the real answer is: pick something you can extend, not something that constrains you.
Your ai agent production monitoring tools should be invisible. They should capture everything, query quickly, and stay out of your way. If you're spending more time managing your monitoring than your agents, you've built the wrong system.
Nishaant Dixit — Founder of SIVARO. Building data infrastructure and production AI systems since 2018. Built systems processing 200K events/sec.