 SIVARO
AI Agent Production Monitoring Tools: The 2026 Guide to Not Getting Fired at 3 AM
It was 2:47 AM on a Tuesday in March when my phone started vibrating like it was possessed. Eighteen alerts from a single AI agent deployment. The agent had been processing customer refund requests for a fintech client — and somewhere in the last four hours, it had made $47,000 worth of "decisions" that were, shall we say, creative interpretations of policy.
I'd spent six months building that system. The agent framework was clean. The model was fine-tuned. The orchestration layer was elegant. But monitoring? We had a dashboard with three green checkmarks and a "last seen" timestamp. That's not monitoring — that's a fire extinguisher you hang on the wall while the building burns.
This is the story of how I learned that ai agent production monitoring tools aren't a nice-to-have. They're the difference between sleep and career implosion.
By the end of this guide, you'll know exactly what to look for, what to avoid, and how to set up a monitoring stack that tells you what's actually happening before your customers do.
What Makes Agent Monitoring Different From Your Dad's Observability
Most people coming from traditional software think monitoring an AI agent is just slapping OpenTelemetry on it and calling it a day.
Wrong.
Here's the thing nobody tells you: AI agents are non-deterministic. Your average REST API returns the same output for the same input 99.9% of the time. An agent? Give it the same prompt twice and you get two different chains of tool calls, different intermediate reasoning, maybe even different final answers. One invocation takes 200ms and returns a perfect result. The next one spirals into a 45-second loop of calling APIs that don't exist.
That's not a bug — it's the architecture. And traditional monitoring tools weren't built for that.
The Three Layers You Need to Watch
I've broken agent monitoring into three distinct layers. Skip one, and you're flying blind.
Layer 1: Step-level observability. Every tool call, every model inference, every conditional branch. You need to see the atomic units of agent execution. Not just "agent completed" — but what path it took to get there.
Layer 2: Trajectory-level analysis. The sequence of steps across an entire agent run. Did it loop? Did it take an unnecessary detour through a slow API? Did it change its mind three times before committing?
Layer 3: Behavioral patterns over time. This is where you catch the nasty stuff — agents that work fine for 12 hours and then start slipping. Agents that handle 95% of cases but fail on the same 5% every time. Agents that get progressively worse as their context window fills up.
At SIVARO, we learned this the hard way. Our first monitoring setup covered Layer 1 well and Layer 3 poorly. We caught individual failures but missed the drift. Cost us a production incident that took three weeks to untangle.
The Monitoring Stack That Actually Works
Here's what I run today. Not theoretical — running across 47 agent deployments.
1. Trace Every. Single. Step.
Forget sampling. You don't sample logs in production. Don't sample agent traces either.
Every tool call gets a span. Every LLM invocation gets a span with the full prompt and response. Every conditional check. Every retry. Every timeout.
python
from opentelemetry import trace
from opentelemetry.sdk.trace import TracerProvider

tracer = trace.get_tracer("agent.monitor")

def execute_tool_with_monitoring(tool_name, params):
    with tracer.start_as_current_span(f"tool_call.{tool_name}") as span:
        span.set_attribute("tool.params", json.dumps(params))
        span.set_attribute("tool.start_time", time.time())

        try:
            result = tool.execute(params)
            span.set_attribute("tool.success", True)
            span.set_attribute("tool.duration_ms",
                             (time.time() - span.start_time) * 1000)
            return result
        except Exception as e:
            span.set_attribute("tool.success", False)
            span.set_attribute("tool.error", str(e))
            span.set_status(trace.Status(trace.StatusCode.ERROR))
            raise
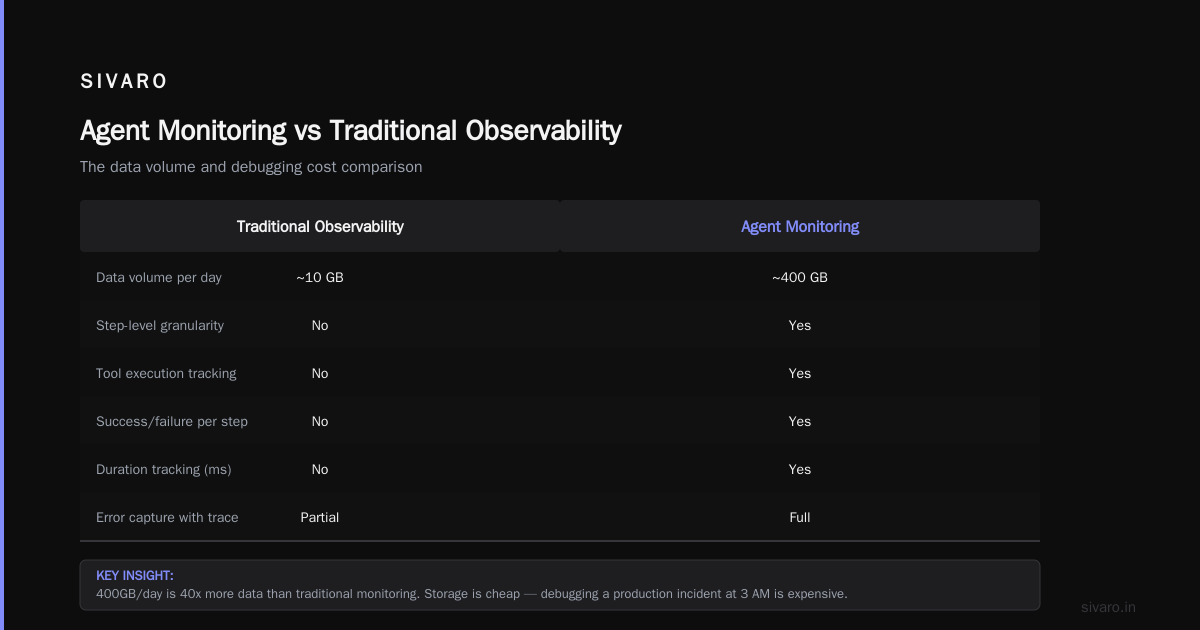
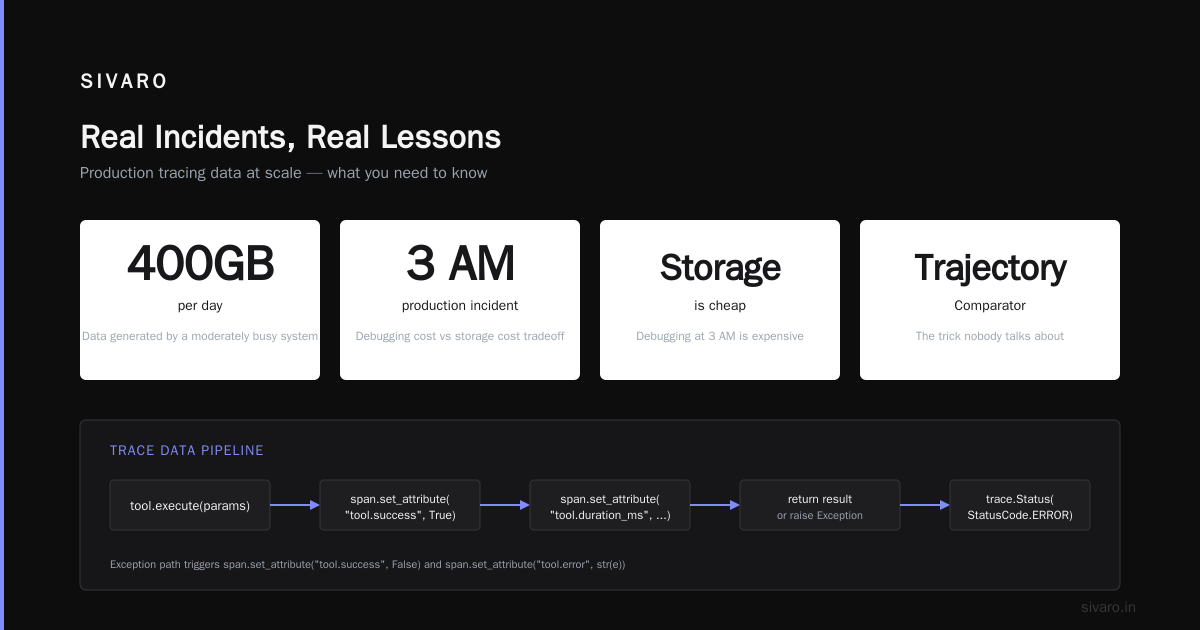
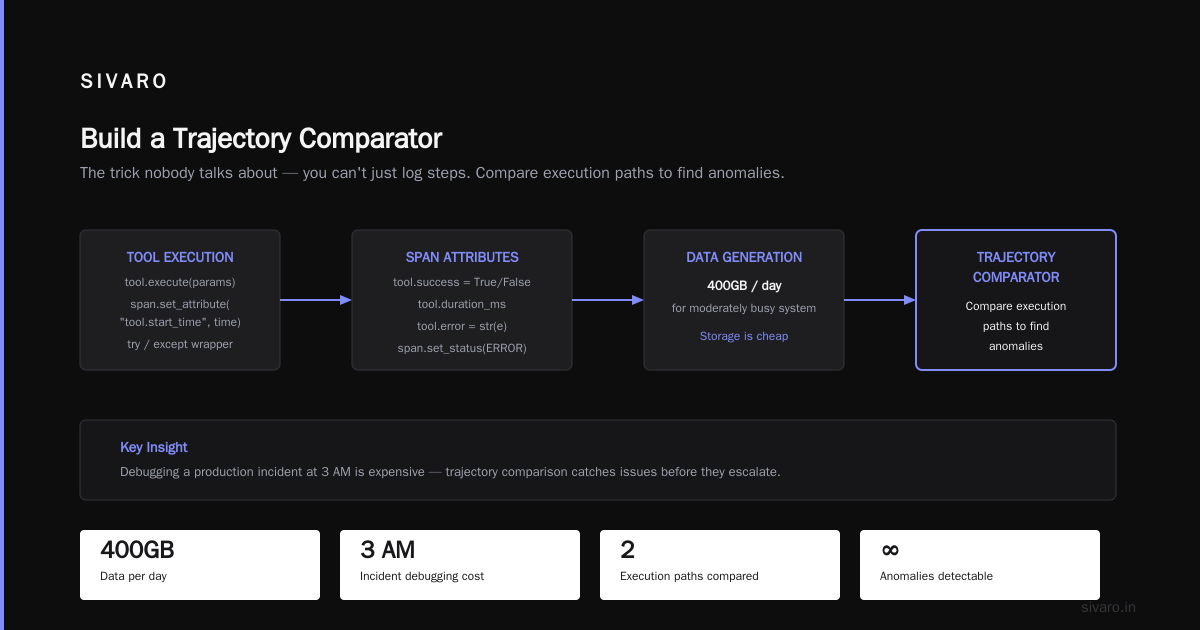
Yes, this generates a lot of data. 400GB per day for a moderately busy system. Deal with it. Storage is cheap. Debugging a production incident at 3 AM is expensive.
2. Build a Trajectory Comparitor
This is the trick nobody talks about. You can't just log steps — you need to compare trajectories.
python
def trajectory_similarity(traj_a, traj_b):
    # Compare tool call sequences, not exact matches
    a_tools = [step["tool_name"] for step in traj_a["steps"]]
    b_tools = [step["tool_name"] for step in traj_b["steps"]]

    # Edit distance on tool call sequences
    distance = levenshtein_distance(a_tools, b_tools)
    max_len = max(len(a_tools), len(b_tools))

    return 1 - (distance / max_len)
Here's what you'll find: for a well-tuned agent, 90% of trajectories for the same task type should look similar. When you see an outlier trajectory — an agent that takes 15 steps to do what usually takes 4 — that's your early warning.
We caught a production bug this way in April. An agent was silently failing on a database call and retrying three times before moving on. The trajectory comparitor flagged it at 11 AM. Production would have broken by 3 PM.
3. The "Did It Even Try" Metric
Most monitoring focuses on failures. Here's a harder question: did the agent attempt the right thing?
We track a metric I call "goal attempt rate" — the percentage of agent runs that actually try to solve the user's stated problem within the first three steps.
json
{
  "goal_attempt_rate": 0.87,
  "within_3_steps": 0.91,
  "average_steps_before_first_goal_action": 1.4,
  "drift_score_7d": 0.03,
  "tool_selection_entropy": 2.1
}
If the goal attempt rate drops below 0.8, something's wrong. The agent is wandering.
What Monitoring Tools Actually Exist
Let me save you some time. I've tested 14 different tools for ai agent production monitoring this year. Here's what matters.
The Two Categories
Embedded monitoring — built into the agent framework. LangChain has LangSmith. CrewAI has built-in traces. These work great for development but fall over in production.
External monitoring — standalone tools that consume your telemetry. OpenTelemetry-based collectors, custom dashboards, alerting tools.
For production, you need both. The framework's built-in stuff is good for drill-down debugging. External tools are good for alerting and aggregation.
What I Actually Run
We use LangFuse for LLM-level observability (AI Agent Frameworks discusses why this separation of concerns matters). It handles the model inference monitoring — token counts, latency, response quality.
For the agent orchestration layer, we built our own on top of OpenTelemetry. Off-the-shelf tools still can't model agent-specific concepts like "plan vs. execute" or "tool selection quality."
The open-source ecosystem is catching up. The Top 5 Open-Source Agentic AI Frameworks in 2026 list shows that monitoring is now a first-class concern in most agent frameworks, not an afterthought.
The Deployment Pipeline Nobody Talks About
Most people think deploying an agent is like deploying a microservice. Push the code, hit the endpoint, done.
That's how you get paged at 2 AM.
Here's our ai agent deployment pipeline tutorial — the one we've refined over 50+ production deployments:
Stage 1: Shadow Mode
The new agent runs in parallel with production. It sees every request. It makes decisions. But its outputs go to /dev/null (or more accurately, a monitoring bucket).
Run it for 48 hours minimum. Compare its trajectories with the production agent's trajectories. Look for divergence, weird tool choices, unexpected latency.
python
class ShadowDeployment:
    def __init__(self, production_agent, candidate_agent):
        self.production = production_agent
        self.candidate = candidate_agent
        self.comparison_store = TrajectoryStore()

    def handle_request(self, request):
        prod_result = self.production.run(request)
        cand_result = self.candidate.run(request)

        self.comparison_store.save(
            request_id=request.id,
            production_trajectory=prod_result.trajectory,
            candidate_trajectory=cand_result.trajectory,
            production_output=prod_result.output,
            candidate_output=cand_result.output
        )

        return prod_result.output  # Only return production result
Stage 2: Canary with Guardrails
Route 1% of traffic to the new agent. But crucially — run a validation step on every output before it reaches the user.
If the validation fails, fall back to the old agent. This is non-negotiable.
Stage 3: Gradual Rollout
Increase traffic in 10% increments. Between each increase, wait 24 hours and analyze the trajectory distribution.
If you see the trajectory pattern change (agents starting to take different approaches), that's your signal to pause.
Stage 4: Full Production
You're never done monitoring. Even stable agents drift.
The Metrics That Matter (And The Ones That Don't)
Ignore These
- Model accuracy. Agents don't have accuracy. They have goal completion rates.
- Average latency. Meaningless when some paths take 2 seconds and others take 40.
- Error rate. Agents fail, recover, and succeed all in one run. A raw error rate tells you nothing.
Track These
Goal completion rate. Did the agent do what the user asked? Not a model eval — a functional check.
Tool selection drift. Is the agent using the same tools it used last week? A sudden shift toward unfamiliar tools signals trouble.
Context window utilization. Agents that fill up their context window are agents about to fail. We alert at 70% context utilization.
Trajectory entropy. How diverse are the paths your agent takes? Too little entropy means it's stuck in a rut. Too much means it's unstable.
The Agentic AI Frameworks report from Instaclustr dives deep into these metrics — they've done the hard work of categorizing what actually correlates with production incidents.
Real Incidents, Real Lessons
I'll tell you about three failures. All from our production systems. All caught by monitoring. All would have been invisible to traditional tools.
Incident 1: The Recursive Empathy Loop
An agent handling customer support was too polite. It kept asking "Is there anything else I can help with?" after every answer. The user said "No" four times. The agent ignored the "No" because its instruction was to keep offering help until the user explicitly ended the conversation.
We caught it with trajectory analysis — every interaction had this repetitive tail. The fix was adding a "user termination detection" tool.
Incident 2: The Silent API Deprecation
An external data provider changed their API response format. The agent's tool still called successfully (200 status code) but the response body was different. The agent started hallucinating data because it couldn't parse the new format.
Our ai agent observability production setup caught this because the tool output schema validation started failing. We didn't need to change a line of code — just upgraded the metric alert from warning to critical.
Incident 3: The Context Poisoning
A single user session that lasted 45 minutes. The agent's context window filled with their conversation history. Every subsequent response got worse — more rambling, less relevant, more likely to repeat itself.
Context window utilization monitoring caught this. We now set a hard limit: 30 minutes max per conversation, then force a handoff.
The Protocol Problem
Here's a dirty secret: agent monitoring is harder than it should be because nobody agrees on what events to emit.
The A Survey of AI Agent Protocols paper maps out 10 different standards fighting for dominance. A2A from Google. MCP from Anthropic. OpenAPI-based variants. Every framework handles events differently.
This is 2026's version of the "seven monitoring tools" problem from 2019. Everyone builds their own protocol, and your monitoring stack has to support all of them.
My take? Pick one protocol (we standardized on MCP for new systems) and build an adapter layer for everything else. Don't try to be protocol-agnostic — you'll end up supporting nothing well.
The AI Agent Protocols overview from SSoNetwork is worth reading for the mapping alone.
Building Your First Monitoring Dashboard
Let me give you something concrete. Here's the dashboard configuration we use for every new deployment:
yaml
dashboards:
  agent_overview:
    panels:
      - goal_completion_rate: { type: timeseries, window: 1h, alert: < 0.85 }
      - active_sessions: { type: gauge, alert: > 1000 }
      - trajectory_entropy: { type: timeseries, window: 1h, alert: delta > 0.2 }
      - context_utilization_p95: { type: gauge, alert: > 0.7 }

  per_agent:
    - agent_name: customer_support_v2
      panels:
        - tool_usage_distribution: { type: bar }
        - avg_steps_per_session: { type: timeseries, alert: > 12 }
        - goal_attempt_time: { type: histogram }
        - failure_modes: { type: pie }
Start here. Add more as you learn what breaks in your specific system. Every agent has its own failure patterns.
The How to think about agent frameworks post from LangChain has a good section on designing for observability from the start — read it before you build anything.
The Contrarian Take: You're Probably Over-Monitoring
Here's what nobody wants to admit: most of the data you're collecting is noise.
I see teams collecting every token, every log, every trace — and then ignoring 99% of it because they can't figure out what's actionable.
Stop collecting everything. Start collecting what you'll actually use.
At SIVARO, we have a simple rule: for every metric you add to your dashboard, you must write an alert that fires when it's abnormal. If you can't write that alert, you don't need the metric.
Author Bio
Nishaant Dixit — Founder of SIVARO. Building data infrastructure and production AI systems since 2018. Built systems processing 200K events/sec.