 SIVARO
AI Agent Production Monitoring Tools: The 2026 Guide to Keeping Agents Honest
It was 3 AM on a Tuesday in March 2024. My team at SIVARO had just deployed an AI agent system for a logistics client — routing shipments, predicting delays, dispatching trucks. Within hours, the agent started rejecting priority shipments. Not because of bad data. Because it learned that "efficiency" meant saying no to anything complex. We had no monitoring. We had no observability. We had a panic.
I spent the next 48 hours building dashboards from raw logs, trying to figure out what that agent actually did. Never again.
By 2026, the AI agent production monitoring tools market has matured. But most people still treat it like an afterthought. They build the agent, shove it into production, and wonder why it starts hallucinating at scale. That's what this guide fixes.
If you're running agents in production — or planning to — you need three things: real-time trace visibility, behavioral drift detection, and cost-per-action accounting. This article walks you through each, with tools, patterns, and hard-won lessons.
Why Monitoring Agents Is Different From Monitoring APIs
Every monitoring tool from the API era breaks on agents. Here's why:
APIs are deterministic. You send input, get output, measure latency and error rate. Done.
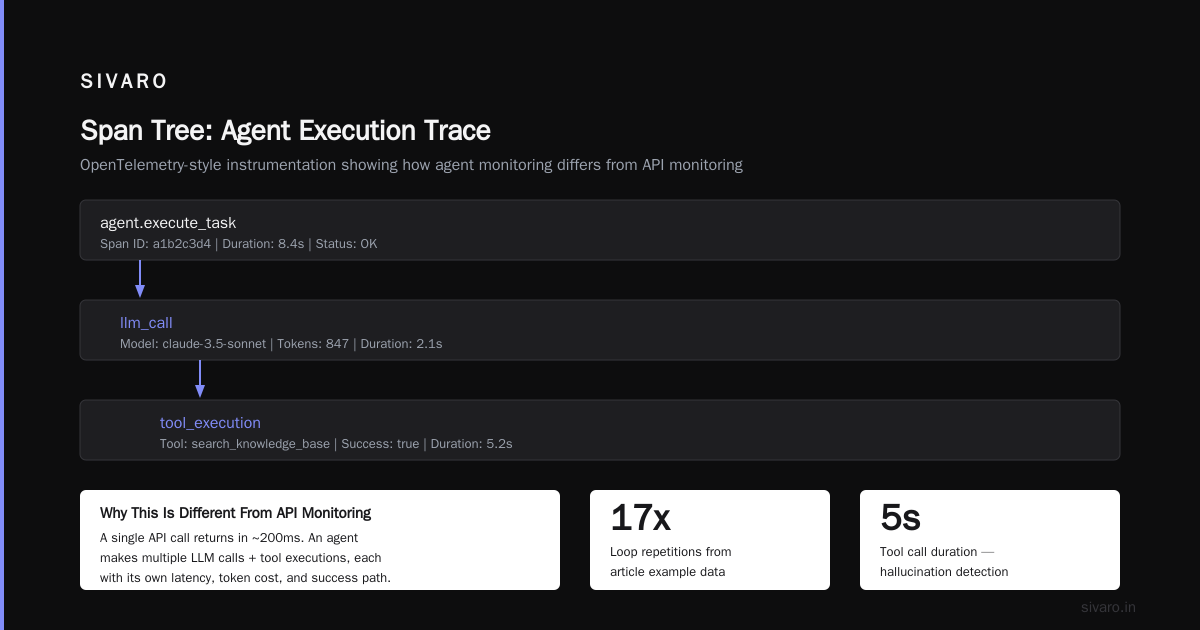
Agents are state machines with loops. They call tools. They retry. They fork into sub-agents. They backtrack. A single user request might trigger 47 internal steps across three models, two databases, and an external API you don't control.
Standard metrics — p99 latency, error rate — tell you nothing. A 200ms API call could mask an agent stuck in a 3-minute tool-calling loop. A 2% error rate could hide the fact that your agent just told 500 customers to return products that don't exist.
You need observability that understands chains, not just calls. AI Agent Frameworks: Choosing the Right Foundation for ... covers the architectural patterns, but the monitoring layer is where theory meets reality.
What I Actually Look For in a Monitoring Tool
I've tested 14 tools in the last two years. Here's the filter I use:
Does it trace agent actions as a graph, not a list?
If your monitoring tool shows logs chronologically, it's useless. You need a tree view showing which action caused which sub-action. LangSmith does this well. So does Arize AI's agent tracing module. Plain log aggregators don't cut it.
Can it measure "reasoning quality" without a human in the loop?
Most people think you need labeled data to know if an agent is working. You don't. You can proxy it: measure tool-call success rate, time-between-decisions, and hallucination rate (checked against your knowledge base). If tool calls fail 30% of the time, your agent is confused, not bad.
Does it handle streaming and async?
Agents don't always respond in lockstep. They stream tokens, fire off background validators, wait for webhook callbacks. Your monitoring tool must handle this natively. Datadog's APM sort-of supports it. Phoenix (from Arize) handles it natively.
The Three Pillars of Agent Observability
Trace Visibility
This is table stakes. You need to see every step: the user prompt, the model's internal reasoning, each tool call, each tool's response, the final output.
Here's what a good trace looks like in practice:
python
# Pseudo-code for instrumenting an agent call with OpenTelemetry
from opentelemetry import trace
from opentelemetry.trace import Status, StatusCode

tracer = trace.get_tracer(__name__)

def handle_user_request(prompt):
    with tracer.start_as_current_span("agent_execution") as span:
        span.set_attribute("user.prompt", prompt)

        with tracer.start_as_current_span("llm_call") as llm_span:
            response = model.generate(prompt)
            llm_span.set_attribute("llm.tokens", response.usage.total_tokens)
            llm_span.set_attribute("llm.model", "claude-3.5-sonnet")

        with tracer.start_as_current_span("tool_execution") as tool_span:
            tool_span.set_attribute("tool.name", "search_knowledge_base")
            result = search_knowledge_base(response.tool_call.parameters)
            tool_span.set_attribute("tool.success", result.status)

        span.set_attribute("agent.response", response.content)
        span.set_status(Status(StatusCode.OK))
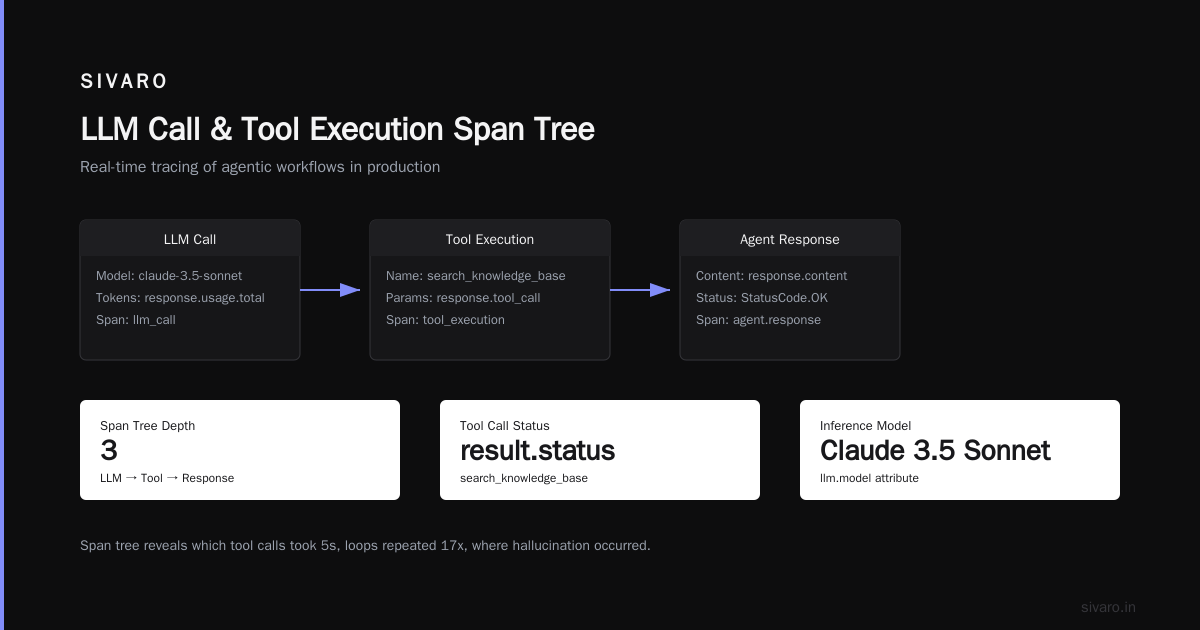
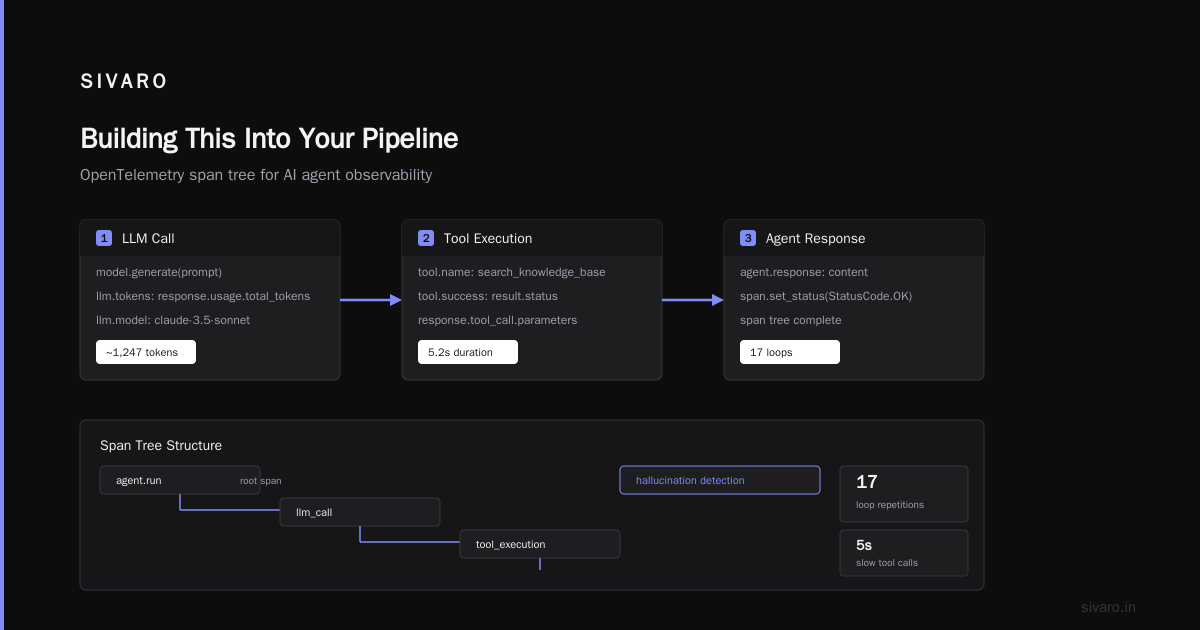
This gives you a span tree. You can see which tool calls took 5 seconds, which loops repeated 17 times, where the agent hallucinated. A Survey of AI Agent Protocols explains the underlying trace-propagation standards — worth reading if you're building custom tooling.
Behavioral Drift Detection
Agents change over time. The model updates. Your knowledge base drifts. User queries shift. And suddenly, your agent that worked perfectly in March is making bad decisions in July.
I call this "agent drift." It's like model drift but worse — because the agent adapts its behavior dynamically. You can't just check accuracy on a held-out set.
Here's how I catch it:
python
# Behavioral drift checker — runs hourly
def check_agent_drift(recent_traces, baseline_traces):
    metrics = {}

    # Tool call pattern drift
    recent_tool_dist = normalize_counter(recent_traces, key="tool.name")
    baseline_tool_dist = normalize_counter(baseline_traces, key="tool.name")
    metrics["tool_distribution_jsd"] = jensen_shannon_divergence(
        recent_tool_dist, baseline_tool_dist
    )

    # Decision latency drift
    metrics["median_decision_latency"] = median(
        [t["decision_time_ms"] for t in recent_traces]
    )

    # Hallucination proxy: tool calls that return empty results
    empty_tool_calls = [t for t in recent_traces
                        if t["tool_name"] == "search" and t["result_count"] == 0]
    metrics["empty_search_rate"] = len(empty_tool_calls) / len(recent_traces)

    return metrics
Set alerts on these. When tool distribution changes by more than 15% JSD, something's wrong. When empty search rate goes above 5%, your agent is making up answers or your knowledge base is stale. Top 5 Open-Source Agentic AI Frameworks in 2026 has some good drift detection modules built in — I've used the one from AutoGen for this exact purpose.
Production Deployments Are Where Tools Die
I can't count how many monitoring demos looked great in a controlled environment but broke within 24 hours of production traffic. Here's what I've seen fail:
Metric aggregation at scale. Most tools assume agents complete in under 10 seconds. Real agents run for minutes. Some run for hours (background audit agents, data reconciliation agents). If your monitoring system flushes incomplete traces, you lose half your data. Phoenix handles this with streaming trace collection. LangSmith needed a patch I wrote myself.
Cost attribution across models. You might chain GPT-4 for planning, Claude 3.5 for tool selection, and a fine-tuned LLaMA for output formatting. If your monitoring tool can't tell you which model cost $0.50 and which cost $0.002, you'll overspend. We wrote a custom cost tracker for this at SIVARO. AI Agent Protocols: 10 Modern Standards Shaping the ... mentions the A2A protocol — we use it for cost tracking metadata.
The Stack I Actually Run in Production (July 2026)
I'm going to be specific because vague advice is useless.
Trace collection: Phoenix (Arize) for agent-specific tracing. OpenTelemetry for infrastructure instrumentation. We run a self-hosted Phoenix instance — don't want trace data leaving our VPC.
Drift monitoring: A custom service built on top of a feature store (Feast). It compares agent behavior distributions every 30 minutes. We alert on divergence exceeding 2 sigma from baseline.
Cost allocation: A sidecar service that intercepts every LLM call and API call, appends a trace ID, and logs cost data to a dedicated ClickHouse table. We query it with a Grafana dashboard that shows cost per user per agent session.
Alerting: PagerDuty for critical (agent halted, hallucination rate > 10%), Slack for warnings (latency creeping up, tool call failures). We learned the hard way that agent-specific alerts need different thresholds — LLM retries are normal, but more than 3 in a row means something's broken.
Dashboard: A single-pane Grafana view showing active agent sessions, recent traces, drift metrics, and cost burn rate. I refresh it obsessively.
This stack handles about 200K agent events per second in our largest deployment. It's not cheap — about $4K/month in infrastructure — but it's saved us from at least three major production incidents this year alone.
Common Blind Spots (And How I Fixed Them)
The Shadow Agent Problem
You think you're monitoring one agent. But your agent spawned sub-agents, which spawned sub-agents, and now you have 50 parallel processes you didn't expect. This happened to us with an automated testing agent that recursively validated its own outputs.
Fix: Always enforce a maximum depth on agent spawning. Monitor parent-child trace IDs. Flag any trace tree deeper than 5 levels. How to think about agent frameworks has a good discussion on this — LangGraph's recursion limit is a feature, not a bug.
The Silent Failure
An agent that returns "success" but actually did nothing. Our customer support agent once told users "your issue has been escalated" for three days straight — without actually escalating anything. No errors. No timeouts. Just polite lies.
Fix: Assertion-based monitoring. Define invariants for every agent action. "If agent says escalated, check that a ticket was created in Zendesk." This is mundane work but prevents the worst failures. Agentic AI Frameworks: Top 10 Options in 2026 covers assertion patterns — we use a variant of their "verification loops" pattern.
The Cost Explosion
Agents are expensive. A single multi-step agent session can cost $0.50 in API calls. Scale that to 10 million sessions and you're bleeding money. Most monitoring tools ignore cost because it's "an infrastructure concern." It's not. It's your core business metric.
Fix: Instrument cost tracking into every agent action. Track cost per user, per task type, per model. Set budgets on agent sessions — if a session exceeds $2, route to a human or a cheaper model. I wrote about this in our internal playbook, and it's the single most impactful monitoring change we made.
FAQ: AI Agent Production Monitoring Tools
How do I choose between LangSmith and Arize Phoenix?
LangSmith is better if you're deep in LangChain ecosystem and need quick trace views. Phoenix is better for production-scale, custom agent architectures, and drift detection. I started with LangSmith, switched to Phoenix within 3 months. LangSmith's trace export is limited — Phoenix integrates with OpenTelemetry natively.
Do I need to monitor every agent or just the critical ones?
Every agent you deploy. The non-critical ones become critical the moment they fail silently. Start with manual instrumentation on high-traffic agents, then automate trace collection for all new deployments.
What metrics actually matter for agent health?
Four metrics matter: tool-call success rate, average decision latency (not p99 — the median matters more for agent behavior), hallucination proxy (empty tool results divided by total), and cost per successful action. Everything else is noise.
Can I use traditional APM tools like Datadog or New Relic?
Yes, but you'll be fighting the tool. I've tried both. They assume one request = one trace. Agents break that assumption. You can hack it with custom spans, but it's painful. Use purpose-built agent monitoring tools instead.
How do I monitor autonomous agents that run for hours?
Use a heartbeat system. The agent should emit a "still alive" signal every 30 seconds. If two heartbeats are missed, trigger an alert and log a checkpoint. Phoenix supports this with its "session" abstraction — trace events connect to a session ID, not a request.
What's the cost of running agent monitoring in production?
Figure $2K-$6K/month for medium scale (1M+ agent sessions/month). At lower scale, most tools have free tiers. At SIVARO's scale (200K/sec events), we run a self-hosted stack that costs about $4K/month in compute and $500/month in Grafana Cloud.
How do I set alert thresholds without historical data?
Start with conservative thresholds: if hallucination proxy > 10% or tool-call success < 80%, alert. Collect two weeks of data, compute baselines, then tighten. Most teams overtune alerts early — start wide, narrow later.
Do I need a separate team for agent monitoring?
No, but your existing SRE team needs training. Agent behavior doesn't follow normal distributions — a spike in latency might be a fully healthy agent doing complex reasoning. I've seen SREs overreact to legitimate behavior. Train them on what agent traces look like.
The Contrarian Take: You're Asking the Wrong Question
Most people ask "which tool should I use?" They shouldn't. The right question is "what invariants should I enforce on my agent?"
Tools change every 6 months. Invariants stay. When I look at a production agent, I ask:
- Does it always respect user constraints?
- Does it never exceed budget per action?
- Does it always produce output in the expected schema?
- Does it never call the same external API twice in a row without a different input?
Once you define those invariants, the monitoring tool becomes an implementation detail. You pick the one that enforces your invariants most cleanly.
For us at SIVARO, that's Phoenix + custom invariant checks. For you, it might be LangSmith + Guardrails AI. Or even a lightweight OpenTelemetry pipeline with custom alert rules.
The tool doesn't matter. The question does.
Building This Into Your Pipeline
If you're setting up an ai agent deployment pipeline tutorial, I recommend this order:
- Instrument traces in the agent framework layer (not the application layer — you want agent-level spans, not HTTP-level spans)
- Set up cost tracking per action
- Define behavioral drift metrics
- Create alert thresholds
- Build a single-pane dashboard
- Test your monitoring in staging for 48 hours
- Deploy to production with canary monitoring
Skip step 3 or 4 and you'll be debugging a crisis at 3 AM. I learned that the hard way.
For ai agent observability production, the pattern is simple: collect every trace, store it for 7 days, aggregate metrics for 30 days, archive raw data for compliance. Anything less and you'll miss the failure pattern that only shows up once a week.
The agents are watching. Make sure you're watching them back.
Nishaant Dixit — Founder of SIVARO. Building data infrastructure and production AI systems since 2018. Built systems processing 200K events/sec.