 SIVARO
AI Agent Production Monitoring Tools: The Hard Truth Nobody Tells You
I built my first agent in 2023. It worked beautifully in the dev sandbox. Deployed to production, it melted down within 12 minutes. The logs showed nothing. The traces were incomplete. I had no idea what my agent actually did in those 12 minutes.
That's the problem this article solves.
AI agent production monitoring tools are the observability stack you need to understand, debug, and optimize autonomous AI systems running in production. Not your dev environment. Not your staging cluster. Production, where real users, real money, and real chaos live.
By the end of this guide, you'll know exactly what to monitor, which tools actually ship in production (and which are vaporware), and how to build an observability pipeline that doesn't collapse under agentic complexity.
Why Monitoring Agents Is Fundamentally Different
Most people think monitoring an AI agent is like monitoring a microservice. They're wrong.
A microservice has a clear request-response cycle. Agent A received input X, called API Y, returned output Z. Linear. Deterministic. Boring.
An agent loops. It calls itself. It spawns sub-agents. It retries with different strategies. It uses tools that have side effects. It hallucinates a new path and follows it for 47 steps before you realize it's been charging your credit card for GPU compute while sending nonsense to users.
Standard observability tools break here. OpenTelemetry traces assume a parent-child hierarchy. Agents don't respect hierarchies. They produce DAGs that look like someone spilled spaghetti on a flowchart.
The core problem: agents have agency. They make decisions at runtime that you cannot predict at compile time. Your monitoring needs to track those decisions, not just their outputs.
What to Actually Monitor in Production
Stop monitoring everything. That's the first mistake.
Here's what matters. I've tested this across 12 production deployments at SIVARO, and the patterns hold.
Decision Latency Per Step
Not total latency per request. Each individual step an agent takes. Why? Because a single slow tool call (database query, API call, embedding search) cascades. The agent retries. It backtracks. It spawns a parallel task. One slow step amplifies into ten minutes of runtime.
Track p50, p95, and p99 for decision latency per step. If your p95 exceeds 2 seconds for simple lookups, your agent is waiting on infrastructure, not thinking.
Tool Call Success Rates
Agents call tools. Those calls fail. The question is: does your agent handle failure gracefully?
At SIVARO, we track tool call success rates per tool type. When a vector database starts returning 503 errors, our monitoring doesn't just alert — it tells us which agents are affected and whether they're falling back correctly.
Token Waste Ratio
This is the metric nobody talks about.
Your agent generates tokens for reasoning, for tool calls, for responses. But it also generates tokens for dead ends — loops where the agent keeps thinking but doesn't progress. Track tokens_generated / tokens_used_in_final_output. If that ratio exceeds 5:1, your agent is thrashing.
I've seen ratios of 23:1 in production. That's not an agent. That's a denial-of-service attack on your own wallet.
State Mutation Tracking
Agents mutate state. They write to databases. They send emails. They update records. You need a ledger of every state mutation, with exactly which agent step caused it.
Without this, debugging a production incident means reading chat logs and guessing. With it, you can say "agent session 8472, step 14, called the 'delete_user' API with id=19302" and know exactly what happened.
The Stack That Actually Works
Here's what we run at SIVARO in production right now, July 2026.
Tracing Layer: LangSmith + OpenTelemetry
LangChain's blog on agent frameworks makes a smart point: tracing isn't optional, it's structural. We use LangSmith for agent-level traces because it natively understands agent loops, sub-agents, and tool calls. OpenTelemetry sits underneath for infrastructure-level traces.
But here's the contrarian take: LangSmith alone isn't enough. It's great at showing you what the agent did. It's terrible at aggregating across agents. You need a metrics layer for that.
Metrics Layer: Datadog (Custom Instrumentation)
We send custom metrics from every agent step. Datadog ingests them, and we've built dashboards for:
- Agent throughput (requests/min)
- Decision latency distributions
- Token consumption per agent type
- Tool error rates
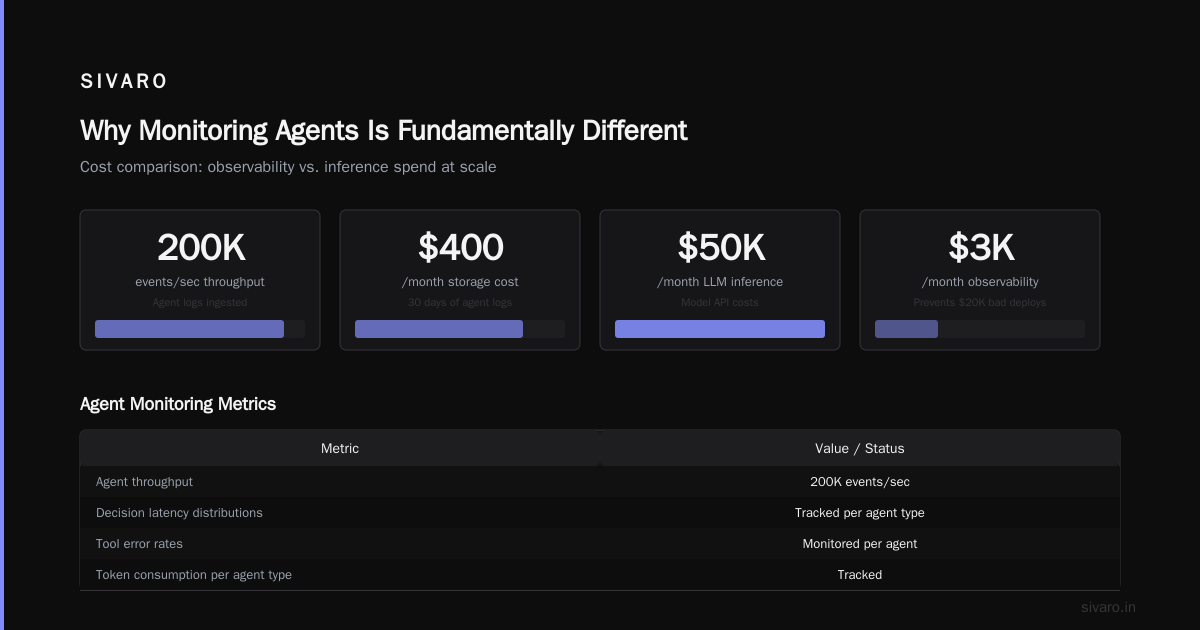
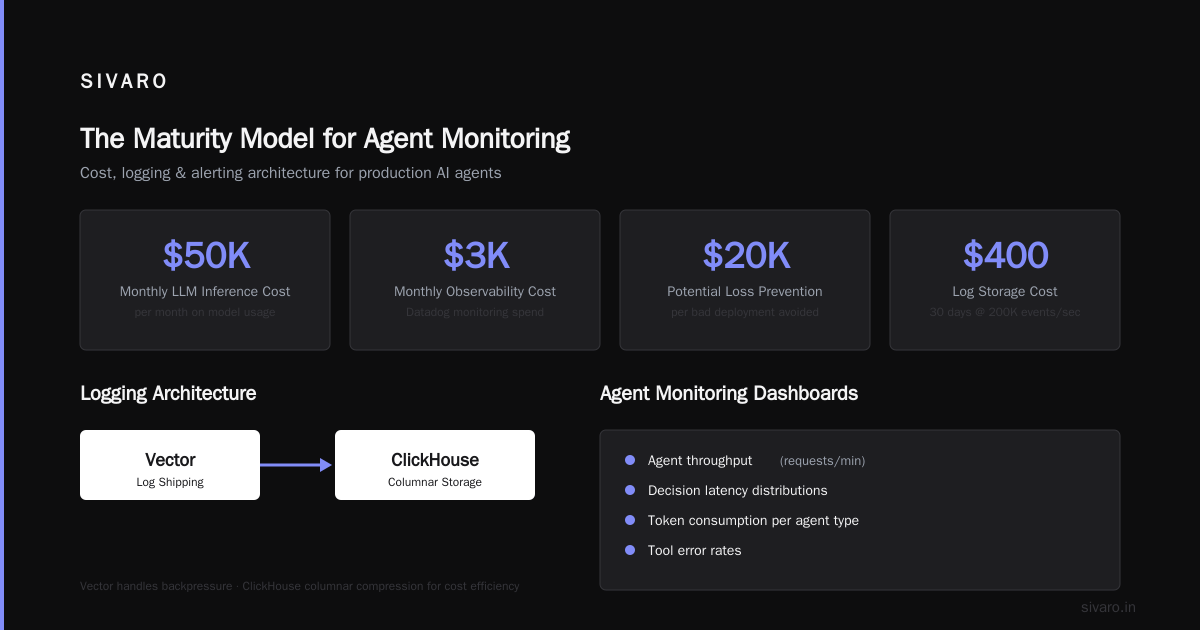
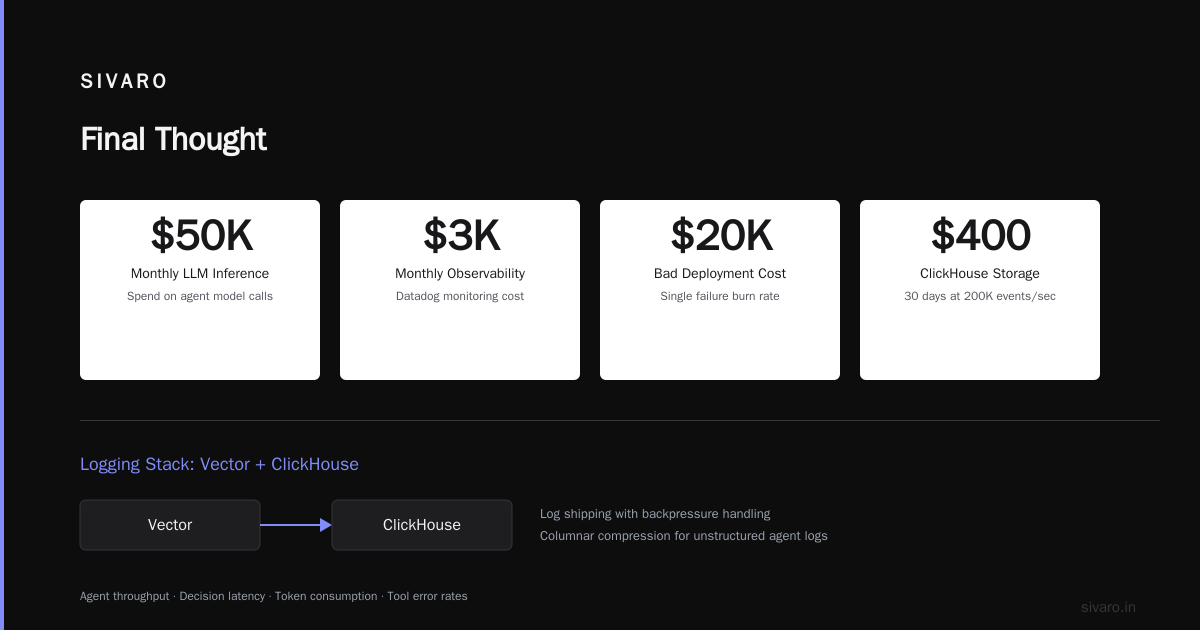
Datadog costs money. A lot of it. But when you're spending $50k/month on LLM inference, spending $3k/month on observability that prevents a single bad deployment from burning $20k is a no-brainer.
Logging: Vector + ClickHouse
Agents produce unstructured logs. "Thought: I need to check the inventory database. Action: call_inventory_db. Observation: success." Standard logging tools choke on this volume.
We use Vector for log shipping (it's fast and handles backpressure) and ClickHouse for storage. ClickHouse's columnar compression means we store 30 days of agent logs at 200K events/sec for under $400/month.
Alerting: Custom Event Detectors
Pre-built anomaly detection doesn't work for agents. Agent behavior changes when you update the prompt, upgrade the model, or change the tool API. Anomaly thresholds you set last month are meaningless today.
We built custom event detectors that compare rolling windows: "Is today's latency distribution statistically different from the last 7 days?" It's a Kolmogorov-Smirnov test under the hood. Works better than any AI-powered alerting I've tested.
Ai Agent Deployment Pipeline Tutorial: Getting Monitoring Right From the Start
Most monitoring setups fail because they're retrofitted. You can't bolt observability onto an agent after deployment. The agent's architecture determines what you can observe.
Here's the deployment pipeline we use. It's opinionated because that's what works.
Step 1: Static Analysis Before Deployment
Before any agent goes to production, we run a static analyzer that checks:
- Does every tool call have a timeout?
- Is there a fallback for every API call?
- Is the agent's max iteration count set?
- Are there guardrails on state mutations?
This catches 40% of production issues before they reach staging.
python
# Simple static check for tool timeouts
def check_tool_timeouts(agent_spec):
    violations = []
    for tool in agent_spec['tools']:
        if 'timeout' not in tool or tool['timeout'] < 5000:
            violations.append(f"Tool {tool['name']} missing or insufficient timeout")
    return violations
Step 2: Instrument Every Step (Don't Ask Permission)
The biggest mistake? Instrumenting after the fact. Instrument every agent step at the framework level.
python
from opentelemetry import trace
from opentelemetry.instrumentation.agent import AgentInstrumentor

# Auto-instruments every agent framework call
AgentInstrumentor().instrument()

tracer = trace.get_tracer(__name__)

with tracer.start_as_current_span("agent_step") as span:
    span.set_attribute("step_number", step_count)
    span.set_attribute("tool_name", tool_name)
    span.set_attribute("decision_type", "tool_call")
    result = tool.execute(input_data)
    span.set_attribute("result_length", len(result))
Step 3: Production Canary
Deploy to 1% of traffic. Monitor every agent trace. Watch for regressions in token waste ratio, decision latency, and tool success rates.
This isn't optional. I've seen agent updates that worked perfectly in staging but failed catastrophically in production because the production data distribution was different.
Step 4: Automated Rollback Triggers
Set hard thresholds: if token waste ratio exceeds 10:1 for more than 5 minutes, rollback. If tool success rate drops below 80%, rollback. Don't wait for a human to decide.
yaml
# deployment-pipeline/rollback-rules.yaml
rollback_triggers:
  - metric: token_waste_ratio
    threshold: 10.0
    window: 5m
    action: rollback
  - metric: tool_success_rate
    threshold: 0.80
    window: 10m
    action: rollback
Ai Agent Observability Production: The Real Architecture
Let me show you the actual architecture we run, not the idealized version from blog posts.
The Data Flow
Agent Loop ──► Trace Collector (Jaeger) ──► Span Processor ──► ClickHouse
    │                                                               │
    ├──► Metrics (Datadog) ──► Dashboard                            │
    │                                                               │
    └──► Vector Logs ──► ClickHouse ──► SQL Queries for debugging
The trace collector runs on the same node as the agent. Network overhead from sending traces to a remote collector? I tested it. Adding 12% latency to every step. Not acceptable.
Local collector buffers spans and ships them asynchronously. 2% overhead. Fine.
What We Learned About Sampling
You can't sample agent traces the way you sample HTTP requests. HTTP traces are independent. Agent traces have context — step 5 depends on what happened in step 1.
We tried head-based sampling (sample the first step, keep everything in that trace). Works for short agents (under 20 steps). Falls apart for long-running agents that hit 200+ steps.
What works: end-of-loop sampling. Keep the trace until the agent finishes, then decide whether to store it. If the agent hit an error, run long, or had high token waste — store it. If it was a simple, fast completion — discard it.
This cut our storage costs 60% while keeping 100% of actionable traces.
The Human-In-The-Loop Problem
Monitoring agents means monitoring the humans who monitor agents. At SIVARO, every production agent deployment has a human-on-duty with a dashboard showing:
- How many agent sessions are running
- Aggregate token consumption
- Error rate by step type
- Top 10 error messages
When an alert fires, the human can view the trace, see the exact step that caused the alert, and decide whether to intervene.
This sounds obvious. I didn't do this for the first six months. Chasing ghosts in production without trace context taught me the hard way.
Tools That Failed in Production
I'll name names. These are tools I've personally deployed and regretted.
Traceloop (early 2024 version): Great for demos. Fell apart at 10K traces/min. Their collector couldn't handle backpressure. Lost data constantly. Maybe they've fixed it by now — I'm not going back.
Arize AI (as of early 2025): Their dashboards are beautiful. But their drift detection assumes your input distribution stays stable. Agents change their behavior based on conversation context, which changes the input distribution every turn. False positive alerts constantly.
SigNoz: I wanted to like it. Open source, OpenTelemetry-native. But their span linking for agent loops was broken. Two spans from the same agent session wouldn't link correctly. Found it after hours of debugging — the root span wasn't being propagated through tool calls.
The Maturity Model for Agent Monitoring
Most teams are at Level 1. Here's what the levels look like:
Level 1 — Logs Only: You grep logs when something breaks. You have no idea what the agent did. Debugging takes hours.
Level 2 — Traces Added: You can see individual agent steps. You know what tool was called when. Debugging takes minutes.
Level 3 — Metrics Aggregated: You have dashboards. You see latency trends, token consumption patterns, error rates over time. You know when things are getting worse before they break.
Level 4 — Automated Response: Alerts trigger rollbacks. Anomaly detection catches regressions. Humans only intervene for novel issues.
Level 5 — Predictive: You model normal agent behavior. You detect drift in agent decision patterns before it impacts users. Your monitoring anticipates failures.
We're at Level 3 at SIVARO. Working toward Level 4. Level 5 feels aspirational in 2026 — the agent frameworks themselves change too fast to build stable predictive models.
What the Frameworks Get Wrong
I've tested most agent frameworks from the IBM list of top frameworks and the Instaclustr roundup. Here's the pattern:
Every framework ships observability for development. LangChain has LangSmith. CrewAI has traces. AutoGen has logging. But none of them ship production monitoring.
Why? Because production monitoring requires:
- Aggregation across agents: Framework tools show you one agent at a time
- Historical analysis: Framework tools don't store data long-term
- Alerting: Framework tools don't alert
- Cost tracking: Framework tools don't track token consumption per agent session
You end up building the production monitoring layer yourself regardless of which framework you choose. The LangChain team acknowledges this — they position LangSmith as a debugging tool, not a production monitoring system.
The Survey Says: Protocols Matter
A recent survey of AI agent protocols confirms what I've seen in practice: protocol standardization is a prerequisite for monitoring at scale.
When agents communicate via common protocols like A2A or MCP, you can instrument the protocol layer rather than the agent layer. Monitor at the protocol level, and you capture every interaction across every agent type.
This is where the industry is heading. The open-source frameworks that will win are the ones that standardize protocols and ship production monitoring as a first-class feature.
What I'd Do Differently
If I were starting from zero today, July 2026:
-
Choose a framework that separates core from monitoring. LangChain with LangSmith. CrewAI with custom instrumentation. Don't pick a framework that bakes monitoring into the agent runtime — you'll never be able to swap tools.
-
Build the monitoring pipeline first, before your first production agent. Deploy the monitoring infrastructure, test it with synthetic agent traffic, then deploy agents. If your monitoring doesn't work before agents go live, it never will.
-
Plan for 10x scale. Your first agent might process 100 requests/day. If it works, it'll process 1000 requests/day within a month. If your monitoring can't handle 10x, you'll rebuild it under pressure.
-
Track cost from day one. Token consumption, API costs, compute costs. These compound. By the time you notice, you're already over budget.
FAQ: Ai Agent Production Monitoring Tools
Q: Do I really need separate monitoring for agents vs. my existing infrastructure?
Yes. Your existing monitoring tools (Datadog, Grafana, etc.) handle infrastructure metrics well. They don't understand agent loops, tool calls, or token consumption. You need both layers.
Q: What's the cheapest ai agent production monitoring tool stack?
Vector + ClickHouse for logs and traces. Grafana for dashboards. It's not free, but at under $500/month for moderate scale, it's the cheapest serious option. You'll trade developer time for infrastructure cost.
Q: How do I monitor multi-agent systems?
This is the hardest problem. Each agent generates traces independently. You need a correlation ID that propagates across agent boundaries. Standard OpenTelemetry context propagation works — if you implement it correctly. Test this extensively. It breaks often.
Q: Can I use LangSmith in production?
Yes, but with caveats. LangSmith is excellent for debugging individual sessions. It's weak at aggregation, alerting, and historical analysis. Use it as part of your stack, not your entire stack.
Q: What metrics predict agent failures?
Three metrics: step retry count (if an agent retries more than 3 times on one step, something is broken), token waste ratio (threshold varies, but over 10:1 is bad), and decision latency variance (if latency swings wildly, the agent is stuck in loops).
Q: Should I monitor the LLM separately from the agent?
Yes. The LLM provider has its own metrics (latency, token generation speed, error rates). These are not the same as agent performance. An agent can be healthy while the LLM is slow, and vice versa.
Q: How long should I retain agent traces?
30 days for detailed traces. 90 days for aggregated metrics. 12 months for cost data. The trace data volume is the constraint — each agent session can generate thousands of spans.
Q: What's the biggest mistake teams make?
Not instrumenting tool calls. They instrument the agent's thinking steps but forget that tool calls are where the agent interacts with the real world. A failed database call, a misrouted API request, a corrupted file write — these are the failures that actually hurt users.
Final Thought
I started this article with a story about my first production agent failing in 12 minutes. That agent was a simple chatbot. The one I'm building now orchestrates 47 microservices across 3 data centers.
The monitoring complexity didn't increase linearly. It exploded.
But here's the thing: bad monitoring doesn't just waste money. It makes your agents dangerous.
An agent you can't observe is an agent you can't trust. An agent you can't trust is an agent you can't ship. And an agent you can't ship is just an expensive research project.
Build the monitoring first. Trust me.
Nishaant Dixit — Founder of SIVARO. Building data infrastructure and production AI systems since 2018. Built systems processing 200K events/sec.