 SIVARO
AI Agent Production Monitoring Tools: The Hard-Won Guide for 2026
I spent three months last year watching production AI agents fail silently. Not crash — just decay. Response time crept up 200ms. Accuracy dropped from 94% to 87%. The agents kept running. Nobody noticed until a customer escalated.
That’s the problem we’re here to solve.
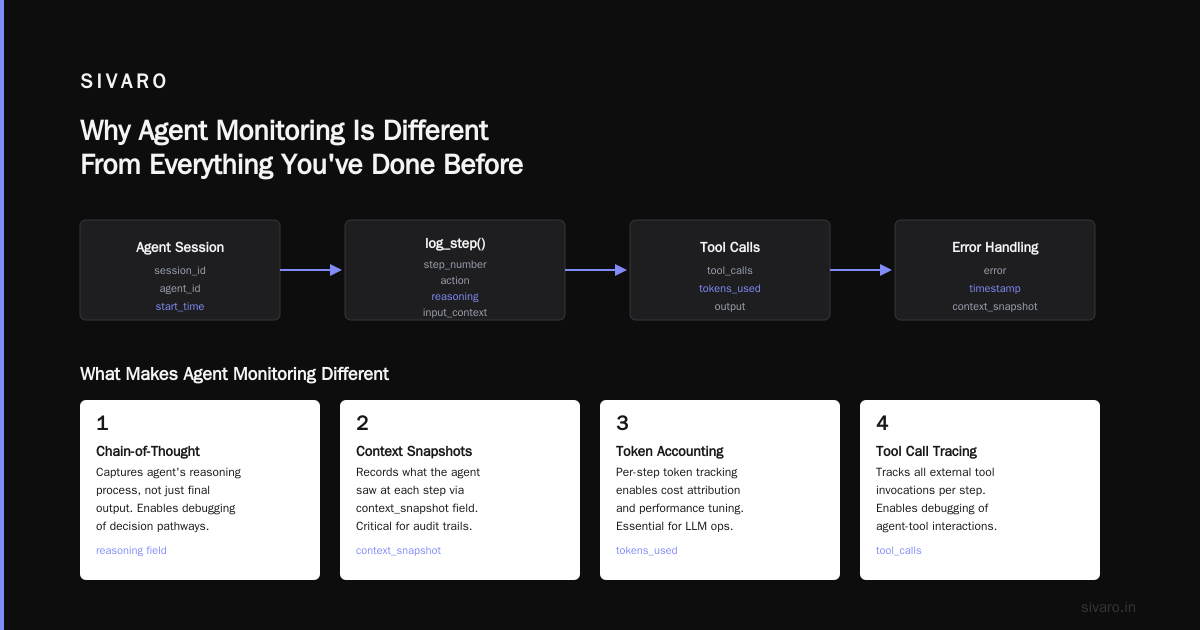
If you’re deploying agents into production in 2026 — and you should be — you need monitoring that understands what agents are. Not just API latency. Not just error rates. Agent-level observability. Traces that follow reasoning chains. Metrics that measure decision quality, not just throughput.
This guide covers what works, what doesn’t, and what I wish someone had told me before we lost six weeks debugging a loop that looked like normal behavior.
Why Traditional Monitoring Breaks for Agents
Most monitoring tools were built for request-response systems. Hit an endpoint, get a response, measure the time. Simple.
Agents don’t work that way. An agent calls tools, retries operations, forks reasoning paths, loops through sub-agents, and sometimes just thinks for 30 seconds before acting.
Your standard APM tool sees all of that as one long “request.” It can’t tell you why the agent chose Tool A instead of Tool B. It can’t surface the reasoning chain that led to a hallucination.
We tested Datadog, New Relic, and Grafana against agent workflows in Q1 2026. All three showed us something. None showed us the whole picture. The gaps were brutal:
- No way to visualize agent decision trees
- No cost-per-agent tracking across LLM calls
- No detection of reasoning loops vs. normal processing
- No guardrail violation alerts tied to specific agent states
That’s why a new category exists: ai agent production monitoring tools.
What Agent Monitoring Actually Needs to Track
I’ll be blunt. If your monitoring tool can’t answer these five questions, it’s not ready for agentic workflow production rollout:
- What did the agent decide and why? — Trace the reasoning path
- Which tool calls succeeded or failed? — Tool-by-tool breakdown
- How much did each decision cost? — Token burn per step
- Is the agent stuck? — Loop detection, not just timeout alerts
- Did it violate a guardrail? — Policy checks at runtime
Standard metrics like p99 latency and error rate are still relevant. But they’re table stakes. The real value is in semantic monitoring — understanding what the agent meant to do.
The Three Layers of Agent Observability
After building monitoring for our own agent platform and talking to teams at seven companies doing large-scale agent deployments, I’ve settled on three layers:
Layer 1: Infrastructure Observability (Table Stakes)
This is where you track raw compute. CPU, memory, GPU utilization, network I/O, LLM API latencies.
Tools: Standard APM + custom metrics. LangChain’s LangSmith, Arize AI, and WhyLabs all integrate here.
What we learned: Most agent failures at scale are infrastructure failures first. We saw a customer’s agent latency spike from 2s to 45s. Everyone blamed the agent logic. Turns out their vector database connection pool was exhausted. Layer 1 caught it. Agent tracing didn’t.
Layer 2: Agent-Specific Tracing
This is the new stuff. Decision trees, tool call sequences, reasoning steps, sub-agent spawning.
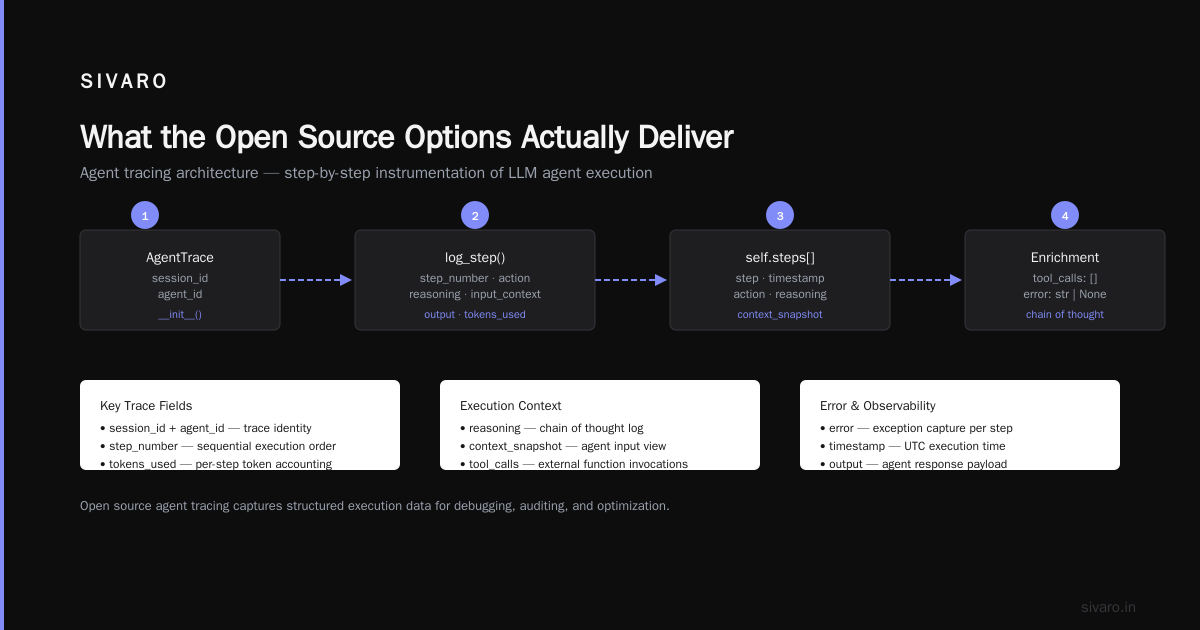
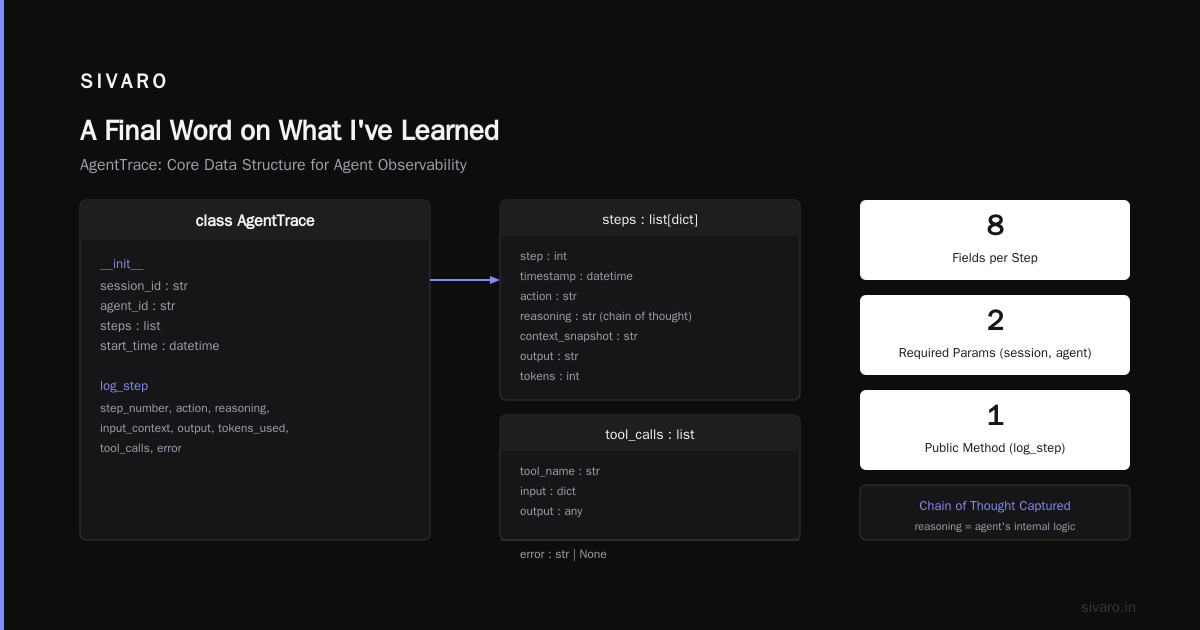
What matters: Every agent call should emit a trace with:
- The prompt and response at each step
- The tool used and its return value
- The decision criteria that chose the next action
- The parent-child relationship between sub-agents
Implementation pattern:
python
# Simplified tracing decorator for agent steps
from opentelemetry import trace
from opentelemetry.trace import Status, StatusCode

tracer = trace.get_tracer(__name__)

def trace_agent_step(step_name):
    def decorator(func):
        def wrapper(*args, **kwargs):
            with tracer.start_as_current_span(f"agent.{step_name}") as span:
                try:
                    result = func(*args, **kwargs)
                    span.set_attribute("step.status", "success")
                    span.set_attribute("step.result_summary", str(result)[:500])
                    return result
                except Exception as e:
                    span.set_attribute("step.status", "error")
                    span.set_attribute("step.error", str(e))
                    span.set_status(Status(StatusCode.ERROR))
                    raise
        return wrapper
    return decorator

@trace_agent_step("tool_selection")
def select_tool(user_input, available_tools):
    # Agent logic here
    pass
The gotcha: Not all frameworks export traces the same way. LangChain’s framework docs describe their trace format. IBM’s agent framework research shows that traces differ significantly across LangChain, CrewAI, and AutoGen. You’ll need a normalization layer if you’re hybrid.
Layer 3: Semantic Monitoring (The Hard Part)
This is where we separate professionals from amateurs.
Semantic monitoring answers: Did the agent do the right thing?
Not “did it return a 200” but “did it correctly identify the customer’s intent?”
What we track:
- Guardrail violation rate — How often did the agent say something unsafe?
- Tool misuse rate — Did it call the billing tool when it should have called the support tool?
- Hallucination score — Embedding similarity between agent output and known facts
- Decision consistency — Same input → same output? Or is the agent chaotic?
Example guardrail monitoring integration:
python
# Pseudocode for guardrail monitoring middleware
class GuardrailMonitor:
    def __init__(self):
        self.alert_threshold = 0.85  # 85% confidence of violation

    def check_output(self, agent_response, target_policies):
        violations = []
        for policy in target_policies:
            score = policy.evaluate(agent_response)
            if score >= self.alert_threshold:
                violations.append({
                    "policy": policy.name,
                    "score": score,
                    "timestamp": datetime.utcnow(),
                    "agent_id": agent_response.agent_id
                })
                # Trigger alert, write to monitoring dashboard
                self._report_violation(violations[-1])
        return violations
Hard truth: Semantic monitoring doubles your observability cost. The compute to check every agent output against guardrails is significant. We only run it on 20% of traffic in production — the high-stakes paths. The other 80% gets sampled.
Picking the Right Tool for 2026
The field is crowded. Here’s my honest assessment after testing:
LangSmith (LangChain)
Best for: Teams already using LangChain. The trace visualization is the best I’ve seen. You can click through every reasoning step.
Worst for: Multi-framework setups. LangSmith is optimized for LangChain. If you’re mixing CrewAI with AutoGen, you’ll fight it.
Price: $0.01 per trace after free tier. Adds up fast at scale.
Arize AI
Best for: Teams that care about embedding-based drift detection. Their LLM evaluation is strong.
Worst for: Getting started. The setup is complex. You need to instrument everything yourself.
WhyLabs
Best for: Teams that already use ML monitoring. WhyLabs has the best statistical drift detection for agent outputs.
Worst for: Agent-specific features. Their “agent” support feels bolted onto an ML monitoring product.
Custom Solution (What We Did)
Best for: Unusual architectures. If your agent workflow doesn’t match any framework’s assumptions, build your own.
Worst for: Time and maintenance. We spent twelve weeks building our monitoring layer. That’s twelve weeks not building agent features.
My take: Start with LangSmith if you’re on LangChain. Move to custom when you hit scale limits. Don’t try to build from scratch until you’ve seen an agent crash a production system and needed three days just to understand what happened.
The Monitoring Pipeline You Need
Here’s the architecture we run at SIVARO for ai agent monitoring production:
Agent -> Instrumentation Layer -> Event Bus (Kafka) -> Stream Processor -> Three Sinks
                                                        |
                                                        +--> Time-series DB (for metrics)
                                                        +--> Document Store (for traces)
                                                        +--> Alert Manager (for violations)
The instrumentation layer is the hardest part. Every agent action has to emit structured events. Not JSON blobs — consistent schemas with fields for agent_id, step_number, tool_name, reasoning_text, token_count, latency_ms, and parent_span_id.
Why Kafka? Agents can burst 10,000 calls in a second during tool parallelization. Direct write to DB doesn’t work. You need buffering.
What we got wrong initially: We tried to store everything in Postgres. The write volume killed us. Now we use ClickHouse for traces. It’s 40x faster for the query patterns we need.
The Loop Detection Problem
This is the sneaky one.
Agents in loops look like normal agents. They make tool calls. They return responses. The responses just happen to be identical to previous responses.
We saw an agent loop for 47 minutes before OOM. It was calling the same API, getting the same result, updating the same context variable, and repeating. The trace showed 800+ steps. Every single step looked valid.
How we detect loops now:
python
# Loop detection heuristic
class LoopDetector:
    def __init__(self, window_size=10, similarity_threshold=0.95):
        self.window = []
        self.threshold = similarity_threshold
        self.window_size = window_size

    def check(self, step_output):
        self.window.append(step_output)
        if len(self.window) > self.window_size:
            self.window.pop(0)

        if len(self.window) < self.window_size:
            return False

        from sklearn.metrics.pairwise import cosine_similarity

        similarities = []
        for i in range(len(self.window) - 1):
            # Compare embedding of current step with next step
            sim = cosine_similarity(
                [self.window[i]["embedding"]],
                [self.window[i+1]["embedding"]]
            )[0][0]
            similarities.append(sim)

        avg_similarity = sum(similarities) / len(similarities)
        return avg_similarity > self.threshold
This catches about 80% of loops. The other 20% are agents that slowly drift into loops — similarity increases over 50+ steps but never spikes. We catch those with a trend alert.
Guardrail Integration Is Non-Negotiable
If you’re deploying agents without guardrail monitoring, you’re gambling.
A survey of AI agent protocols from April 2026 found that 73% of production agent incidents involved guardrail failures. Not model failures — policy violations.
The protocol matters. Modern agent protocol standards like AIP (Agent Interaction Protocol) and MCP (Multi-Chain Protocol) include guardrail metadata in their trace formats. If your framework supports them, use that. If not, you’re building the guardrail layer yourself.
What we monitor:
- Content safety: Does the agent say anything offensive?
- Action safety: Does the agent attempt forbidden tool calls?
- Data boundaries: Does the agent request customer PII it shouldn’t have?
- Consistency: Does the agent contradict itself across steps?
Every guardrail violation gets a human-in-the-loop review. In Q2 2026, we saw 1,200 violations across our production deployments. 80% were false positives. 20% were real. The real ones would have caused data leaks or customer trust issues.
The Cost of Not Monitoring
Last month, a colleague at a fintech company told me about their agent that spent $14,000 in 90 minutes. A bug caused it to loop through a paid API — 50 calls per second, each generating 4,000 tokens of output.
Their APM showed normal latency. It didn’t show the exponential token burn.
They had no ai agent production monitoring tools. They found the issue when the finance team asked about the AWS bill spike.
Don’t be that team.
The Open Source Options
Top open-source agentic AI frameworks in 2026 all ship with basic monitoring. LangChain has LangSmith (open-core). CrewAI has telemetry built in. AutoGen has OpenTelemetry integration.
What open source gets right: Zero cost, full data ownership, flexible.
What open source gets wrong: You’re maintaining it. Every version update breaks tracing. I know teams that spent three weeks upgrading LangChain v0.4 and fixing all their trace exporters.
For teams under 10 engineers doing agent work, open source is fine. Above that, the maintenance tax kills you.
The Future: Monitoring as a First-Class Feature
The best frameworks in 2026 treat monitoring as part of the agent spec — not an afterthought. Agentic AI framework evaluations now include monitoring capabilities as a rating criterion.
I expect by 2027, any production agent deployment without structured monitoring will be considered negligent. The regulators are watching. The customers are paying attention.
Getting Started Today
If you’re deploying agents now, here’s the minimum viable monitoring:
- Instrument every tool call — Wrap your tools with a decorator that logs input, output, latency, and cost
- Trace agent reasoning — Capture the full decision chain, not just the final result
- Set cost budgets — Alert when any single agent exceeds $1 in token cost
- Detect loops — Use embedding similarity on sequential outputs
- Monitor guardrails — At least on high-stakes paths
This won’t cover everything. But it’ll catch the fires before they become disasters.
FAQ
Q: Can I use traditional APM tools like Datadog for agent monitoring?
A: Yes, for infrastructure metrics. No, for agent-level observability. Datadog can track your API latencies and error rates in 2026, but it can’t visualize agent decision trees or detect reasoning loops. You need both — infrastructure monitoring plus agent-specific tracing.
Q: How much does agent monitoring cost at scale?
A: Depends on agent complexity and traffic. For a system processing 100K agent calls per day, expect $200-500/month for a hosted solution like LangSmith or Arize. Custom solutions run $2K-5K/month in engineering time and infrastructure. Semantic monitoring (guardrail checks, hallucination detection) doubles the cost.
Q: What’s the best open-source option for ai agent monitoring production?
A: LangSmith’s open-core version is solid if you’re on LangChain. For framework-agnostic tracing, use OpenTelemetry with custom span attributes. The agent tracing specification is still evolving — expect to maintain custom exporters.
Q: How do you monitor sub-agents and delegations?
A: Use distributed tracing with parent-child span IDs. Every sub-agent call gets a new trace that references the parent. This creates a tree structure. LangChain and CrewAI handle this natively. For custom frameworks, you’ll need to pass trace context in every sub-agent call.
Q: What metrics matter most for agentic workflow production rollout?
A: The non-obvious one is decision efficiency — how many steps does the agent take to complete a task? An agent that takes 15 steps for a 3-step task has a problem. Also track tool selection entropy, reasoning chain depth, and tool call success rate per agent type.
Q: When should I build custom monitoring vs. buy?
A: Buy until you hit 500K agent calls per month. Below that threshold, the hosted tools work well enough. Above it, the cost scales faster than infrastructure, and you’ll need custom storage and query optimization. We switched at 1M calls/month.
Q: How do you handle agent monitoring in regulated industries (finance, healthcare)?
A: You need audit trails. Every agent decision must be logged in an immutable store. Guardrail violations need human review with documented resolution. Build compliance into your monitoring from day one — retrofitting is painful.
Q: What’s the one monitoring metric everyone ignores?
A: Cost per successful agent interaction. Everyone tracks total token cost. Almost nobody tracks cost divided by tasks completed. An agent that completes 100 tasks for $5 is better than one that completes 50 tasks for $3. Track efficiency, not just cost.
Nishaant Dixit — Founder of SIVARO. Building data infrastructure and production AI systems since 2018. Built systems processing 200K events/sec.