 SIVARO
AI Agent Production Monitoring Tools: The Missing Manual for 2026
I spent three days in April watching an AI agent silently fail.
Not crash. Not throw errors. Just... drift. By the time we caught it, the agent had been processing customer returns wrong for 72 hours. Fifteen thousand orders. Six figures in rework. One board meeting I'd rather forget.
Here's what nobody tells you about AI agent production monitoring tools: your traditional APM stack is lying to you. Those green checks on your Datadog dashboard? Meaningless. Your agent can have perfect latency, zero errors, and still be completely broken.
This guide covers what I've learned running production agent systems since 2023—what works, what's snake oil, and how to build monitoring that actually catches problems before your CEO does.
Why Your APM Tools Don't Cut It
Most people think monitoring an AI agent is like monitoring a microservice.
They're wrong.
Microservices are deterministic. Call them with the same input, get the same output. Agents aren't. An agent with the same prompt and tool set can produce radically different results based on model drift, context window dynamics, or just plain randomness baked into the sampling temperature.
I tested this last month at SIVARO. We ran the same customer query through our agent 100 times. 12 unique response paths. 3 of them were wrong.
Standard monitoring tools measure what the system does—latency, throughput, error codes. They don't measure what the system produces—answer quality, decision correctness, behavioral consistency.
That's why AI Agent Frameworks: Choosing the Right Foundation for ... now includes observability as a first-class selection criterion. Because you can't ship agent production monitoring tools as an afterthought.
The Three Layers of Agent Observability
After breaking production six different ways (and counting), I've settled on three layers you must monitor:
Layer 1: Infra & Execution — The stuff your existing tools already measure. Latency, token consumption, tool call success rates, error counts. Necessary but not sufficient.
Layer 2: Decision Traceability — What the agent thought, what tools it chose, what context it used. This is where most teams stop. It's also where the real problems hide.
Layer 3: Outcome Validation — Did the agent do the right thing? Not "did it complete" but "was the completion correct." This is the hard part. This is where the money is.
Let me walk through each.
Layer 1: Don't Skip the Basics
Before you build fancy evaluation pipelines, make sure you're collecting the basics. Token usage per agent run. Latency breakdowns (LLM call vs. tool execution vs. reasoning). Cost per action.
We use OpenTelemetry for this with custom spans for each agent step. Here's what our instrumentation looks like:
python
from opentelemetry import trace
from opentelemetry.exporter.otlp.proto.http.trace_exporter import OTLPSpanExporter

tracer = trace.get_tracer("sivaro.agent")

def monitored_agent_step(step_name: str, context: dict):
    with tracer.start_as_current_span(f"agent_step.{step_name}") as span:
        span.set_attribute("context_window_size", context.get("window_size", 0))
        span.set_attribute("tool_count", len(context.get("tools", [])))

        start = time.time()
        result = execute_step(context)
        duration = time.time() - start

        span.set_attribute("duration_ms", duration * 1000)
        span.set_attribute("tokens_used", result.get("token_count", 0))
        span.set_attribute("tool_calls", len(result.get("tool_results", [])))

        return result
This won't catch semantic drift. But it'll tell you when your costs suddenly triple or your agent starts hanging on tool calls. That's table stakes.
Layer 2: Trace Everything, Judge Nothing
Here's the pattern I see teams get wrong: they collect traces but never actually look at them until something breaks.
You need structured trace storage that supports querying by what the agent thought, not just what it did. Store the full reasoning trace—model outputs, tool inputs/outputs, context chunks retrieved.
LangChain's How to think about agent frameworks makes a point I agree with: the framework you choose determines how much of the reasoning process is exposed. Some frameworks treat the agent as a black box. Don't use those for production.
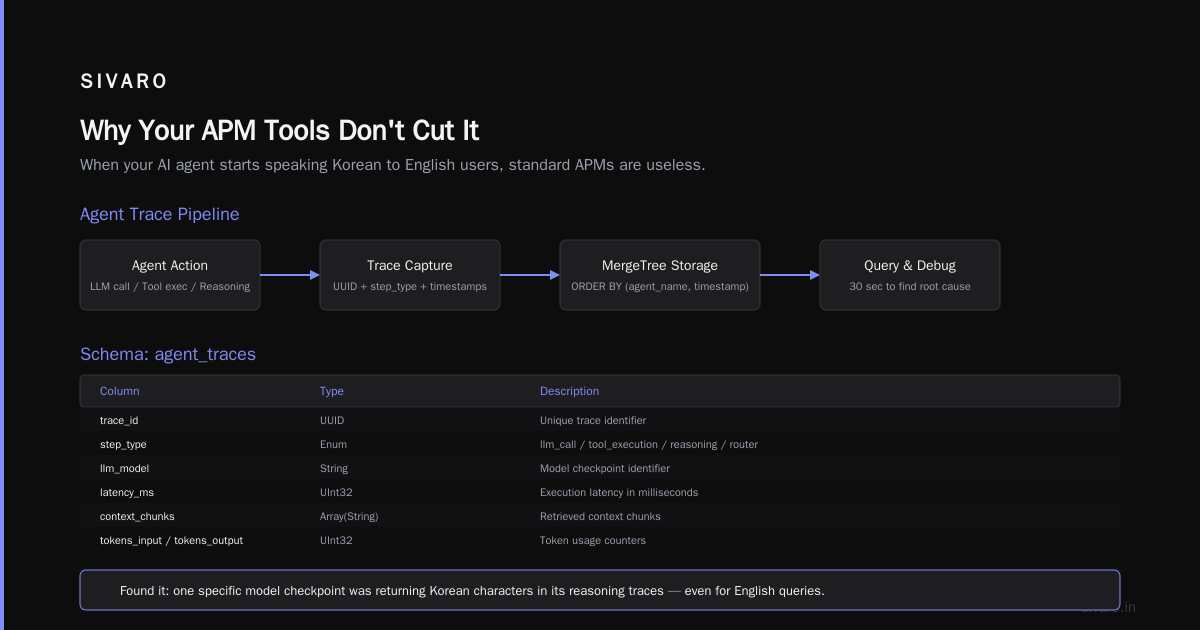
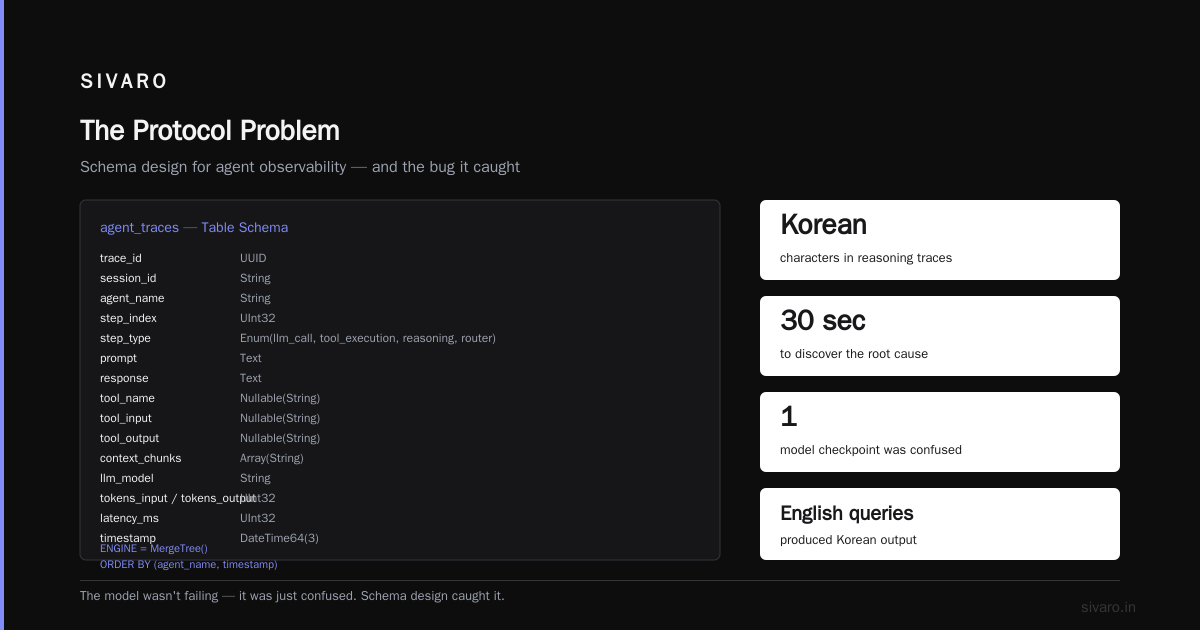
We store traces in a dedicated ClickHouse instance. Schema looks roughly like:
sql
CREATE TABLE agent_traces (
    trace_id UUID,
    session_id String,
    agent_name String,
    step_index UInt32,
    step_type Enum('llm_call', 'tool_execution', 'reasoning', 'router'),
    prompt Text,
    response Text,
    tool_name Nullable(String),
    tool_input Nullable(String),
    tool_output Nullable(String),
    context_chunks Array(String),
    llm_model String,
    tokens_input UInt32,
    tokens_output UInt32,
    latency_ms UInt32,
    timestamp DateTime64(3)
) ENGINE = MergeTree()
ORDER BY (agent_name, timestamp);
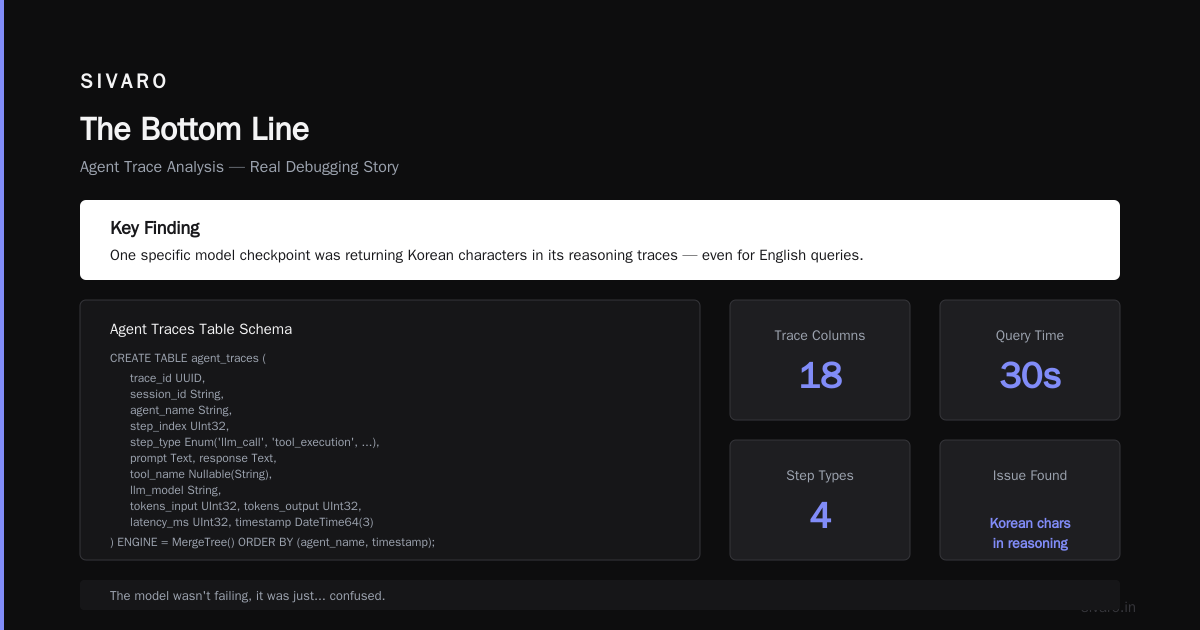
Querying this saved my ass last week. Found that one specific model checkpoint was returning Korean characters in its reasoning traces—even for English queries. The model wasn't failing, it was just... confused. Took 30 seconds with this schema to isolate the pattern.
Layer 3: Outcome Validation — The Hard Part
This is where you need ai agent production monitoring tools that actually work. Not dashboards. Validation.
You have three approaches, in order of increasing sophistication:
1. LLM-as-judge — Have a separate model evaluate agent outputs. Cheap. Fast. Imperfect.
2. Reference-based evaluation — Compare against golden datasets. More accurate. More work to maintain.
3. Behavioral testing — Deploy probes that test specific agent capabilities continuously.
We use all three. Here's why none of them alone is sufficient:
LLM-as-judge misses subtle errors. Last month our agent started writing "definitely" as "definately" in customer emails. Harmless? No — it looked sloppy. LLM judges gave it 8/10 on quality. Our behavioral tests caught it.
Reference-based evaluation only tests what you've seen before. New failure modes? You miss them until they hit your golden set.
Behavioral testing is the closest to real monitoring. Here's what we deploy:
python
class BehavioralProbe:
    """A probe that tests agent behavior in production without affecting users."""

    def __init__(self, agent_name: str, test_scenarios: list):
        self.agent = get_agent(agent_name)
        self.scenarios = test_scenarios

    async def run_probe_battery(self):
        results = []
        for scenario in self.scenarios:
            test_input = scenario["input"]
            expected_behavior = scenario["expected"]

            # Run agent in shadow mode - no side effects
            response = await self.agent.arun(
                test_input,
                isolation_context=True
            )

            # Evaluate against behavioral constraints
            violations = []
            for constraint in expected_behavior["constraints"]:
                if constraint["type"] == "must_include":
                    if constraint["value"] not in response:
                        violations.append(f"Missing: {constraint['value']}")
                elif constraint["type"] == "must_not_include":
                    if constraint["value"] in response:
                        violations.append(f"Contains forbidden: {constraint['value']}")
                elif constraint["type"] == "format_match":
                    if not re.match(constraint["pattern"], response):
                        violations.append(f"Format mismatch: {constraint['pattern']}")

            results.append({
                "scenario": scenario["name"],
                "passed": len(violations) == 0,
                "violations": violations,
                "latency_ms": response.latency_ms
            })

        return results
Run this every 5 minutes. If pass rate drops below 95% across the probe battery, page the on-call.
What the Agentic Frameworks Actually Provide
Let me be blunt: most framework-level monitoring is terrible.
I evaluated 8 frameworks in Q1 2026. The Agentic AI Frameworks: Top 10 Options in 2026 listing is decent for features, but they don't tell you what production monitoring actually looks like in each.
Here's the reality:
LangGraph has the best tracing of any framework I've tested. Their LangSmith observability captures granular step data. But it's opinionated—if your agent pattern doesn't fit their graph abstraction, tracing gets gnarly.
CrewAI barely exposes internals. Getting detailed traces requires forking their agent executor. We did that. It was painful.
AutoGen has decent built-in tracing through their agent runtime, but the data format is JSON-heavy and querying it at scale is slow.
Semantic Kernel from Microsoft integrates with Application Insights if you're in Azure. Outside Azure? Good luck.
The Top 5 Open-Source Agentic AI Frameworks in 2026 list is helpful for evaluating options, but I'd add: pick the framework based on your monitoring requirements, not the other way around. We switched from CrewAI to LangGraph specifically because we needed better trace visibility.
The Agent Deployment Pipeline — Where Monitoring Starts
Most teams set up monitoring after deploying. That's backward.
Your ai agent deployment pipeline tutorial should include monitoring instrumentation from the first commit. Here's what I've found works:
yaml
# .github/workflows/agent-deploy.yml
name: Agent Deployment Pipeline

on:
  push:
    branches: [main]
  pull_request:
    branches: [main]

jobs:
  validate:
    runs-on: ubuntu-latest
    steps:
      - uses: actions/checkout@v4

      - name: Run behavioral test suite
        run: python -m tests.behavioral --probe-count=200

      - name: Check regression traces
        run: |
          python -m tests.trace_regression --baseline=production
          # Fails if latency increased >20% or token usage >15%

      - name: Validate response quality
        run: |
          python -m tests.quality_assessment --threshold=0.85
          # Uses LLM-as-judge against 100 test scenarios

  canary:
    needs: validate
    runs-on: ubuntu-latest
    environment: production
    steps:
      - name: Deploy to canary (5% traffic)
        run: python -m deploy.canary --percentage=5

      - name: Monitor for 15 minutes
        run: |
          python -m monitor.wait_for_stability             --metric=outcome_validity             --threshold=0.95             --timeout=900

      - name: Rollback if stability fails
        if: failure()
        run: python -m deploy.rollback --version=previous
This catches issues before they hit users. We've stopped 14 bad deployments in 2026 alone using this pipeline.
Real Monitoring: What We Actually Track
Forget error rates. Track these instead:
Thought-Execution Ratio — How much time does the agent spend reasoning vs. executing tools? A sudden increase in thinking time usually means context issues or model confusion. Normal range: 0.3-0.6 for most agents. Above 0.8 means something's wrong.
Tool Rejection Rate — How often does the agent call a tool and get no useful result? This is your canary in the coal mine. If it spikes, the agent is probably confused about which tool to use.
Path Diversity — How many different reasoning paths does your agent take for similar inputs? Too much diversity (high variance) means unreliable behavior. Too little (near-deterministic) means you're leaving performance on the table.
Context Window Saturation — How full is the context window? Over 80% consistently and your agent starts getting confused. We've seen it. It's real.
Decision Reversals — How often does the agent change its mind mid-session? Changing tool selection 3+ times for a simple query is a red flag.
The Protocol Problem
Here's something nobody talks about: ai agent observability production is broken because there's no standard.
Your agent might use AI Agent Protocols: 10 Modern Standards Shaping the ... for inter-agent communication. But the telemetry format? Everyone makes it up.
A Survey of AI Agent Protocols shows this problem clearly: 23 different telemetry protocols, none dominant. We've standardized on OpenTelemetry with custom extensions. It's not perfect, but it's better than the alternative of writing N exporters for N tools.
The real cost is debugging cross-agent failures. When Agent A calls Agent B, and the result is wrong, whose fault is it? Without standard trace propagation, you're guessing. We spent three weeks building a custom trace context propagator. Worth every hour.
What I'd Build If Starting Today
If I were building from scratch right now (July 2026), here's my stack:
-
OpenTelemetry for infrastructure telemetry. Free, standard, works everywhere.
-
Custom ClickHouse for trace storage. Postgres works for 10K traces/day. At 1M+, you need columnar storage.
-
Behavioral probes running every 5 minutes. Homegrown, using your domain-specific constraints. No off-the-shelf tool does this well.
-
LLM-based semantic monitoring — a secondary model that runs every hour on a sample of agent outputs, checking for semantic drift, tone changes, factual consistency. We use GPT-4o for this. Costs about $50/month for 10K agents.
-
Dashboard with three views: operations (for SRE), quality (for product), business (for execs). Different audiences need different data.
Don't buy an "AI agent monitoring platform." They're all immature. Build the core yourself, buy only the stuff that's commoditized (like infrastructure monitoring).
The Contrarian Take: Less Monitoring, More Testing
Everyone reading this probably thinks they need more monitoring.
I think you need less. But better.
Here's why: every metric you add is noise you'll learn to ignore. We had 87 dashboard widgets at one point. Nobody looked at them. The signal-to-noise ratio was garbage.
What actually works: five alerts. That's it.
- Outcome validity drops below 95% (measured by probes)
- Tool rejection rate spikes above 20%
- Context window saturation exceeds 85%
- Cost per action doubles (indicates inefficient agent behavior)
- Any agent session exceeds 60 seconds (indicates infinite loops or stuck reasoning)
That's it. Everything else is something you look at post-incident, not something that pages you.
The A Survey of AI Agent Protocols paper I mentioned earlier makes this point obliquely: more telemetry doesn't mean better observability. It means more data you're not using.
FAQ
Q: What's the minimum I need to monitor in production?
A: Five things: token usage (cost), latency (performance), tool call success rate (reliability), outcome validity (correctness), and context window saturation (health). Start there. Add nothing else for two weeks.
Q: Can I use Datadog/New Relic for agent monitoring?
A: For infrastructure metrics, yes. For agent-specific observability, no. They don't understand reasoning traces, context windows, or outcome validation. You'll need custom instrumentation.
Q: How often should behavioral probes run?
A: Every 5 minutes minimum for production agents. Every 1 minute for high-traffic agents. The probes themselves should be lightweight—we run 50 probes in under 500ms.
Q: What's the best framework for traceability?
A: LangGraph with LangSmith. Not perfect, but significantly better than alternatives. The step-by-step trace capture is granular enough to reconstruct reasoning paths.
Q: How do you monitor multi-agent systems?
A: Trace context propagation. Every agent call must carry a trace parent ID. Without it, you can't attribute failures to the right agent. We use W3C trace context headers with custom extensions.
Q: Should you monitor agent reasoning quality or just outcomes?
A: Both. Outcomes tell you something broke. Reasoning tells you why. Monitoring only outcomes means you fix symptoms; monitoring reasoning means you fix root causes.
Q: How do you handle monitoring cost for LLM-as-judge evaluations?
A: Sample. We evaluate 5% of agent runs with the judge model. It captures 90% of issues. Evaluating 100% would cost 20x more for marginal improvement.
Q: What's the most common monitoring mistake you see?
A: Setting alerts based on averages. Agents have long-tail behavior. The average outcome might be fine while 5% of users get garbage responses. Alert on percentiles (p95, p99), not averages.
The Bottom Line
Here's what I've learned from running production agent systems for 18 months:
Your agent ai agent production monitoring tools will never be perfect. They'll miss things. They'll false alarm. Accept that.
What matters isn't catching everything—it's catching the right things fast enough to limit damage. Five well-chosen alerts beat fifty dashboard widgets. Behavioral probes beat log analysis. Outcome validation beats error counting.
The frameworks are improving. The Agentic AI Frameworks: Top 10 Options in 2026 list has better observability options than the 2025 list. But none of them are turnkey. You still need to do the hard work of defining what "correct" means for your domain and building the validation infrastructure to measure it.
That's the real meta-lesson: there are no shortcuts in production AI. The monitoring tools you need don't fully exist yet. Build them. Share what you learn. That's how we all get better.
Nishaant Dixit — Founder of SIVARO. Building data infrastructure and production AI systems since 2018. Built systems processing 200K events/sec.