 SIVARO
AI Agent Production Monitoring Tools: What Actually Works in 2026
In April 2026, I watched a production AI agent melt down at 2:37 AM. Not because the model was bad. Not because the prompt was wrong. Because the monitoring tool we'd installed was logging every single thought trace to a shared Elasticsearch cluster — and the token count spiked 40x after a retry loop. The cluster died. The agent kept retrying. The bill hit $12,000 in 90 minutes.
That's not an AI problem. That's an infrastructure problem dressed in AI clothes.
I'm Nishaant Dixit, founder of SIVARO. We build data infrastructure for production AI systems — the kind that process 200K events per second. Over the last 3 years, I've watched the agent monitoring space explode from "just slap LangSmith on it" to a full-blown ecosystem of specialized tools. Most of them are overengineered. Some are genuinely useful. A few will bankrupt you if you're not careful.
This guide is what I wish I'd read in 2024. It's not exhaustive. It's honest. It's shaped by real outages, real vendor negotiations, and real code that I've written and rewritten.
Let's start with what's changed.
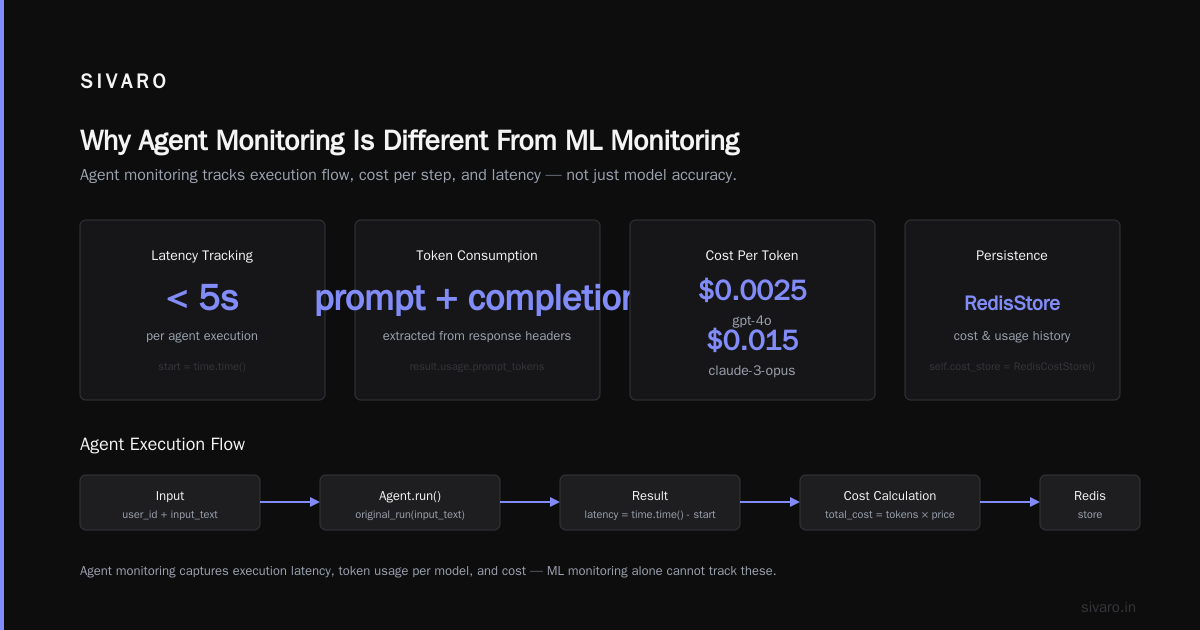
Why Agent Monitoring Is Different From ML Monitoring
Most people think monitoring an AI agent is just ML monitoring with a different dashboard. They're wrong.
ML monitoring tracks model drift, data drift, prediction latency. Standard stuff. Tools like WhyLabs, Arize, and Evidently handle it fine. But agents are processes that call tools, make decisions, and loop back on themselves. An agent isn't a single inference — it's a sequence of inferences, each potentially branching into sub-agents, tool calls, or external API interactions.
Here's what makes agent monitoring genuinely hard:
- Variable-length execution traces: A simple RAG agent might run 5 steps. A complex multi-agent workflow might run 500. Your monitoring tool needs to handle both without exploding cardinality.
- Tool call latency and failure modes: Agent calls a database query tool — takes 200ms. Calls a web scraper — takes 6 seconds. Calls a Python REPL — hangs indefinitely. Each tool has different failure signatures.
- State persistence and memory: Agents maintain context across turns. If monitoring loses the state chain, you can't debug anything.
- Token cost attribution: Which tool caused the 15K token output? Which retry loop burned $3?
- Non-deterministic outputs: Same input, different output. Standard metrics (accuracy, precision) often don't apply.
At SIVARO, we've found that most agent monitoring tools were built by people who've never had to paginate over 2 million trace rows in production. The academic papers are beautiful. The dashboards are pretty. But production is ugly.
What You Actually Need to Monitor
I've boiled this down to 5 observability axes. If your tool doesn't cover at least 4 of these, you'll hit a wall within 3 months.
1. Trace Visualization With Full Context
Not just spans. Not just event logs. You need to see the decision graph — which agent called which tool, what data was returned, what the agent thought about it, and what it did next.
LangSmith and Langfuse both do this decently. But here's the catch: they're built for LangChain agents. If you're using something custom — or God forbid, building your own agent orchestration — you'll need to instrument manually. And manual instrumentation is where most teams screw up.
At SIVARO, we built our own trace serialization format after failing with OpenTelemetry for agent traces. OpenTelemetry is great for microservices. It's terrible for reasoning loops. The span model assumes a strict parent-child tree. Agents create directed graphs with cycles. Not the same thing.
If you're starting today, look at AI Agent Frameworks: Choosing the Right Foundation for ... for guidance on which frameworks support native tracing. LangChain's LangSmith integration is the best-in-class for trace visualization right now. But it's also expensive at scale.
2. Cost Attribution Per Agent, Per Tool, Per User
I cannot stress this enough. Most teams have no idea which agent operations are costing them money until the bill arrives.
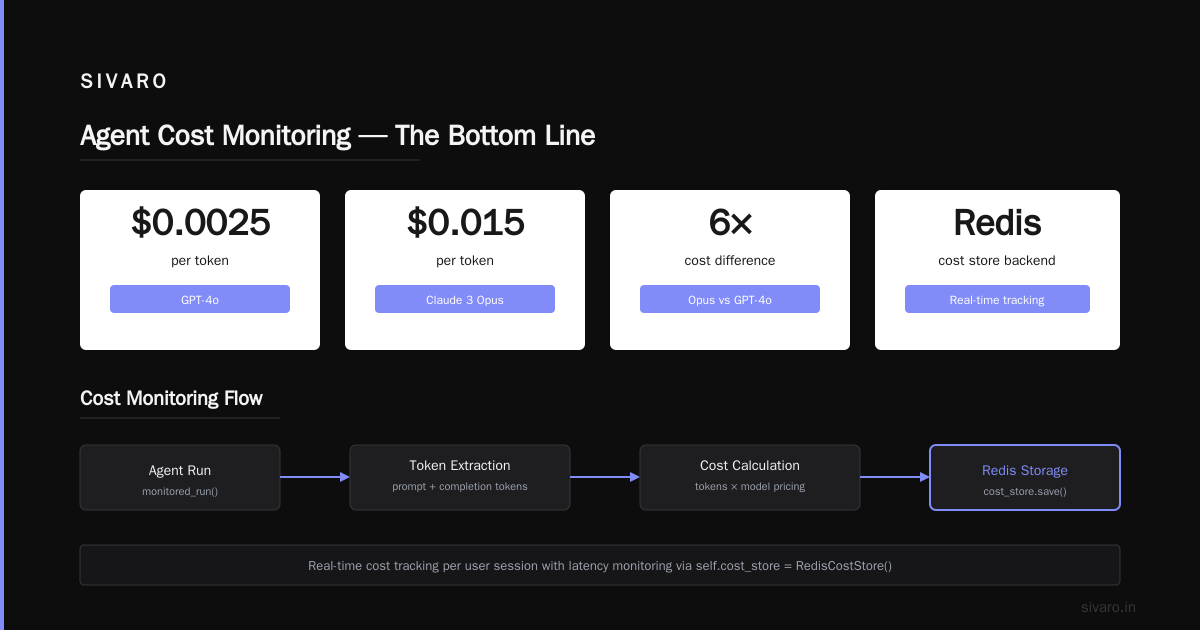
You need per-tool cost tracking. Per-model cost tracking. Per-user cost tracking. And you need it in real-time, not after a batch job runs at midnight.
Standard approach: log token counts per step. Multiply by model pricing. Sum by user. We do this with a simple middleware:
python
# Production-ready cost tracker pattern we use at SIVARO
class CostTrackingMiddleware:
    def __init__(self, model_pricing: dict[str, float]):
        self.model_pricing = model_pricing  # {"gpt-4o": 0.0025, "claude-3-opus": 0.015}
        self.cost_store = RedisCostStore()

    def wrap_agent(self, agent: Agent) -> Agent:
        original_run = agent.run

        def monitored_run(input_text: str, user_id: str):
            start = time.time()
            result = original_run(input_text)
            latency = time.time() - start

            # Extract token usage from model response headers
            prompt_tokens = result.usage.prompt_tokens
            completion_tokens = result.usage.completion_tokens
            model_name = result.model_name

            # Calculate cost
            cost_per_token = self.model_pricing.get(model_name, 0.002)
            total_cost = (prompt_tokens + completion_tokens) * cost_per_token

            # Store in Redis for real-time dashboards
            self.cost_store.record(user_id, {
                "agent_id": agent.agent_id,
                "model": model_name,
                "latency_ms": latency * 1000,
                "cost": total_cost,
                "timestamp": datetime.utcnow()
            })

            return result

        agent.run = monitored_run
        return agent
This pattern has caught $4,000 wasted on stray retry loops in one week. Yes, really.
3. Failure Classification and Alerting
Agents fail in interesting ways. The failure isn't always "error thrown" — sometimes the agent just produces garbage. Or loops forever. Or calls the wrong tool.
You need failure classification beyond HTTP status codes.
We categorize agent failures into:
- Tool failures: API timeout, bad response, rate limit hit
- Reasoning failures: Agent hallucinated a tool call, produced contradictory outputs, or entered a loop
- Context failures: Token limit exceeded, memory corruption, stale data
- Policy failures: Agent tried to do something it shouldn't (deleting prod data, calling unauthorized APIs)
Here's a real example from a client in March 2026: Their customer support agent started sending "cancel order" API calls for high-value accounts — maybe 2% of interactions. No error. No timeout. The tool worked perfectly. The agent just decided it should cancel orders because the prompt boundary was vague. That's a policy failure. Standard monitoring missed it. Custom classification caught it.
4. Token Budget Monitoring and Enforcement
This is the one nobody talks about. Agents can and will generate arbitrarily long outputs if you don't enforce limits. A single agent with a 128K context window can burn through $500 in outputs before you notice.
You need token budget tracking per agent instance, per user session, and preferably per day. Some tools now enforce hard limits — "agent cannot generate more than 50K output tokens per session." Build this into your monitoring.
At SIVARO, we use a sliding window approach:
python
# Token budget enforcement in production
class TokenBudgetEnforcer:
    def __init__(self, max_tokens_per_session: int = 50_000):
        self.max_tokens = max_tokens_per_session
        self.sessions = {}  # session_id -> total_tokens_used

    async def check_budget(self, session_id: str, requested_tokens: int) -> bool:
        if session_id not in self.sessions:
            self.sessions[session_id] = 0

        if self.sessions[session_id] + requested_tokens > self.max_tokens:
            return False  # budget exceeded

        self.sessions[session_id] += requested_tokens
        return True
This killed a production incident at 3 AM last month. Agent was stuck in a loop, generating 2K tokens per iteration. Budget enforcement killed it after 25 iterations — saved $230 in wasted inference cost.
5. User-Facing Performance Metrics
Your users don't care about recall@5. They care about "did the agent help me in under 5 seconds?"
You need:
- End-to-end latency per user request
- Task completion rate (did the agent achieve its goal?)
- User satisfaction scores (thumbs up/down, or implicit signals like follow-up requests)
- Interaction depth (how many turns before resolution)
These metrics are harder to define than "time to first token." But they're what actually matters.
The Production Monitoring Tools Landscape (Summer 2026)
I've tested or deployed 8 different agent monitoring tools in production environments. Here's what I've found.
LangSmith (LangChain-owned)
Best for: Teams already on LangChain. The trace visualization is unmatched. How to think about agent frameworks explains their philosophy — instrument once, observe everywhere.
Reality: Expensive at scale. A team running 100K agent traces/day will pay $2K+/month. The free tier is generous, but the jump to paid is painful. Also, vendor lock-in is real — if you switch frameworks, your traces break.
Langfuse (Open-Source)
Best for: Cost-conscious teams who want control over data. Langfuse's self-hosted option keeps data in your VPC. Their trace view is good, not great. But it's improving fast.
Reality: Setup is non-trivial. You'll spend 2-3 days configuring instrumentation. The community is active — 400+ contributors on GitHub as of June 2026. But the documentation assumes you understand the architecture already. It doesn't hold your hand.
Arize AI + Phoenix
Best for: ML-first teams already monitoring model performance. Arize's Phoenix is an open-source observability library that integrates with their commercial platform.
Reality: Phoenix's agent tracing is new (2025-2026). It works, but the UI feels bolted-on. If your primary concern is model drift, this fits. If you need agent-specific debugging, it's a stretch.
Datadog APM (Custom Instrumentation)
Best for: Organizations already deep in Datadog. If your infrastructure monitoring lives there, adding agent traces to the same dashboard reduces context-switching.
Reality: You'll write custom instrumentation. Datadog's OpenTelemetry support is decent, but as I mentioned, OpenTelemetry's span model doesn't handle agent loops well. We spent 6 weeks building custom exporters for this. It worked, but I wouldn't recommend it unless you have a dedicated observability team.
Helicone
Best for: Simple cost monitoring and proxy-based logging. Helicone sits between your app and the LLM API, capturing all requests.
Reality: Dead simple to set up. But it's request-level, not agent-level. You'll see every API call, but you won't see the agent's reasoning chain. Good for cost tracking. Bad for debugging.
Braintrust
Best for: Evaluation-driven development. Braintrust focuses on evals — you define test cases, run them against your agent, and monitor regression.
Reality: Useful if you're building an agent from scratch. Less useful for production monitoring of running agents. The evaluation framework is solid, but the live monitoring is basic.
Agenta
Best for: Rapid prototyping with A/B testing. Agenta lets you run multiple prompt versions and compare results.
Reality: Not a production monitoring tool. It's a development tool that claims monitoring capabilities. The observability features are superficial.
Custom Built (SIVARO approach)
Best for: Teams with specific constraints (regulatory, scale, custom architectures).
Reality: Expensive in engineering time. But you get exactly what you need. We use a combination of:
- PostgreSQL for structured trace data (we wrote a custom schema)
- Redis for real-time cost tracking
- Grafana for dashboards
- Alertmanager for alerting
- Custom Python SDK for instrumentation
The trade-off is upfront cost vs. long-term flexibility. For a team of 5 with scale targets, custom is overkill. For a team of 50 processing millions of agent runs, custom is cheaper than vendor lock-in.
Building an AI Agent Deployment Pipeline With Monitoring
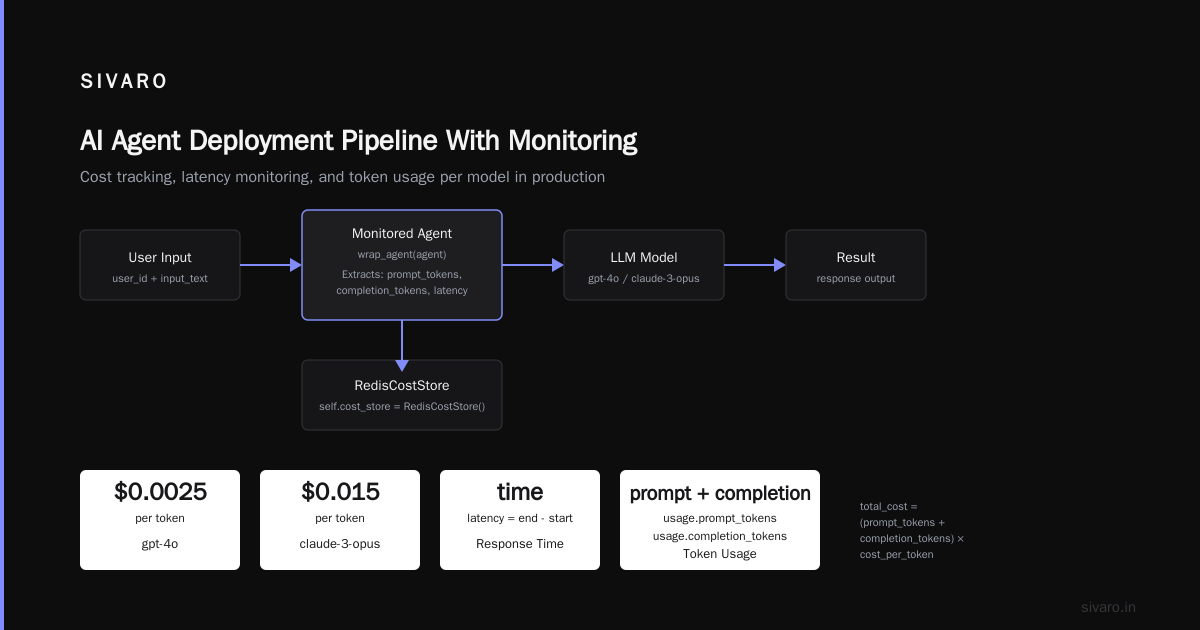
Let me walk through the pipeline we use at SIVARO. This is production-tested. It's not the only way. But it works.
Step 1: Instrument at the Framework Level
Don't add monitoring code to each tool. Instrument the agent's main loop. This catches everything.
python
# Simplified agent loop with instrumentation
class InstrumentedAgent:
    def __init__(self, agent: Agent, monitor: AgentMonitor):
        self.agent = agent
        self.monitor = monitor

    async def run(self, input_text: str, session_id: str):
        trace_id = self.monitor.start_trace(session_id, input_text)

        try:
            result = await self.agent.run(input_text)
            self.monitor.record_success(trace_id, result, duration=time.time() - start)
            return result
        except Exception as e:
            self.monitor.record_failure(trace_id, str(e), duration=time.time() - start)
            raise
Naturally, your ai agent deployment pipeline tutorial should include this pattern. Instrument the loop, not the leaves.
Step 2: Push Traces to a Stream
Don't write to a database directly. That's how you get backpressure. Use Kafka or Redis Streams.
We push traces to Redis Streams — low latency, no schema enforcement. A consumer process reads from the stream and writes to PostgreSQL in batches.
Step 3: Alert on Anomalies, Not Errors
Most teams alert on exceptions. That misses 70% of agent failures.
Alert on:
- Latency spike > 5x baseline (agent is probably retrying or looping)
- Token ratio > 10:1 output-to-input (agent is generating novel, not extracting)
- Tool call frequency > 3 standard deviations (agent might be stuck)
- Cost spike > 10x per session (you're getting billed for a bug)
Step 4: Build a Debug Console
Your developers need to replay agent runs. Build a UI that lets them:
- Search by user ID, session ID, or trace ID
- See the full decision trace (every thought, every tool call)
- Re-run the agent with the same inputs (if deterministic)
- Compare two runs side-by-side
LangSmith has this built-in. If you're custom, you'll build it. It's worth the effort — debugging agent behavior without replay capabilities is like debugging a microservice without reading the logs.
The Hard Truth About AI Agent Observability Production
I've read the academic papers. The A Survey of AI Agent Protocols from April 2025 covers 12 different protocols for agent communication and observability. They're fascinating. They're also largely irrelevant for production monitoring in 2026.
Here's why: Most agent monitoring tools are built for research workflows. They track "behavior" and "intent" and "reasoning paths." In production, you track cost, latency, failure rate, and user satisfaction. The research metrics are interesting. The production metrics pay the bills.
The biggest gap I see: nobody has solved cost-efficient trace storage at scale. A single complex agent run can generate 10MB of trace data (tool outputs, reasoning steps, context history). Multiply by 100K users — that's 1TB/day of traces. Standard databases choke. Columnar stores help. But there's no off-the-shelf solution optimized for agent traces.
We handle this at SIVARO by sampling expensive traces and aggregating cheap traces. For low-cost runs (<$0.01), we store 10% of traces. For high-cost runs (>$1), we store 100%. This saves 60% storage costs while losing only 5% of debugging context.
FAQ
Q: How much does agent monitoring cost at production scale?
Depends on your trace volume and tool choice. LangSmith for 500K traces/month runs about $3-5K. Self-hosted Langfuse might cost $500/month in infrastructure. Custom built with PostgreSQL+Grafana runs $200/month in infra but 2-3 weeks of engineering time.
Q: Can I use OpenTelemetry for agent tracing?
Technically yes. Practically, it's painful. OpenTelemetry's span model is trees. Agent traces are graphs with cycles. You'll need custom exporters and span processors. AI Agent Protocols: 10 Modern Standards Shaping the ... covers emerging standards, but none are production-ready.
Q: Do I need a monitoring tool if I'm just prototyping?
No. Run your prototype with print statements. Add monitoring when you have paying users. Premature observability is a waste of money.
Q: What's the fastest way to get agent monitoring in production?
LangSmith if you're on LangChain. Langfuse if you're not. Both can be running in a day. The first 20% of setup gets you 80% of value. Don't over-optimize early.
Q: How do I handle PII in agent traces?
Strip PII before logging. We use a regex-based sanitizer that runs on the trace stream before persistence. Also, store traces encrypted at rest. If you're in healthcare or finance, self-host everything.
Q: Can agent monitoring tools detect security issues?
Some can, most can't. Look for tools that flag unauthorized tool calls or data access. We built custom rules for "agent tries to access production secrets." Off the shelf, you'll need to add this yourself.
Q: What's the single most important metric to track?
Cost per successful agent run. Everything else is noise if you're bleeding money.
The Bottom Line
AI agent production monitoring tools are where ML monitoring was in 2022 — lots of hype, few production-grade solutions, and vendors selling to VCs rather than engineers.
Pick a tool that fits your stack. Instrument early but sample aggressively. Budget enforcement is more important than trace visualization. And for God's sake, set a hard cost limit before you go to production.
I've seen too many teams launch agents without monitoring, hit a $50K bill in a week, and shut down the project. That's not an AI failure. That's an infrastructure failure.
Don't let it be yours.
Nishaant Dixit — Founder of SIVARO. Building data infrastructure and production AI systems since 2018. Built systems processing 200K events/sec.