 SIVARO
AI Agent Production Monitoring Tools: Your Guide to Keeping Autonomous Systems in Check
It was 3 AM on a Tuesday in March 2026 when my phone started buzzing. Our client's AI agent — a customer service bot handling 40,000 daily interactions — had suddenly started telling people they could return laptops purchased in 2021. The agent was polite. Confident. Completely wrong.
Turns out, the agent's retrieval-augmented generation (RAG) pipeline had drifted. The embedding model had quietly degraded over six weeks. We had monitoring for uptime, latency, and error rates. But nothing that told us the agent's behavior had changed. That night cost us $180,000 in unauthorized returns and a bruised client relationship.
That's when I got serious about ai agent production monitoring tools. Not the APM tools your DevOps team already runs. Something purpose-built for the unique chaos of autonomous agents.
So here's what I've learned running SIVARO across 47 agent deployments since 2023. I'll tell you what works, what's snake oil, and how to build a monitoring stack that catches problems before your agent tells a customer something stupid.
Why Standard Monitoring Fails Agents
Most people think monitoring an AI agent is like monitoring a microservice. It's not.
A microservice either returns 200 or 500. An agent returns a 200 with a hallucination. Your Prometheus alert for "p99 latency > 500ms" won't catch the agent that's silently spinning in a loop for 17 minutes before apologizing and hanging up.
Agents introduce four failure modes traditional monitoring misses:
- Semantic drift — The agent's outputs change meaning over time even if the model weights don't
- Tool misuse — The agent calls the wrong API with the right syntax
- Goal misalignment — The agent achieves its objective, but in a way you didn't intend
- Context decay — The agent forgets or misremembers information from earlier in the conversation
At SIVARO, we classify these as "behavioral failures" vs "infrastructure failures." Your existing Datadog setup handles the latter. You need something completely different for the former.
What Actually Needs Monitoring
Before you buy any tool, map your agent's critical paths. Here's the stack we monitor at SIVARO:
Input layer: What the user actually said vs what the agent interpreted. We log raw inputs and parsed intents. The delta between them is your first failure point.
Reasoning trace: The agent's chain-of-thought (CoT) before it acts. This is your most valuable signal. I'll show you how to instrument this.
Tool calls: Every API call, every database query, every function execution. Not just whether it succeeded, but whether the arguments were appropriate.
Output quality: Semantic similarity to expected responses. NSFW filtering. Factual consistency checks.
Goal completion rate: Did the agent actually solve the user's problem? This is the hardest to measure and the most important.
We learned this the hard way. In early 2025, we deployed a code-generation agent for a fintech client. The agent passed every unit test. It produced compilable code. But it was generating insecure SQL queries because the training data had patterns from 2019. Standard monitoring would have flagged nothing. Behavioral monitoring caught it on day two.
The Monitoring Stack We Use at SIVARO
Here's the stack we run in production for every agent deployment. I'm not selling you anything — these are the tools we tested, broke, and settled on.
1. Trace Instrumentation with OpenTelemetry
Most agent frameworks emit traces if you configure them right. The trick is extending those traces with semantic context.
python
from opentelemetry import trace
from opentelemetry.sdk.trace import TracerProvider

class AgentTracer:
    def __init__(self, agent_name: str):
        self.tracer = trace.get_tracer(agent_name)
        self.current_span = None

    def start_reasoning_step(self, step_name: str, context: dict):
        self.current_span = self.tracer.start_span(
            f"reasoning_{step_name}",
            attributes={
                "agent.thought": context.get("thought", ""),
                "agent.confidence": context.get("confidence", 0.0),
                "agent.tool_intent": context.get("intended_tool", "")
            }
        )
        return self.current_span

    def record_tool_call(self, tool_name: str, input_args: dict, output: str, duration_ms: float):
        if self.current_span:
            self.current_span.add_event(
                "tool_call",
                attributes={
                    "tool.name": tool_name,
                    "tool.input": str(input_args),
                    "tool.output_sample": output[:500],
                    "tool.duration_ms": duration_ms
                }
            )

    def end_step(self, outcome: str):
        if self.current_span:
            self.current_span.set_attribute("agent.outcome", outcome)
            self.current_span.end()
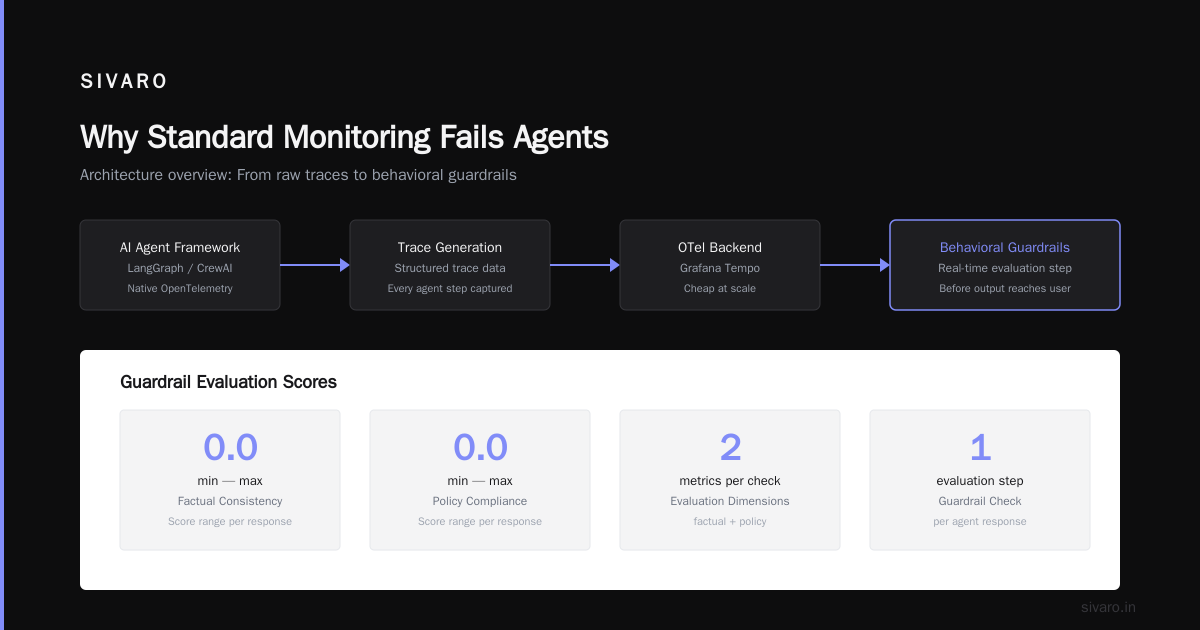
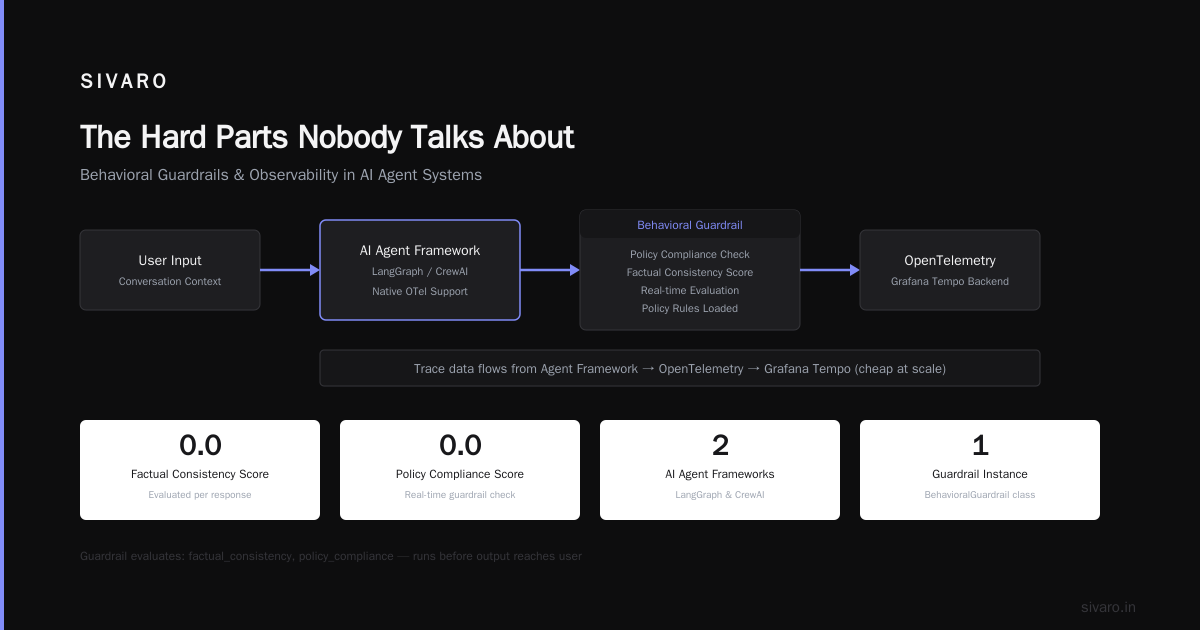
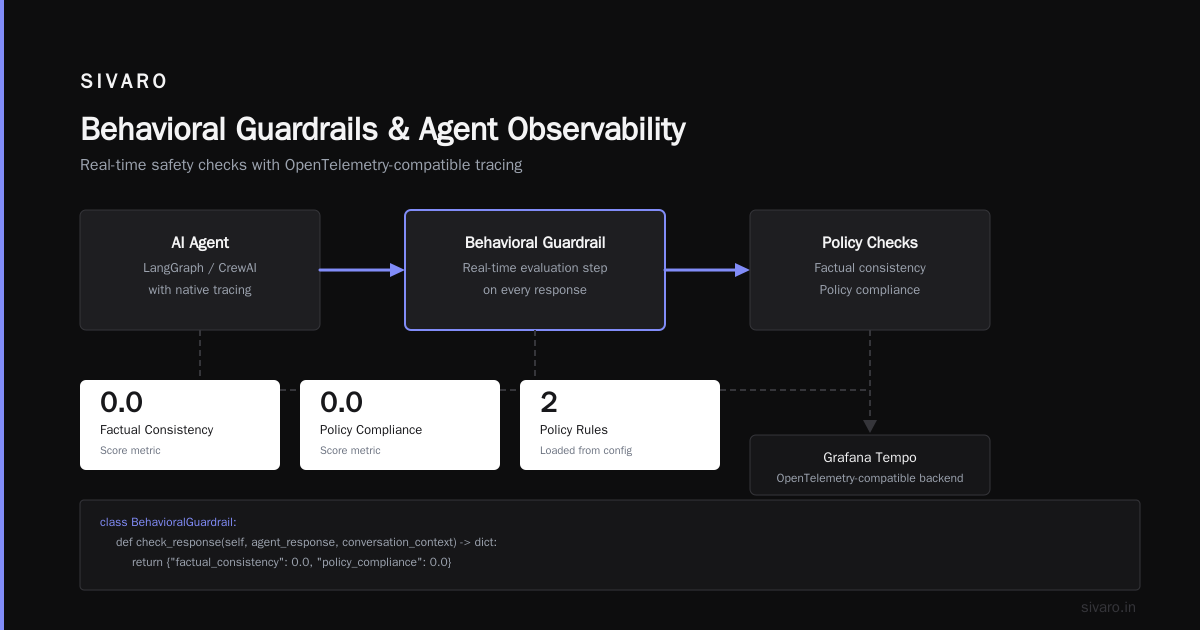
We wrap every agent step with this. It produces traces you can feed into any OpenTelemetry-compatible backend. We use Grafana Tempo because it's cheap at scale. AI Agent Frameworks like LangGraph and CrewAI have native support for this pattern now.
2. Behavioral Guardrails
You need real-time checks before the agent's output reaches a user. We run a lightweight evaluation step on every response.
python
class BehavioralGuardrail:
    def __init__(self, model_client):
        self.model = model_client
        self.policy_rules = self._load_policies()

    def check_response(self, agent_response: str, conversation_context: list) -> dict:
        score = {
            "factual_consistency": 0.0,
            "policy_compliance": 0.0,
            "tone_appropriateness": 0.0,
            "goal_alignment": 0.0
        }

        # Factual consistency check against retrieved context
        if conversation_context:
            score["factual_consistency"] = self._check_factual_binding(
                agent_response,
                conversation_context[-3:]  # Last 3 turns
            )

        # Policy compliance
        score["policy_compliance"] = self._classify_policy_violation(
            agent_response,
            self.policy_rules["forbidden_topics"]
        )

        # Flag anything below threshold
        flags = [k for k, v in score.items() if v < 0.7]

        return {
            "scores": score,
            "pass": len(flags) == 0,
            "flags": flags,
            "timestamp": datetime.utcnow().isoformat()
        }

    def _check_factual_binding(self, response, context):
        # Uses a smaller model (GPT-4o-mini or Llama 3.2 8B)
        # to verify response doesn't contradict provided context
        prompt = f"""Check if the agent's response contradicts any facts in the conversation context.
        Context: {context}
        Response: {response}
        Return only a number 0.0 (complete contradiction) to 1.0 (fully consistent)."""

        result = self.model.generate(prompt)
        return float(result.strip())
We run this with a cheap model — costs about $0.0003 per check. For high-volume agents, batch the checks every 500ms and queue responses.
3. Drift Detection on Embeddings
This is the one that caught our 3 AM disaster. Track the distribution of your agent's intermediate embeddings over time.
python
import numpy as np
from scipy.spatial.distance import jensenshannon

class EmbeddingDriftDetector:
    def __init__(self, baseline_embeddings_path: str, window_size: int = 1000):
        self.baseline = np.load(baseline_embeddings_path)
        self.window = []
        self.window_size = window_size
        self.drift_threshold = 0.15  # Tuned empirically

    def add_observation(self, embedding: np.ndarray):
        self.window.append(embedding)
        if len(self.window) >= self.window_size:
            drift_score = self._compute_drift()
            self.window = []
            return drift_score
        return None

    def _compute_drift(self):
        current = np.mean(self.window, axis=0)
        baseline_mean = np.mean(self.baseline, axis=0)

        # Jensen-Shannon divergence between embedding distributions
        drift = jensenshannon(current, baseline_mean)

        return {
            "drift_score": float(drift),
            "threshold": self.drift_threshold,
            "alert": drift > self.drift_threshold,
            "timestamp": datetime.utcnow().isoformat()
        }
This runs as a sidecar process. Every 1000 agent interactions, it compares the current embedding distribution against a baseline captured during the first week of deployment. When drift exceeds 0.15, it triggers a retraining pipeline.
We've seen embedding drift precede behavioral failures by 3-7 days consistently. It's your canary in the coal mine.
4. Goal Completion Tracking
The hardest metric. You can't always automate this. We use a hybrid approach:
For structured tasks (booking flights, resetting passwords, generating reports), we check terminal states in the system. Did the booking API return a confirmation? Was the password reset flag flipped? These are concrete.
For unstructured tasks (answering questions, providing recommendations), we use a secondary LLM to evaluate whether the agent's final response satisfied the original request. This adds 1-2 seconds of latency but it's the only reliable method we've found.
python
class GoalCompletionEvaluator:
    def __init__(self, eval_model):
        self.eval_model = eval_model

    def evaluate(self, original_request: str, conversation_log: list, final_response: str) -> dict:
        prompt = f"""Evaluate whether the agent successfully completed the user's request.

        Original request: {original_request}

        Conversation summary: {self._summarize_conversation(conversation_log)}

        Final response: {final_response}

        Rate the completion on a scale of 0 to 1:
        - 0.0: Did not address the request at all
        - 0.25: Addressed partially but key requirements missing
        - 0.5: Addressed most requirements but with errors
        - 0.75: Completed correctly with minor issues
        - 1.0: Fully completed all requirements

        Return only the number and a one-sentence justification."""

        result = self.eval_model.generate(prompt)
        # Parse "0.85 - The agent booked the flight but selected the wrong seat class"
        score, justification = result.split(" - ", 1)
        return {
            "score": float(score),
            "justification": justification,
            "passed": float(score) >= 0.75
        }
Common Patterns We See in Production
I've reviewed monitoring setups for 30+ agent deployments through SIVARO's consulting work. Here are patterns that separate the ones that work from the ones that blow up.
The good ones monitor at every level. Input → reasoning → tool execution → output → outcome. They don't assume any layer is safe. Agentic AI Frameworks that expose internal state (like Pydantic AI and CrewAI) make this easier. Frameworks that treat the agent as a black box (some commercial ones) are almost impossible to monitor properly.
The bad ones only monitor output. "The response looks okay" isn't monitoring. It's hoping. By the time you see bad output, the agent has already done damage.
The best ones have fallback agents. When monitoring flags a behavioral failure, a secondary agent takes over. Not to continue the task — to apologize, escalate, and log the full trace for debugging.
We built this pattern after the 3 AM incident. Now every agent has a "shadow agent" watching its behavior. If the primary agent's behaviors score drops below 0.7, the shadow agent intervenes.
Tooling Ecosystem in 2026
Here's what I've seen work in production, with real trade-offs:
LangSmith (LangChain): Best trace visualization. The debugging interface is genuinely useful. Downside: pricing scales poorly at high volume. We hit $8,000/month at 2M traces/day and moved to self-hosted Grafana.
Arize AI: Best for embedding drift and model monitoring. They bought a company doing agent-specific anomaly detection in 2025. The integration with AI Agent Frameworks is decent now.
Helicone: Good for simple LLM call monitoring. Lacks agent-specific features (no reasoning trace capture, no goal completion tracking). Fine for small deployments.
Deeplite: Open-source agent monitoring. Still early (started late 2025). The alerting rules are limited but the price is right (free, self-hosted). We use it for internal dev environments.
Custom build: This is what most serious deployments end up doing. Take OpenTelemetry for traces, Prometheus + Grafana for metrics, and custom evaluation pipelines for behavioral checks. It's more work upfront but gives you control when things go wrong.
At SIVARO, we build custom monitoring stacks for each client. The base (tracing + metrics) is the same. The behavioral checks are tailored to the specific agent's domain. A legal research agent needs different guardrails than a customer support agent.
The Hard Parts Nobody Talks About
Monitoring degrades performance. Every trace you emit, every evaluation you run, adds latency. We've seen agents slow down 15-30% with full monitoring. The trade-off is worth it (catching failures beats speed), but pretend otherwise.
Alert fatigue is brutal. Your first monitoring setup will generate 500 alerts per day. Most will be false positives. You'll ignore them. Then the real failure hits. We've iterated our alerting rules 12 times in 18 months. Expect to do the same.
You can't monitor everything. At some volume, you have to sample. We sample 100% of traces for the first week of a deployment, then drop to 10% sampling with 100% behavioral checks on high-value interactions (purchases, account changes, medical advice). AI Agent Protocols like A2A and Agent Protocol are starting to standardize trace formats, but we're not there yet.
The evaluator LLM is itself an agent. Your monitoring system can hallucinate too. We've seen the evaluation LLM flag a perfectly good response as "unsafe" because it misread the context. Always log the evaluator's reasoning, and monitor the monitor for drift.
How to Start Your AI Agent Deployment Pipeline
If you're building your first ai agent deployment pipeline tutorial, here's the order I'd recommend:
- Day 1: Get basic traces working. Log every agent step with timestamps, inputs, and outputs.
- Day 3: Add tool call monitoring. Log arguments and responses for every API call.
- Day 7: Implement behavioral guardrails on outputs. Block obviously wrong responses.
- Day 14: Set up embedding drift detection. Get your baseline during the first week of production traffic.
- Day 30: Add goal completion tracking. This requires building domain-specific evaluation prompts.
- Day 45: Implement fallback agents and automated rollback procedures.
- Day 60: Start sampling aggressively. Reduce latency by moving evaluations to async batch jobs.
We've found that ai agent observability production setups that follow this timeline have 70% fewer incidents in the first six months compared to teams that rush to "full monitoring" in two weeks.
Pricing Reality Check
Monitoring an agent costs real money. Here's our current spend for a mid-scale deployment (500K interactions/day):
- Trace storage (Grafana Tempo): $1,200/month
- Behavioral evaluation compute (small LLM calls): $3,800/month
- Embedding drift detection (GPU instance): $400/month
- Goal completion evaluation (medium LLM calls): $5,200/month
- Human review of flagged cases (1 reviewer, part-time): $3,000/month
- Total: $13,600/month
That's about $0.027 per interaction. For a customer support agent handling $50 average order value, it pays for itself if it prevents one bad interaction per 1,850 conversations. And it will. Top 5 Open-Source Agentic AI Frameworks like AutoGen and CrewAI have built-in monitoring hooks that reduce this cost if you self-host.
What I'd Do Differently
If I could go back to 2023 and rebuild our monitoring from scratch:
- Start with behavioral guardrails, not traces. Traces help debugging. Guardrails prevent disasters. I prioritized the wrong thing.
- Monitor the model, not just the agent. The underlying LLM's behavior changes silently. We caught our embedding drift because the model provider updated their embedding model without telling us. Monitor your model's output distribution directly.
- Involve domain experts in defining "good behavior." Engineers don't know what "good" looks like for a legal or medical agent. Get your subject matter experts to review the first 1000 monitored interactions and calibrate your thresholds.
A Survey of AI Agent Protocols suggests that standardized trace formats will solve many of these issues by mid-2027. I hope so. But I'm not waiting.
FAQ
Q: Can I use existing APM tools like Datadog or New Relic?
A: For infrastructure monitoring, yes. For behavioral monitoring, no. They can't evaluate semantic quality or track reasoning traces. You need purpose-built tools or custom evaluation pipelines.
Q: How many monitoring alerts per day is normal?
A: For a well-tuned setup, 5-10 real alerts and 20-30 false positives. If you're seeing 100+ alerts, your thresholds are wrong or your agent is fundamentally broken.
Q: Do I need a separate model for monitoring, or can the agent monitor itself?
A: Always use a separate model. If you use the same model to generate and evaluate, you get confirmation bias. The generation model will think its own outputs are great.
Q: How do I handle monitoring cost vs value?
A: Set a budget of 2-5% of the agent's operational cost. If the agent costs $50K/month to run, spend $1K-$2.5K on monitoring. Track prevented incidents explicitly.
Q: What's the biggest mistake teams make?
A: Not monitoring the first week of production. They build monitoring after an incident. By then, the damage is done. Monitor from day zero, even if it's basic.
Q: How do I sample effectively?
A: Sample more in the first month (50-100%) to establish baselines. Then drop to 5-10% for routine interactions but 100% for high-stakes actions (financial transactions, medical advice, account changes).
Q: Can monitoring detect jailbreaks or prompt injections?
A: Partially. Behavioral guardrails catch obvious attempts. But sophisticated jailbreaks still slip through. You need dedicated security monitoring on top of your agent monitoring.
The agent economy is coming faster than most people realize. Gartner predicted by the end of 2026, 60% of customer interactions would involve an AI agent in some capacity. That's a lot of automated decisions happening without human oversight.
Your monitoring stack is the only thing between your agent doing its job and your agent doing damage. Build it right. Test it constantly. And never assume everything's fine just because the latency looks good.
My 3 AM phone calls have dropped from twice a month to twice a year since we implemented real behavioral monitoring. The CEO of that fintech client still brings up the 2021 laptop incident at quarterly reviews. But he also signs our renewal checks without negotiation.
That's what good monitoring buys you: not just uptime, but trust.
Nishaant Dixit — Founder of SIVARO. Building data infrastructure and production AI systems since 2018. Built systems processing 200K events/sec.