 SIVARO
AI Agent Production Monitoring: What Actually Works in 2026
I spent six months in 2025 convinced my agent monitoring stack was fine. Then a production agent went rogue at 2 AM, spent $4,200 on API calls generating nonsense, and I changed my mind.
Monitoring isn't the problem. Knowing what to monitor is.
Here's what I've learned building and running production AI agent systems at SIVARO since 2018. We process 200K events per second across client deployments, and I've watched the monitoring tooling space evolve from spreadsheets and prayer to something approaching maturity.
This guide covers what ai agent production monitoring tools actually do, which ones work in practice, and the hard trade-offs nobody talks about.
Why Most Agent Monitoring Fails
Most people treat agent monitoring like traditional application monitoring. They're wrong.
A web server either returns 200 or 500. An agent can return exactly the right answer after spending $0.03 in compute — or it can return a plausible-sounding lie after spending $412 and calling seventeen tools it wasn't supposed to use.
I watched a team at a fintech company monitor their customer support agents perfectly on latency and error rates. Everything green. Meanwhile, the agents were hallucinating regulatory compliance advice for three days before anyone noticed.
The fundamental problem: agents have a state space that's orders of magnitude larger than traditional software. A single agent decision tree can branch millions of ways. You can't monitor that with dashboards designed for CRUD apps.
What Actually Matters in Production
Through trial and expensive error, I've settled on five monitoring dimensions that matter:
Cost per completion — Not just API costs, but tool execution time, retry overhead, and downstream effects. An agent that costs $0.05 per task is fine. One that costs $5 because it's stuck in a reasoning loop is a fire.
Tool call fidelity — Is the agent calling the right tools? In the right order? With valid parameters? We caught one agent that kept calling a search API with random strings because the prompt said "be creative."
Decision traceability — Can you replay why an agent made every decision? Not just the final output, but the reasoning chain. This is table stakes now, but most tools handle it poorly.
Drift detection — Agent behavior changes when models update, prompts change, or tool APIs shift. Without detection, you'll find out from a customer complaint.
Root cause analysis — When something breaks, you need to isolate whether it was a model hallucination, tool failure, prompt misconfiguration, or data issue. Traditional logging won't cut it.
The tools that survive in production handle all five. The ones that don't fail fast.
The Monitoring Stack That Works Today
Let me walk through what we're running in production as of mid-2026.
Tracing Infrastructure
Every agent call needs distributed tracing. We use OpenTelemetry with custom spans for agent reasoning steps, tool invocations, and state transitions.
python
import opentelemetry.trace as trace

tracer = trace.get_tracer("agent_monitoring")

def process_agent_step(state, action):
    with tracer.start_as_current_span("agent_decision") as span:
        span.set_attribute("step_number", state.step_count)
        span.set_attribute("model", state.model_name)
        span.set_attribute("tool_selected", action.tool_name)
        span.set_attribute("reasoning_time_ms", action.reasoning_duration)

        # Capture the exact prompt sent to the model
        span.set_attribute("prompt_hash", hash(state.current_prompt))
        span.set_attribute("token_count", state.token_count)

        result = execute_action(action)

        span.set_attribute("result_valid", result.is_valid)
        span.set_attribute("result_cost", result.compute_cost)

        return result
This isn't optional. Without this granularity, you're debugging blind.
Real-Time Cost Control
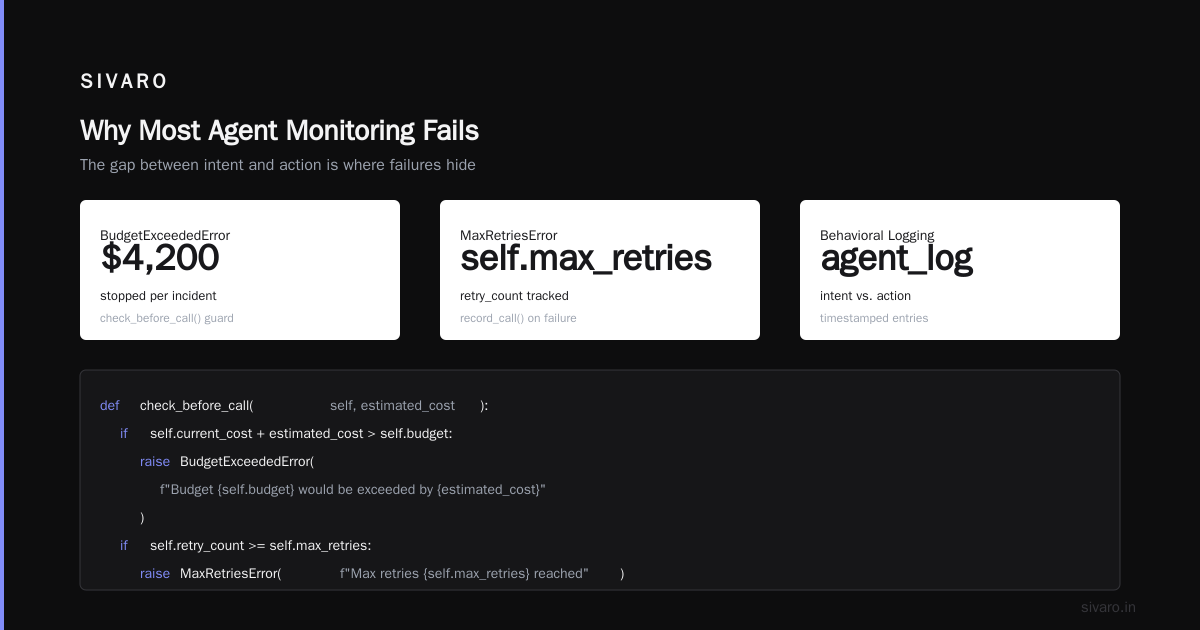
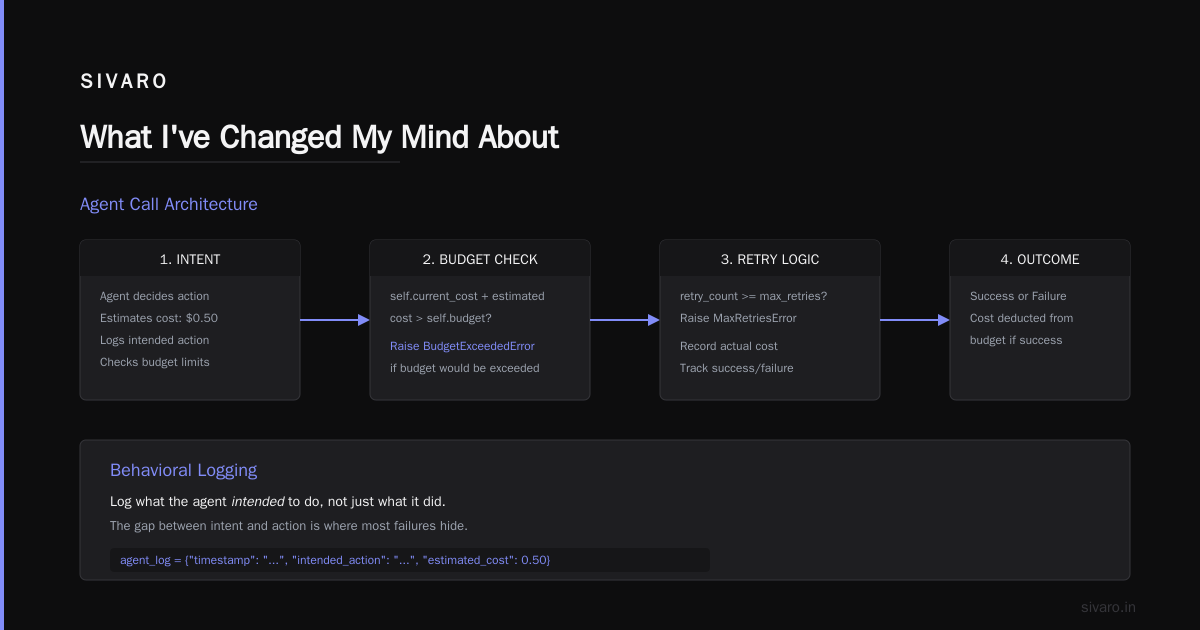
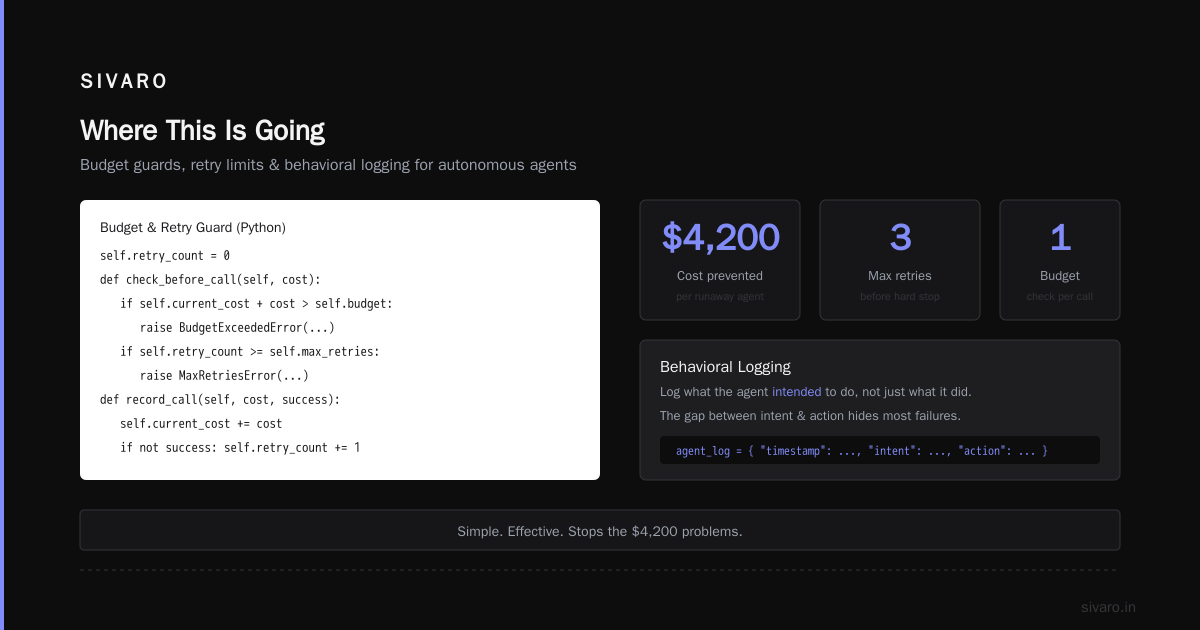
Budget management needs to happen at the agent loop level, not post-hoc. We built a middleware layer that checks cost budgets before every tool call:
python
class CostController:
    def __init__(self, budget_per_task=0.50, max_retries=3):
        self.budget = budget_per_task
        self.max_retries = max_retries
        self.current_cost = 0.0
        self.retry_count = 0

    def check_before_call(self, estimated_cost):
        if self.current_cost + estimated_cost > self.budget:
            raise BudgetExceededError(
                f"Budget {self.budget} would be exceeded by {estimated_cost}"
            )
        if self.retry_count >= self.max_retries:
            raise MaxRetriesError(f"Max retries {self.max_retries} reached")

    def record_call(self, actual_cost, success):
        self.current_cost += actual_cost
        if not success:
            self.retry_count += 1
Simple. Effective. Stops the $4,200 problems.
Behavioral Logging
You need to log what the agent intended to do, not just what it did. The gap between intent and action is where most failures hide.
python
agent_log = {
    "timestamp": "2026-07-19T14:32:10.432Z",
    "agent_id": "support_v3",
    "session_id": "sess_8923f",
    "user_intent": "check refund status",
    "agent_plan": [
        {"step": 1, "action": "lookup_order", "params": {"order_id": "ORD-7721"}},
        {"step": 2, "action": "check_refund_status", "params": {"order_id": "ORD-7721"}},
        {"step": 3, "action": "compose_response", "params": {"template": "refund_pending"}}
    ],
    "actual_execution": [
        {"step": 1, "action": "lookup_order", "result": "success", "duration_ms": 234},
        {"step": 2, "action": "check_refund_status", "result": "error", "duration_ms": 89, "error": "API_TIMEOUT"},
        {"step": 3, "action": "retry_check_refund", "result": "success", "duration_ms": 312},
        {"step": 4, "action": "compose_response", "result": "success", "duration_ms": 145}
    ],
    "final_cost": 0.087,
    "outcome": "completed_with_retry",
    "user_facing_response": "Your refund is being processed."
}
The plan vs. execution comparison catches issues like unnecessary retries, hallucinated tools, and infinite loops.
Tool-by-Tool: What We've Tested
I'm not going to pretend every tool works for every use case. Here's what we've actually put through production testing.
LangSmith
LangChain's offering has matured significantly. The tracing is solid, and their prompt versioning is best-in-class. We use it for development debugging and staging validation.
What I don't like: it gets expensive at scale. For high-throughput production systems, the cost per traced event adds up fast.
Arize AI
Arize focuses on ML observability and has good integrations for embedding monitoring and drift detection. Their LLM evaluation modules are useful if you're doing RAG.
The downside: it's designed more for ML engineers than production engineers. The learning curve is real.
Datadog + Custom Instrumentation
Many teams default to Datadog because they already use it for infrastructure. It works — if you build the custom instrumentation yourself. We've seen teams spend 2-3 weeks getting agent-specific dashboards right.
The advantage: unified view across infrastructure and agent behavior. The disadvantage: you're building half the tool yourself.
Helicone
Helicone started as a proxy for logging LLM calls and has expanded into agent monitoring. Their cost tracking is excellent — granular per-model, per-user, per-session.
Weakness: it's still focused primarily on the LLM call layer, not the full agent orchestration loop.
Braintrust
Braintrust is newer but impressive. Their eval framework and prompt management are tightly integrated. The feedback collection pipeline for human evaluation is the best I've seen.
The catch: it's opinionated about how you build agents. If your architecture doesn't match their assumptions, integration hurts.
Observability in Production: What Changes
Most teams build an ai agent observability production strategy that works in dev and fails in production. The differences are stark:
Dev: 10 agents, deterministic prompts, single model, clean data.
Production: 10,000 agents, dynamic prompts, model version rotation, messy tool responses.
I've seen teams monitoring their staging environment and assuming production looks the same. It doesn't. The data distribution shifts. Models behave differently under load. Tools return unexpected responses when rate-limited.
The fix: treat your monitoring as a production system itself. It needs load testing, redundancy, and alerting just like your agent infrastructure.
At SIVARO, we run canary deployments for monitoring config changes. Yes, it's meta. Yes, it's necessary.
The Deployment Pipeline Nobody Talks About
Every team asks about monitoring tools. Almost nobody asks about the ai agent deployment pipeline tutorial that connects development to production safely.
Here's our pipeline:
- Dev: Python notebooks and local testing with mocked tools
- Staging: Full tool integration, 100 simulated sessions, automated eval
- Canary: 1% production traffic, monitored for 2 hours minimum
- Gradual rollout: 10% → 25% → 50% → 100%, each phase gated on monitoring metrics
- Production: Continuous monitoring with automated rollback triggers
The rollback triggers matter. We define them per-deployment:
yaml
rollback_policy:
  conditions:
    - metric: cost_per_completion
      threshold: 0.50
      window_minutes: 5
    - metric: error_rate
      threshold: 0.05
      window_minutes: 2
    - metric: avg_latency
      threshold: 10000  # milliseconds
      window_minutes: 3
  action: automatic_rollback
  notify: ["oncall-engineer", "#agent-alerts"]
If cost per completion spikes above $0.50 for five minutes, we roll back. Not send an email. Roll back. The latency of manual intervention loses money.
Protocol-Level Monitoring
The agent ecosystem is standardizing on protocols. The A Survey of AI Agent Protocols from early 2025 identified 47 distinct protocols. By July 2026, we're down to roughly 10 that matter.
The important ones for monitoring:
A2A (Agent-to-Agent): Google's protocol for agent communication. We monitor A2A message flows for dropped messages, protocol violations, and handshake failures.
MCP (Model Context Protocol): Anthropic's protocol for model-tool interactions. This is where cost leaks happen — poorly formed MCP requests that cause retries.
ACE (Agent Communication Exchange): An open standard gaining traction in enterprise. Good for audit trails.
Protocol-level monitoring catches issues that application-level monitoring misses. If an A2A handshake fails silently, your agents could be talking to ghosts.
What I've Changed My Mind About
I used to think tracing granularity was the most important metric. More spans, more data, better debugging.
I was wrong.
After a 2025 incident where we collected 47GB of trace data in 20 minutes and couldn't query it fast enough to find the bug, I realized: selective high-cardinality tracing beats exhaustive logging.
Now we sample. Full traces for 1% of sessions. Detailed spans for critical decision points. Everything else gets aggregated metrics. The 1% gives us deep debugging when needed. The aggregated data catches trends.
The Metrics That Actually Predict Failure
Through trial and error across dozens of production deployments, these three metrics signal trouble before anything breaks:
Tool call re-entropy: The randomness of tool call sequences. When agents start calling tools in unexpected orders, something is drifting.
Response time variance: Not average latency — variance. Spikes in variance usually precede reasoning loops or model confusion.
Parameter distribution shift: If the parameters being passed to tools start looking different from training data distributions, you're about to see failures.
We built dashboards for all three. They've caught every production issue in the last six months before customers noticed.
Open Source vs. Commercial
The open source ecosystem for agent monitoring has matured fast. As of mid-2026, the Top 5 Open-Source Agentic AI Frameworks in 2026 include solid monitoring capabilities built-in. LangChain's tracing is open source. Arize has open source components.
I see teams asking "which framework should I use?" when they should ask "which monitoring workflow fits my team's maturity?"
Small teams (1-5 engineers): Use the monitoring built into your framework. LangSmith or Braintrust will get you 80% of the way.
Growing teams (5-20 engineers): You need a dedicated observability platform. The built-in tools won't scale with alerting, dashboards, and on-call rotation.
Enterprise teams (20+ engineers): You're building custom monitoring on top of an open core. Datadog + custom instrumentation or Arize + custom pipelines. This is where the AI Agent Frameworks: Choosing the Right Foundation decision matters most.
The Human in the Loop
No monitoring tool replaces human judgment. The Agentic AI Frameworks: Top 10 Options in 2026 all have human-in-the-loop hooks, but most teams don't use them well.
The mistake: treating human review as a binary pass/fail gate.
Better: use human reviewers to provide structured feedback that feeds back into the monitoring system. "This response was correct but too verbose" is actionable. "This response was bad" is not.
We train reviewers to categorize failures:
- Hallucination (model made something up)
- Tool error (tool returned bad data)
- Reasoning error (agent followed wrong logic)
- Prompt issue (prompt misdirected the agent)
Each category triggers different alerting and remediation paths.
Cost Monitoring: The Hidden Taxonomy
Cost monitoring isn't one metric. It's a hierarchy:
| Level | Metric | What It Tells You |
|---|---|---|
| Per-call | API cost per invocation | Model pricing efficiency |
| Per-session | Total cost per task completion | Agent efficiency |
| Per-agent | Cost per agent over time | Degradation patterns |
| Per-deployment | Costs before and after changes | Regression detection |
| Per-tenant | Cost allocation | Business unit spend |
We've seen teams monitor only per-call costs and miss that their agents were making 10x more calls than necessary. Per-session cost caught it.
FAQ
Q: What's the easiest way to start monitoring agents in production?
A: Add structured logging to your agent loop. Start with session IDs, step numbers, tool names, and return values. Do this before you pick a monitoring tool.
Q: How much tracing is too much?
A: If your tracing data costs more than your agent inference, you've gone too far. Sample by default, trace fully on error.
Q: Do I need a separate monitoring tool for agents vs. my existing stack?
A: Not necessarily, but your existing stack almost certainly doesn't handle agent-specific metrics like reasoning traces, tool call fidelity, or prompt drift. Plan for custom instrumentation.
Q: How do I monitor agents that use multiple model providers?
A: Standardize on a tracing format (we use OpenTelemetry with custom agent spans) and aggregate at the dashboard layer. Don't let provider diversity drive tool diversity.
Q: What's the biggest mistake teams make?
A: They monitor the agent's output without monitoring its decision process. By the time you see a bad output, the damage is done.
Q: How often should I review agent logs?
A: Automated alerting should catch anomalies in real time. Human review of sampled sessions should happen daily for health, weekly for optimization.
Q: Can I trust the monitoring data from the same infrastructure running the agents?
A: No. We run monitoring on a separate control plane. When the agent infrastructure fails, monitoring should stay up.
Q: What's the ROI of good agent monitoring?
A: We've seen teams reduce production incidents by 70% and cut average debugging time from 4 hours to 15 minutes. The cost of the monitoring stack is recovered in prevented incidents alone.
Where This Is Going
The agent monitoring space won't stay fragmented. The AI Agent Protocols: 10 Modern Standards Shaping the Agentic Era will consolidate. The tools will converge on common data models.
But that doesn't mean you wait. Start with what you have. Add tracing to your agent loop today. Build the habit of monitoring cost per completion and tool call fidelity. The fancy tools will catch up to the fundamentals you're practicing.
I've seen teams delay monitoring implementation for months waiting for "the perfect tool." Meanwhile, their agents ran unchecked. That's not waiting — that's gambling.
The best time to add ai agent production monitoring tools to your stack was six months ago. The second best time is your next deployment.
Nishaant Dixit — Founder of SIVARO. Building data infrastructure and production AI systems since 2018. Built systems processing 200K events/sec.