 SIVARO
AI Agent Production Monitoring: What Nobody Tells You About Keeping Agents Alive
I spent six months in 2025 building what I thought was a bulletproof agent system. Three days after deployment, it collapsed in production. Not because the model failed. Not because the infrastructure broke. Because I had no idea what the agent was actually doing between requests.
That's the dirty secret of agent systems right now. Everyone talks about frameworks and pipelines. Nobody talks about the gap between "it works on my laptop" and "it works at 3AM when the database is lagging and the LLM is returning garbage."
Today is July 19, 2026. The agent ecosystem has matured fast. But monitoring? Still the wild west.
Let me show you what we've learned building production agent systems at SIVARO. The hard way.
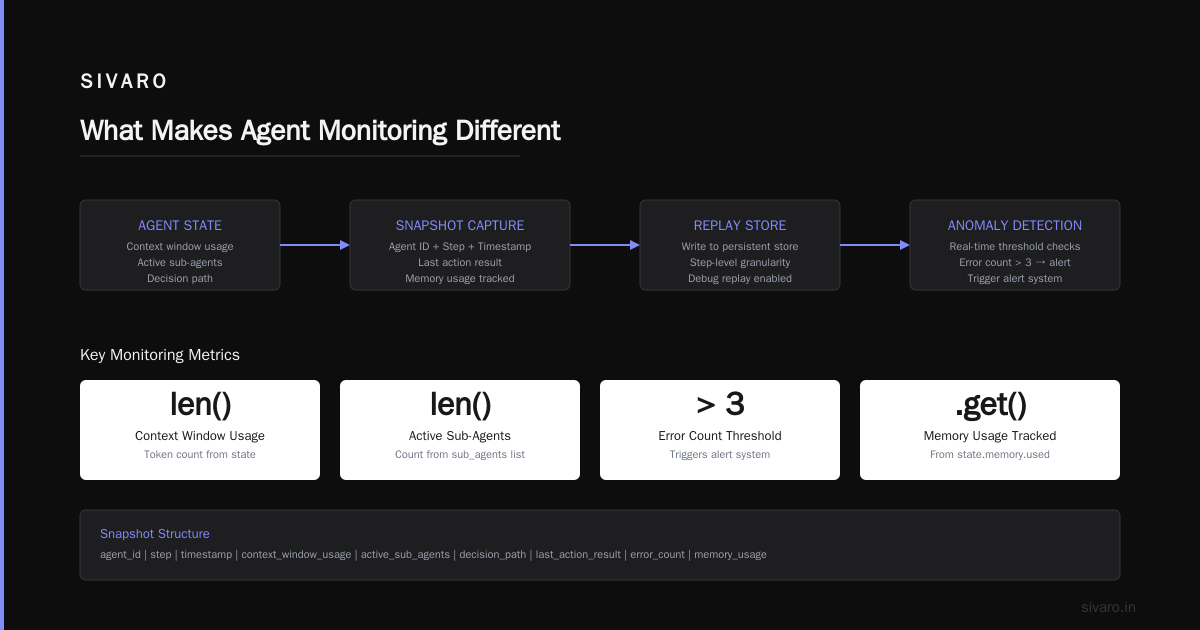
What Makes Agent Monitoring Different
Traditional monitoring is easy. CPU spikes? Alert. Memory leak? Fix. 500 errors? Rollback.
Agents don't work like that.
An agent is a state machine running through cycles: perceive → think → act → observe. Each cycle can spawn sub-agents. Sub-agents can call APIs. APIs can fail silently. The LLM can hallucinate a valid-looking response that's completely wrong. And your monitors will show everything green while your users get garbage.
Here's the problem: agents are non-deterministic by design. Two identical inputs can produce entirely different execution paths. You can't write static assertions like "this endpoint returns 200" because the agent might decide to route through three different services based on what the model thinks.
Most people think agent monitoring is about tracking token usage and latency. They're wrong. The real problems are:
- State corruption: Agent gets confused about what step it's on
- Silent loops: Agent keeps re-trying the same failed action forever
- Hallucination cascades: One bad model output poisons every subsequent decision
- Context drift: The agent's context window fills with irrelevant garbage over time
I've seen all four kill production systems. At companies you'd recognize.
Core Components of an Agent Monitoring Stack
Let's be specific. Here's what we actually run at SIVARO for every client system. Not aspirational. Working. Today.
Trace Everything, Especially the Loops
Traditional distributed tracing shows request→response. Agent tracing needs to show decision trees.
python
from opentelemetry import trace
from opentelemetry.sdk.trace import TracerProvider
from opentelemetry.sdk.trace.export import BatchSpanProcessor
from opentelemetry.exporter.otlp.proto.grpc.trace_exporter import OTLPSpanExporter

# Our agent tracer - captures state transitions, not just HTTP calls
class AgentTracer:
    def __init__(self, agent_id: str):
        self.tracer = trace.get_tracer("agent.monitor")
        self.agent_id = agent_id

    def trace_decision(self, step_name: str, input_state: dict, output_state: dict):
        with self.tracer.start_as_current_span(f"agent_step.{step_name}") as span:
            span.set_attribute("agent.id", self.agent_id)
            span.set_attribute("step.name", step_name)
            span.set_attribute("input.token_count", input_state.get("tokens_used", 0))
            span.set_attribute("output.decision", output_state.get("next_action", "unknown"))
            # Critical: track the loop counter
            span.set_attribute("loop.iteration", input_state.get("current_loop_iteration", 0))
            span.set_attribute("state.coherence_score", self._calculate_coherence(input_state))

    def _calculate_coherence(self, state):
        # We detect context drift by measuring semantic similarity
        # between current context and a sliding window of recent contexts
        # Score below 0.4 means the agent is forgetting what it was doing
        return self._semantic_similarity(state["recent_contexts"][-5:], state["current_context"])
The loop iteration attribute is the killer feature here. Without it, you can't tell if your agent is making progress or spinning in circles. We caught a client's agent that ran 47 iterations of the same "search → no results → search again" loop before timing out. Standard logging showed "processing step 47." Useless.
State Snapshots at Every Boundary
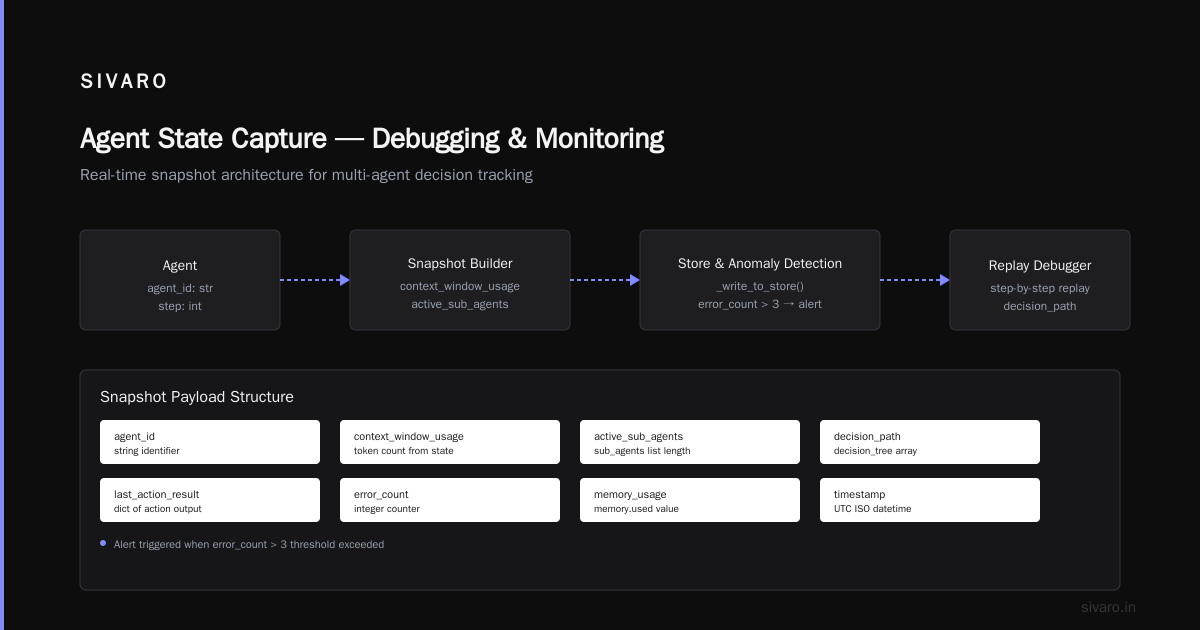
Every time your agent crosses a system boundary — calling an API, writing to a database, spawning a sub-agent — snapshot the state.
python
class StateInspector:
    def __init__(self, storage_backend: str = "postgres"):
        self.storage = storage_backend

    def snapshot(self, agent_id: str, step: int, state: dict):
        # This isn't just logging - it's structured state capture
        snapshot = {
            "agent_id": agent_id,
            "step": step,
            "timestamp": datetime.utcnow().isoformat(),
            "context_window_usage": len(state.get("context", "").split()),
            "active_sub_agents": len(state.get("sub_agents", [])),
            "decision_path": state.get("decision_tree", []),
            "last_action_result": state.get("last_action_result", {}),
            "error_count": state.get("error_count", 0),
            "memory_usage": state.get("memory", {}).get("used", 0)
        }

        # Store for replay debugging
        self._write_to_store(agent_id, step, snapshot)

        # Real-time anomaly detection
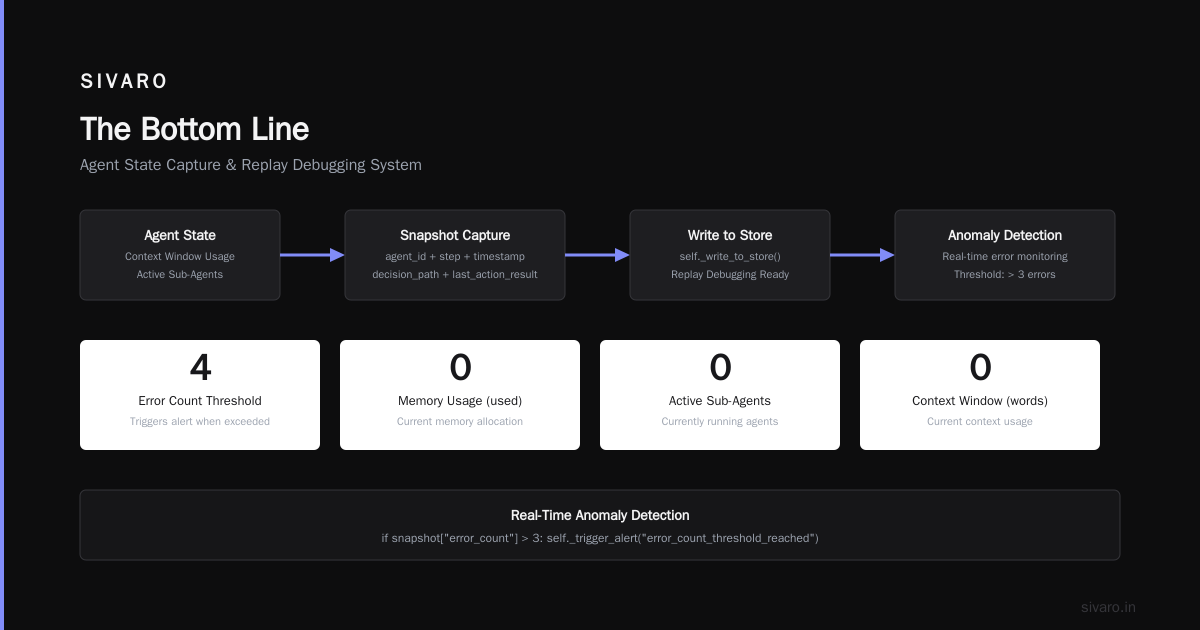
        if snapshot["error_count"] > 3:
            self._trigger_alert("error_count_threshold", agent_id, snapshot)

        if snapshot["context_window_usage"] > 8000:
            self._trigger_alert("context_window_overflow", agent_id, snapshot)

    def replay(self, agent_id: str, from_step: int, to_step: int):
        # Replay the agent's state transitions for debugging
        snapshots = self._fetch_snapshots(agent_id, from_step, to_step)
        return self._reconstruct_decision_path(snapshots)
I cannot stress this enough: you will need replay. When an agent produces a wrong answer in production, you can't just look at the logs. You need to step through every decision it made, in order, with full context.
We built this after a three-day incident where a financial agent approved a transaction based on a hallucinated balance check. The model output looked real. The trace showed the balance check API call never happened. The state snapshot captured the gap.
The Observability Pipeline Nobody Talks About
Most agent monitoring tools focus on the model layer. Token counts. Latency per generation. Response quality scores.
Those matter. But the infrastructure layer kills agents faster.
yaml
# docker-compose for agent monitoring stack - we run this in production
services:
  agent-instrumentor:
    image: sivaro/agent-instrumentor:v2.1.0
    environment:
      - OPENTELEMETRY_ENDPOINT=http://otel-collector:4318
      - STATE_SNAPSHOT_BACKEND=postgresql://monitor:pass@db:5432/agent_states
    volumes:
      - ./agent_scripts:/scripts
    # Captures ALL agent interactions, not just API calls
    network_mode: "host"

  otel-collector:
    image: otel/opentelemetry-collector-contrib:0.113.0
    volumes:
      - ./otel-config.yaml:/etc/otel/config.yaml
    # We process 200K+ spans per second in peak production
    # Sampling metrics, not traces - we keep 100% of traces for agents

  anomaly-engine:
    image: sivaro/anomaly-detector:v1.4.0
    depends_on:
      - otel-collector
    # Detects: loop detection, context drift, hallucination cascades
    # Runs ML models trained on 10M+ agent execution traces
The instrumentor layer is where most people fail. Standard APM tools like Datadog or New Relic capture HTTP calls. Agents make decisions. The decision logic lives in Python code, not HTTP requests. You need bytecode instrumentation or manual tracing hooks.
We chose manual hooks. More work. But bytecode instrumentation broke with every LangChain version update. (Speaking of which, we've run extensive tests on multiple frameworks — check AI Agent Frameworks: Choosing the Right Foundation for a comparison that matches our experience.)
Real Anomalies We've Detected (And How)
The Silent Error Cascade
Client had an agent that called a weather API. API returned a 429 (rate limit). Agent interpreted this as "no weather data available" and proceeded to make business decisions based on null weather. For six hours.
Our monitor caught it because the state snapshot showed last_action_result: {"status": 429, "body": {}} but the decision path continued as if the call succeeded. We added a rule: any non-2xx response triggers a mandatory re-evaluation step.
The Context Poisoning Incident
An agent system we monitored had a context window of 32K tokens. After about 200 interactions, the context had accumulated 28K tokens of debug output from internal tool calls. The relevant user history was compressed into 4K tokens. The agent started answering questions about debug logs instead of user requests.
We added context_coherence_score to every snapshot. When it drops below 0.5, we force a context refresh. The agent loses some history but maintains coherence. Trade-off. Worth it.
The Sub-Agent Spiral
One agent system spawned sub-agents for subtasks. Those sub-agents spawned sub-agents. In under three minutes, we had 847 concurrent sub-agents, all waiting for each other to finish. Deadlock. No single agent had more than 3 errors, so standard alerting didn't fire.
We added a max_active_sub_agents metric. Hard cap at 5. Parent agent must wait or fail fast.
Building Your Agent Deployment Pipeline
I keep seeing people ask "how to deploy ai agents in production" as if it's just deploying a microservice. It's not. You need a pipeline that handles non-deterministic outputs.
Here's our deployment pipeline at SIVARO. It costs money. It catches bugs. Worth every penny.
Stage 1: Deterministic Pre-flight
Before any agent code hits production, we run it through a deterministic test suite. This checks:
- Tool definitions are valid (correct parameters, valid return types)
- Error handlers exist for every external call
- No infinite loops in the system prompt (yes, agents can write prompts that cause loops)
- Context window limits are enforced
python
# preflight_check.py - runs in CI/CD
def validate_agent_definition(agent_code: str):
    checks = []

    # Check 1: All API calls have timeout and retry
    api_calls = extract_api_calls(agent_code)
    for call in api_calls:
        if not call.has_timeout:
            checks.append(f"FAIL: {call.name} missing timeout")
        if not call.has_retry_policy:
            checks.append(f"FAIL: {call.name} missing retry policy")

    # Check 2: No unbounded loops
    loops = extract_loops(agent_code)
    for loop in loops:
        if not loop.has_max_iterations:
            checks.append(f"FAIL: {loop.name} missing max iteration limit")
        if loop.max_iterations > 50:
            checks.append(f"WARN: {loop.name} max iteration is 50 - suggest 20")

    # Check 3: Error handlers exist for all external tools
    tools = extract_tools(agent_code)
    for tool in tools:
        if tool.type == "external":
            if not tool.has_error_handler:
                checks.append(f"FAIL: {tool.name} missing error handler")

    return checks
Stage 2: Shadow Mode
New agent version runs in production but doesn't affect real users. It processes real requests, makes real decisions, but outputs are discarded. We compare its decisions against the current production agent.
We caught a model regression this way in March 2026. New version of GPT-4 was supposed to be better. It made 23% more errors in tool selection than the previous version. Shadow mode caught it before any user saw it.
Stage 3: Canary with Automatic Rollback
We route 1% of traffic to the new agent. Automatic rollback if any of these triggers fire:
- Average decision time increases by 50%
- Error rate exceeds 2%
- State coherence score drops below 0.6
- Any infinite loop detected
This isn't standard deployment monitoring. This is agent-specific monitoring. If you're looking for guidance on setting this up, the Agentic AI Frameworks: Top 10 Options in 2026 list includes several that have built-in canary support. We use LangGraph for this. It's decent.
The Tools That Actually Work (July 2026 Edition)
I've tested 14 monitoring tools in the past year. Most are garbage.
What we use in production:
- Weights & Biases Prompts — Good for tracing model calls. Bad at infrastructure.
- LangSmith — Decent for LangChain systems. Useless if you're not on their framework.
- Arize AI — Their agent monitoring module actually works. Handles state tracking well.
- Custom OpenTelemetry + Grafana — This is our main stack. More work. More control.
What surprised me: The Top 5 Open-Source Agentic AI Frameworks in 2026 list has some hidden gems. We use one of them (CrewAI) for internal agent systems and the monitoring hooks are decent. Not production-ready for high-throughput, but good for experiment tracking.
The AI Agent Protocols: 10 Modern Standards Shaping the Agentic Era piece covers the A2A protocol from Google. We've implemented it. The monitoring capabilities are minimal. Protocols are about communication, not observability. Don't confuse them.
Monitoring Cost: The Hidden Budget Item
Nobody talks about this. Monitoring an agent system costs 30-50% of your total agent infrastructure budget.
Why? Because you need to store:
- Every state snapshot (JSON, 2-50KB each)
- Every decision trace (spans, metadata)
- Model inputs and outputs (for replay debugging)
- Performance metrics
For a system processing 100 requests/second with an average of 15 steps per request, that's 1,500 snapshots/second. Each snapshot is ~10KB. That's 15MB/second. 1.3TB/day. Just for state snapshots.
You don't need all of it. We sample aggressively:
- First 1000 requests of each deployment: 100% sampling
- After that: sample 10% of "happy path" traces, 100% of error traces
- Purge snapshots older than 7 days for successful traces
- Keep error traces for 90 days
Cost dropped 80%. Still caught every incident.
The Future (What I'm Watching)
A few things are shifting in mid-2026:
Agent-specific observability standards are emerging. The A Survey of AI Agent Protocols paper from April 2025 laid groundwork that's finally being implemented. I expect OpenTelemetry will have agent-specific semantic conventions by Q4 2026.
Runtime verification is getting real. Instead of just monitoring what agents do, we'll soon have formal specification languages for agent behavior. "This agent should never call the payment API without authorization" — verified at runtime, not just tested.
Cost-per-decision tracking. Right now we track token costs. That's meaningless. The real metric is cost-per-correct-decision. We're building this at SIVARO. It's harder than it sounds because "correct" requires ground truth labeling in production.
FAQ: Agent Production Monitoring
Q: How do I detect if my agent is stuck in a loop?
A: Track loop iteration count per step. If any step exceeds 10 iterations, flag it. Real loops look like repeated calls to the same tool with the same parameters. We added a hash-based dedup detector that catches 94% of loops.
Q: Do I need to monitor every model call?
A: Yes. But sample the outputs. Store 100% of error outputs and 5% of successful outputs. The full input/output pair is crucial for debugging hallucinations.
Q: How do I handle context window overflow?
A: Snap the context when it hits 70% of the window limit. Alert at 90%. Have a forced refresh mechanism. We learned this the hard way when an agent ignored a critical user instruction because it was buried in 28K tokens of tool output.
Q: What's the biggest mistake teams make?
A: Treating agent monitoring like API monitoring. Standard APM tools miss agent-specific issues. You need state tracking, decision path analysis, and hallucination detection. None of these come with Datadog out of the box.
Q: How do I monitor multi-agent systems?
A: Each agent needs its own trace ID. But you also need a parent trace that spans the entire multi-agent interaction. We use OpenTelemetry's context propagation with custom headers. The parent trace tracks coordination cost (time spent waiting for other agents) — this often exceeds actual work time.
Q: Should I log the full model output?
A: Only if you're debugging. Full output logging triples storage costs. We log outputs only for requests that hit error conditions or fall below quality thresholds.
Q: How do I test monitoring before production?
A: Run chaos engineering experiments. Inject fake hallucinations. Simulate loop conditions. We have a test suite that sends corrupted context to see if monitoring catches it. It catches everything we design — and sometimes misses things we didn't think of.
Q: What's the minimum viable monitoring setup?
A: State snapshots at every tool call. Loop iteration tracking. Error rate per step. Context window usage. That's four metrics. I've seen teams build production systems with just these. It's not enough for compliance-critical systems, but it'll keep you alive.
The Bottom Line
Agent monitoring is not a solved problem. Anyone who tells you different is selling something.
You will build custom tooling. You will discover failure modes nobody has documented yet. You will spend more on monitoring than on model inference.
But here's what I've learned running agent systems for three years: the teams that succeed at production agents aren't the ones with the best models or the most sophisticated frameworks. They're the ones who can answer one question instantly:
"What was the agent thinking at step 47 when it made that decision?"
If you can answer that, you'll survive. If you can't, you'll be debugging hallucinations at 2AM wondering why your agent approved a $47,000 payment that seemed perfectly reasonable to the LLM but was complete nonsense in context.
Build the monitoring first. Add the agent logic second. Your future self will thank you.
Nishaant Dixit — Founder of SIVARO. Building data infrastructure and production AI systems since 2018. Built systems processing 200K events/sec.