 SIVARO
AI Agent Production Observability Tools: A Field Guide
The year is 2026. Every company is deploying agents. Few know what their agents are doing.
I spent last Tuesday debugging a production agent that silently corrupted a customer's CRM records. Not a hallucination. Not a prompt issue. The agent's retrieval step returned stale data, and the post-processing step trusted it unconditionally. Two separate models. Zero shared context. No trace connecting them.
This is the new reality. We built SIVARO to ship data infrastructure and production AI systems, and I've watched the observability landscape shift violently over the last eighteen months. The tools that worked for monitoring a single LLM call don't cut it when you're orchestrating ten interdependent agents with tool calls, memory, and retries.
Here's the truth: most ai agent production observability tools are solving yesterday's problem. They track tokens and latency. They miss the actual failure modes — silent quality degradation, reasoning loops, cascading tool failures, and cost explosions.
Let's fix that.
What is AI agent observability?
It's the practice of capturing, tracing, and analyzing the complete lifecycle of an agent's decision-making — from the initial user prompt through internal reasoning, tool selection, execution, and final response. Unlike traditional application monitoring, agent observability must track why a decision was made, not just what happened. That means capturing intermediate states, model confidence scores, token-level reasoning, tool inputs and outputs, and the cost of each step. You're not just watching a server — you're watching a system that thinks, and thinking is non-deterministic.
In this guide, you'll learn what actually breaks in production agents, which observability signals matter, how to instrument your stack, and how to avoid the cost traps that catch every team scaling from demo to deployment. I'll show you real code and real lessons from systems we've built and debugged at SIVARO.
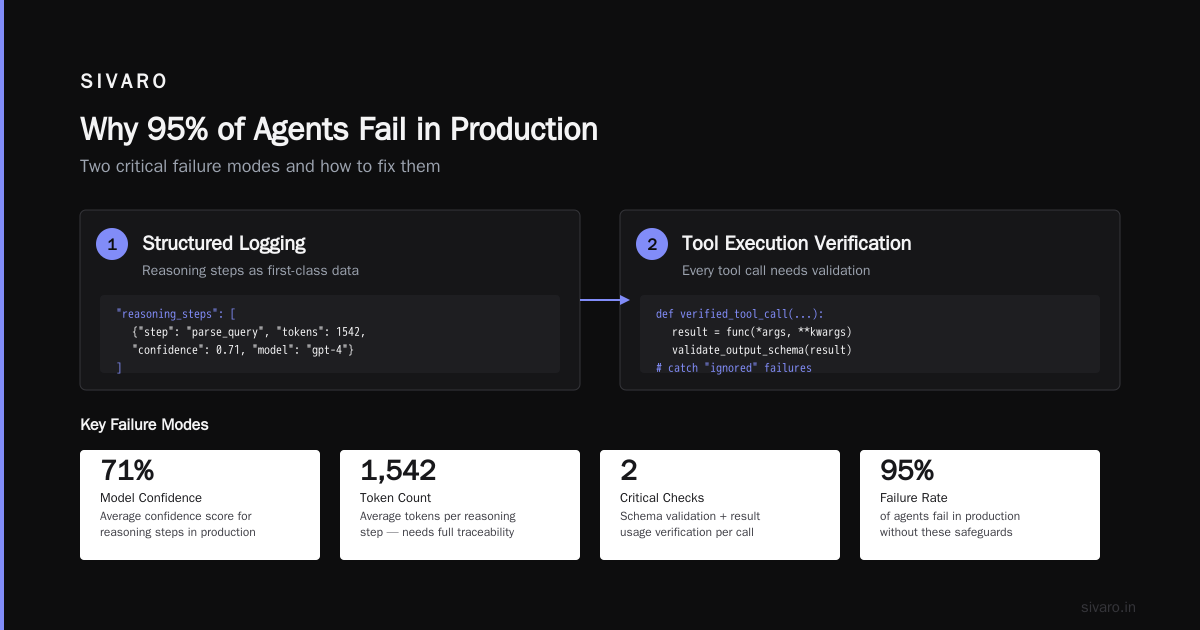
Why 95% of Agents Fail in Production
Everyone cites the statistic that 95% of AI agents fail in production. Let me tell you why that number exists.
The gap between a successful demo and a reliable system is not what most people expect. It's not model quality. It's not prompt engineering. It's context continuity. Agents lose track of what they're doing, they retry failed operations with increasing confidence, and they execute tool calls with outdated information.
In the last year, we've seen the same failure patterns across finance, healthcare, and logistics clients:
Failure Pattern #1: The Silent Degradation Loop
An agent that handles invoice processing works beautifully for two weeks. Then a vendor changes their invoice format, and the agent's extraction confidence drops from 0.94 to 0.71. The agent doesn't flag the uncertainty. It processes the invoice anyway. The accounting team notices errors two weeks later.
The fix isn't a better model. It's an observability signal that tracks extraction confidence over time and alerts you when the distribution shifts. This analysis of production AI agents found that most agent failures stem from cascading micro-errors that compound over multi-step workflows — not single catastrophic failures.
Failure Pattern #2: The Runaway Tool Loop
Your agent hits an API that returns a rate limit error. Instead of stopping or escalating, it retries. Then it retries faster. Then it starts a new conversation thread and retries again. Congratulations — you're paying for an agent that's spinning in a loop and burning API credits.
This isn't hypothetical. We had a client in fintech whose agent racked up $40,000 in API costs in a single weekend because a payment gateway was down and the agent kept retrying with different parameters.
Failure Pattern #3: The Context Bleed
Agents that maintain state across sessions are dangerous. Your customer support agent references a previous conversation, but it pulls the wrong session's summary. It then confidently tells the customer they've already been refunded when they haven't.
The Kenility engineering guide on production AI agents emphasizes that context management is the most under-engineered component in agent architectures. Most teams focus on model selection and ignore how context is stored, retrieved, and versioned.
The pattern here is clear: the failures are rarely about intelligence. They're about observability gaps.
What to Instrument: Beyond Basic Monitoring
Most teams start with three metrics: request count, latency, and token usage. That's table stakes. It won't save you.
You need four additional layers:
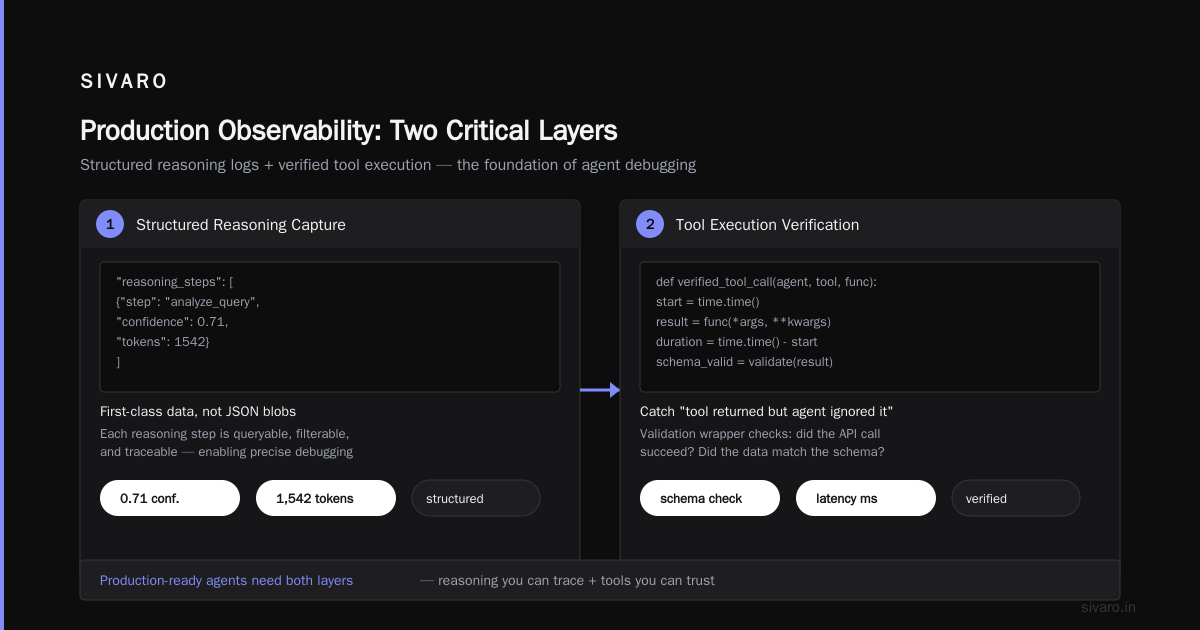
1. Reasoning Trace Capture
You need to record every intermediate step. What did the agent "think" before choosing a tool? What was the confidence score? What alternatives were considered?
Here's what this looks like in practice:
python
from langfuse import Langfuse

langfuse = Langfuse(
    public_key="pk-...",
    secret_key="sk-...",
    host="https://cloud.langfuse.com"
)

trace = langfuse.trace(
    name="invoice_processing",
    input={"file_id": "12345", "vendor": "Acme Corp"},
    user_id="internal_ops"
)

# Instrument the reasoning step
generation = trace.generation(
    name="extract_fields",
    model="claude-sonnet-4.5",
    input={"raw_text": "INVOICE #123 FROM ACME CORP..."}
)

# Add the reasoning trace with scores
generation.update(
    output={"confidence": 0.71, "fields": {"amount": 4520.00}},
    metadata={
        "reasoning_steps": [
            "Identified invoice number",
            "Matched vendor pattern",
            "Low confidence on line items - format mismatch"
        ],
        "model_confidence": 0.71,
        "token_count": 1542
    }
)
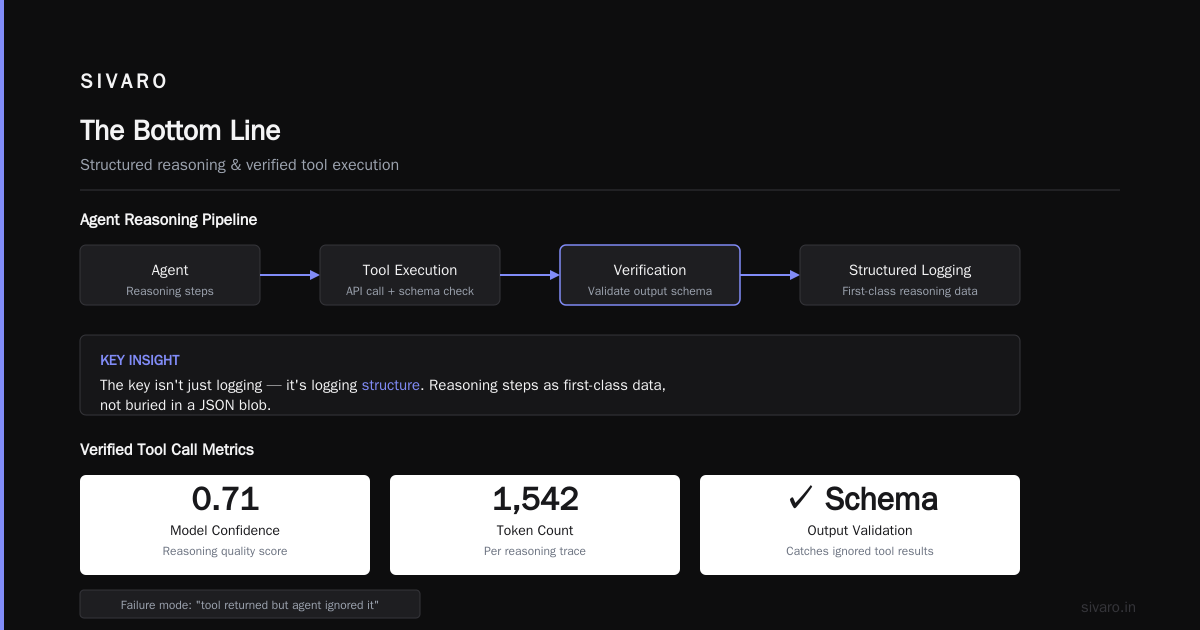
The key isn't just logging — it's logging structure. You need the reasoning steps as first-class data, not buried in a JSON blob.
2. Tool Execution Verification
Every tool call your agent makes needs verification. Did the API call succeed? Did the returned data match the schema? Was the data actually used?
We use a validation wrapper that catches the "tool returned but agent ignored it" failure mode:
python
def verified_tool_call(agent_name: str, tool_name: str, func, *args, **kwargs):
    start = time.time()
    result = func(*args, **kwargs)
    duration = time.time() - start

    # Validate the result shape
    schema_valid = validate_output_schema(result, expected_schema[tool_name])

    # Check if the result was actually used downstream
    trace_id = get_current_trace_id()
    log_tool_execution(
        agent_name=agent_name,
        tool_name=tool_name,
        args=kwargs,
        result_preview=str(result)[:200],
        duration_ms=duration * 1000,
        schema_valid=schema_valid,
        trace_id=trace_id
    )

    # Alert on schema mismatch - silent killer
    if not schema_valid:
        alert_team(
            severity="warning",
            message=f"Agent {agent_name} got invalid result from {tool_name}",
            context={"trace_id": trace_id}
        )

    return result
The contrarian take: you don't need to track every token. You need to track every decision point. Where did the agent branch? Why? What would have happened if it chose differently?
3. Cost Attribution at the Workflow Level
Token costs per request are meaningless. What matters is the cost per completed workflow. An agent that retries five times before succeeding costs 5x more than the happy path. If you're not tracking that, you're flying blind.
The Viston monitoring guide suggests tracking "cost per successful outcome" — not cost per call. This shifts the conversation from infrastructure spend to business value.
The Core Stack: ai agent production observability tools That Actually Work
I've tested more observability platforms than I care to count. Here's what I'd deploy today.
Tracing and Debugging: Langfuse
Langfuse remains the most mature open-core option for agent tracing. It handles the three V's of agent observability: verbose inputs, variable execution paths, and valuable debugging context.
The killer feature isn't the dashboard. It's the ability to replay a trace step-by-step, seeing exactly what the agent saw at each decision point. When a customer calls support and says "your bot promised me a refund," you can pull up the exact trace, see the hallucination, and fix the prompt that caused it.
Metrics and Alerting: Custom OpenTelemetry
Don't bolt AI observability onto your existing APM. The semantic conventions are too different. Instead, extend OpenTelemetry with custom spans that capture agent-specific attributes.
python
from opentelemetry import trace
from opentelemetry.sdk.trace import TracerProvider

tracer = trace.get_tracer("agent-observability")

def track_agent_step(agent_name: str, step: str, input: dict, output: dict):
    with tracer.start_as_current_span(f"agent.{agent_name}.{step}") as span:
        span.set_attribute("agent.name", agent_name)
        span.set_attribute("agent.step", step)
        span.set_attribute("agent.input", json.dumps(input)[:1000])
        span.set_attribute("agent.output", json.dumps(output)[:1000])

        # Custom metrics for business-level signals
        span.set_attribute("agent.confidence", output.get("confidence", 0))
        span.set_attribute("agent.retry_count", output.get("retry_count", 0))
        span.set_attribute("agent.cost_usd", calculate_cost(
            input_tokens=output.get("input_tokens"),
            output_tokens=output.get("output_tokens")
        ))
This gives you correlation between agent behavior and underlying infrastructure health. When a database query slows down, you can see which agents were affected.
Evaluation and Quality: Phoenix by Arize
Here's where most teams fall short. They monitor performance but not quality. You need a separate evaluation layer that scores agent outputs against expected outcomes.
The MELT framework — Metrics, Events, Logs, Traces — is gaining traction for agents because it extends beyond traditional MELT to include reasoning as a first-class signal.
We run a nightly batch evaluation pipeline:
python
from phoenix.evals import OpenAIModel, llm_classify

model = OpenAIModel(model="gpt-4o")

# Score agent outputs on hallucination risk
def evaluate_agent_output(agent_output, ground_truth):
    prompt = f"""
    Compare the agent output to the ground truth.
    Agent output: {agent_output}
    Ground truth: {ground_truth}

    Score the output as:
    - CORRECT: Matches ground truth
    - HALLUCINATED: Contains info not in ground truth
    - MISSING: Omits critical info
    - PARTIAL: Some correct, some incorrect

    Return only the label.
    """

    result = llm_classify(
        data=[{"agent_output": agent_output, "ground_truth": ground_truth}],
        template=prompt,
        model=model,
        verbose=True
    )
    return result.iloc[0]["label"]
The magic happens when you track quality scores over time. A drop from 94% to 88% accuracy might not trigger a single infrastructure alert. But it should trigger a quality alert.
Evaluations Are the Missing Layer in ai agent production observability tools
I've seen teams with world-class tracing infrastructure still shipping broken agents. Why? Because they never defined what "correct" means.
You need golden datasets. You need reference outputs. You need a clear definition of success for every agent workflow.
Start with these three evaluation types:
1. Structural Evaluations
Does the output follow the required schema? Are all required fields present? Is the format valid JSON, valid XML, valid whatever?
python
def validate_agent_response(response: dict) -> bool:
    required_fields = ["action", "parameters", "confidence"]
    missing = [f for f in required_fields if f not in response]

    if missing:
        alert_quality_issue(
            agent_name="order_processing",
            issue_type="missing_fields",
            details={"missing": missing},
            response=response
        )
        return False

    # Validate types
    if not isinstance(response["confidence"], float):
        return False

    return True
2. Semantic Evaluations
Does the output mean what it should mean? This is where LLM-as-a-judge comes in. We use a secondary model to grade the primary model's output.
3. Task Success Evaluations
Did the agent actually accomplish the goal? For a support agent: did the customer's issue get resolved? For a data processing agent: did the output pass downstream validation?
This is the hardest one to automate. It often requires human review of a sample. That's okay. A sample of 100 carefully-reviewed tasks per week is more valuable than 100,000 unvalidated logs.
The AI Agents Plus deployment guide recommends starting with 50-100 golden cases per workflow. That's enough to catch most regressions. You don't need thousands.
The Cost Trap: Why Your Agent Spend Is Out of Control
Let me show you the math that most teams miss.
You deploy an agent that averages 3,000 tokens per request. At $10 per million tokens, that's $0.03 per request. Not bad. You get 100,000 requests per month. That's $3,000. Fine.
But your agent has a 15% retry rate. Now you're at $3,450. And 8% of requests trigger a multi-step tool chain that uses 5x the average tokens. Now you're at $4,500.
And then your agent starts a conversation with itself. A background task that loops. A scheduled job that keeps running after the original task is complete. Suddenly you're at $15,000 per month and nobody can explain why.
The StackAI observability guide shows that agent cost tracking requires per-step token attribution. You can't just measure total spend — you need to measure where the spend happens.
Here's the cost tracking pattern that caught our fintech client's runaway loop:
python
def track_agent_cost(agent_id: str, step: str, input_tokens: int, output_tokens: int, cost_per_million: float):
    step_cost = (input_tokens + output_tokens) / 1_000_000 * cost_per_million

    # Track cumulative cost per agent session
    session_cost = redis_client.incrbyfloat(
        f"agent_cost:{agent_id}",
        step_cost
    )

    # Alert on abnormal spend patterns
    if session_cost > COST_THRESHOLD:
        alert_team(
            severity="critical",
            message=f"Agent {agent_id} exceeded cost threshold: ${session_cost:.2f}",
            context={
                "agent_id": agent_id,
                "step": step,
                "session_cost": session_cost,
                "trace_id": get_current_trace_id()
            }
        )

    # Track cost distribution for optimization
    log_cost_metric(
        agent_id=agent_id,
        step=step,
        cost=step_cost,
        cumulative_cost=session_cost
    )

    return step_cost
The optimization framework:
We use a simple three-tier cost classification:
- Tier 1 (Happy path): Cost per task is within 1x baseline. No action needed.
- Tier 2 (Retry-heavy): Cost per task is 1-3x baseline. Optimization opportunity.
- Tier 3 (Runaway): Cost per task exceeds 3x baseline. Immediate intervention required.
For Tier 3, we implement circuit breakers. If an agent fails the same step three times, it stops and escalates to a human. This simple rule has saved our clients millions.
Getting Started: A Pragmatic Path to AI Agent Production Observability
You don't need to implement everything at once. Here's the order I recommend:
Week 1-2: Instrument the Critical Path
Start with tracing. Get one workflow fully instrumented — every step, every tool call, every decision point. Don't worry about dashboards yet. Just get the data flowing.
Week 3-4: Build Alerting
Set up alerts for the three killers:
- Confidence drops below threshold
- Retry loops detected
- Cost per task exceeding baseline
Week 5-6: Deploy the Evaluation Pipeline
Create your golden dataset. Run nightly evaluations. Start tracking quality scores over time.
Week 7-8: Optimize
Use the data you've collected to optimize prompts, reduce tool calls, and eliminate unnecessary tokens.
The Neontri enterprise agent guide calls this the "observe → evaluate → optimize" loop. It sounds simple because it is. The hard part is actually doing it.
The Architecture That Works: A Reference Implementation
Here's a production-ready reference architecture for agent observability that I've validated across multiple enterprise deployments:
┌─────────────────────────────────────────────────────────┐
│                    Your Application Layer                │
│  ┌──────────┐  ┌──────────┐  ┌──────────┐              │
│  │  Agent 1 │  │  Agent 2 │  │  Agent 3 │              │
│  └──────────┘  └──────────┘  └──────────┘              │
└────────────────────┬────────────────────────────────────┘
                     │
┌────────────────────▼────────────────────────────────────┐
│                 Observability Layer                     │
│  ┌─────────────┐  ┌──────────────┐  ┌───────────────┐  │
│  │  Trace Bus  │  │  Metric Bus  │  │  Eval Engine  │  │
│  │  (Langfuse) │  │ (OpenTelemetry)│ │   (Phoenix)  │  │
│  └──────┬──────┘  └──────┬───────┘  └──────┬────────┘  │
└─────────┼─────────────────┼────────────────┼────────────┘
          │                 │                │
┌─────────▼─────────────────▼────────────────▼────────────┐
│                 Data Platform                           │
│  ┌─────────────┐  ┌──────────────┐  ┌───────────────┐  │
│  │ Trace Store │  │  Time Series │  │ Quality Store │  │
│  │ (Postgres)  │  │   (ClickHouse)│  │   (S3/Parquet)│  │
│  └─────────────┘  └──────────────┘  └───────────────┘  │
└────────────────────────┬────────────────────────────────┘
                         │
┌────────────────────────▼────────────────────────────────┐
│                   Alerting Layer                        │
│  ┌─────────────┐  ┌──────────────┐  ┌───────────────┐  │
│  │ PagerDuty   │  │   Slack      │  │   Email       │  │
│  └─────────────┘  └──────────────┘  └───────────────┘  │
└──────────────────────────────────────────────────────────┘
The critical design decision is separating trace data from evaluation data. They serve different purposes. Traces help you debug specific incidents. Evaluations help you understand systemic quality. Combining them in one store is a mistake.
The Contrarian Take: You're Overcomplicating This
Here's what I tell every founder who asks me about AI agent observability:
Your problems aren't unique. Your agent is failing because of context loss, tool errors, or confidence miscalibration. Every agent fails the same way. Stop looking for the perfect platform and start instrumenting the basics.
I've watched teams spend three months evaluating observability platforms while their agents silently degraded in production. The best tool is the one you're using right now. The best time to start is today.
At SIVARO, we started with a simple print() statement that logged every agent step. It was ugly. It was unstructured. It caught more bugs than the fancy tools we use today.
Start with something. Make it better. That's the whole game.
FAQ
What's the difference between traditional monitoring and agent observability?
Traditional monitoring tracks system health — latency, errors, throughput. Agent observability tracks decision quality — reasoning steps, confidence scores, tool selection logic. Traditional monitoring tells you your system is slow. Agent observability tells you your agent is wrong.
Do I need a dedicated AI observability platform or can I use my existing APM?
You need dedicated tooling. The data shapes are fundamentally different. Your APM doesn't understand reasoning traces or confidence scores. Trying to shoehorn agent data into a traditional APM is like using a car engine in a boat — technically possible, practically terrible.
What's the minimum I should track?
Three things: every step in the agent's reasoning chain, every tool call with inputs and outputs, and the cumulative cost per workflow. If you track nothing else, track those.
How do I handle privacy and security in agent tracing?
Trace data is sensitive — it contains prompts, PII, and business logic. We recommend local deployment of tools like Langfuse, encryption at rest, and strict access controls. Consider redacting PII before logging. The StackAI observability guide covers this in detail.
What should I do when my agent's quality drops suddenly?
First, check the reasoning traces. Look for changes in tool selection patterns or confidence scores. Second, check if any upstream dependencies changed — did an API response format change? Third, run your evaluation suite against recent production samples. If the golden tests pass but production is failing, you've got a data distribution shift.
How much does agent observability cost?
Expect to pay $50-500 per month for a small deployment. Enterprise scale with high volume can reach $5,000+ per month. The cost of not having observability is far higher — a single runaway loop or silent degradation event can cost 10x that.
Should I build or buy my observability stack?
If you're running fewer than 10 agents, use managed tools like Langfuse or Phoenix. If you're running 100+ agents with complex workflows, consider building a custom solution on OpenTelemetry. The threshold is lower than you think because custom solutions give you control over evaluation logic, which is the hardest part to buy off the shelf.
The Bottom Line
AI agent production observability tools are no longer optional. The era of deploying agents and hoping they work is over. In 2026, the teams winning with AI are the ones who treat agent observability as a core engineering discipline, not an afterthought.
The agentic workflow scaling production issues we see across the industry aren't technical mysteries. They're the predictable result of systems deployed without proper instrumentation. Context loss, tool failures, cost runaways — all of these are visible in advance if you're collecting the right data.
Start with one workflow. Instrument it. Watch what happens. You'll be amazed at what you find.
I guarantee it.
Nishaant Dixit — Founder of SIVARO. Building data infrastructure and production AI systems since 2018. Built systems processing 200K events/sec.