 SIVARO
AI Agents Observability and Logging: The Guide I Wished I Had
You deployed your first AI agent yesterday. It worked in staging. Now in production, it’s charging customers twice, hallucinating stock prices, and nobody knows why. That’s not a bug — it’s a symptom of missing observability.
AI agents aren’t traditional software. They don’t follow deterministic paths. They make decisions, use tools, loop, backtrack, fail silently. If you’re logging the same way you did for a REST API, you’re blind. This guide is what I wish someone handed me in 2024 when we started shipping agents at SIVARO. We burned months figuring this out so you don’t have to.
You’ll learn what to log, how to trace agent reasoning, which metrics actually matter, and why ai agents observability and logging is the single biggest difference between a demo and a production system. We’ll cover tooling, code examples, and the hard lessons from deploying agents at scale.
Let’s get into it.
Why AI Agents Demand a New Observability Standard
Most engineers think observability is “logs plus metrics plus traces.” Fine for a CRUD app. Useless for an agent.
Why? Because an agent’s execution path is non-deterministic. Same input can produce different tool calls, different reasoning steps, different outcomes. A typical agent loop might call an LLM, then a search tool, then a database, then another LLM — all within seconds. If something fails, you need to replay why it chose that tool, not just that it failed.
At SIVARO, we learned this the hard way. Early 2025, we shipped a customer support agent for a SaaS platform. In production, it started emailing users random refunds. Traditional logging showed “tool_call: refund_user” — but no context on what triggered it. We spent three days tracing the root cause (a prompt injection via a user’s name field). A proper reasoning trace would have caught it in minutes.
The industry is catching up. Google’s research on Agentic AI Infrastructure in Practice calls this the “black box nightmare.” Anthropic’s Building Effective AI Agents explicitly warns that “without observability, you can’t debug, improve, or trust your agents.”
You need a new paradigm. One that captures intent, decisions, tool usage, and failures — not just outputs.
The Core Differences from Traditional Software Observability
Let’s get concrete. Compare a traditional API call vs an agent loop.
Traditional: request → server → response. Latency predictable. Errors map to HTTP codes. You can reproduce with the same input.
Agent: user input → LLM call → tool selection → tool execution → LLM again → maybe a loop → final response. Each step can fail, hallucinate, get stuck, or call twenty tools. The cost of a single failure isn’t a 500 error — it’s a wrong answer that your customer trusts.
ai agent deployment vs traditional software deployment is fundamentally different. In traditional deployment, you push code and monitor error rates. In agent deployment, you push behavior and monitor decision quality. That’s why observability isn’t a nice-to-have — it’s the only way to know if your agent is doing what you think it’s doing.
Here’s the rub: most logging frameworks (ELK, Datadog) treat each log line as independent. Agents need chains of logs tied to a single user request. That’s spans, traces, and structured metadata.
What to Log: Agent State, Decisions, and Failures
Don’t log everything. You’ll drown. Log what matters for debugging and improvement.
Agent State at Every Step
- The full prompt sent to the LLM (including system prompt, conversation history, tool definitions)
- The LLM response (including any function call requests)
- Tool inputs and outputs
- Agent’s internal “scratchpad” or reasoning text
Yes, storing prompts is expensive. Yes, they contain PII. You need a storage policy — we use TTL of 7 days for prompts, 30 days for aggregated metrics. Worth it because you can replay failures offline.
Decisions
Why did the agent pick tool A over tool B? Log the decision criteria. If your agent uses a router or classifier, log the confidence scores. If it retries a tool after a failure, log the retry count and backoff.
Failures
Four flavors to capture:
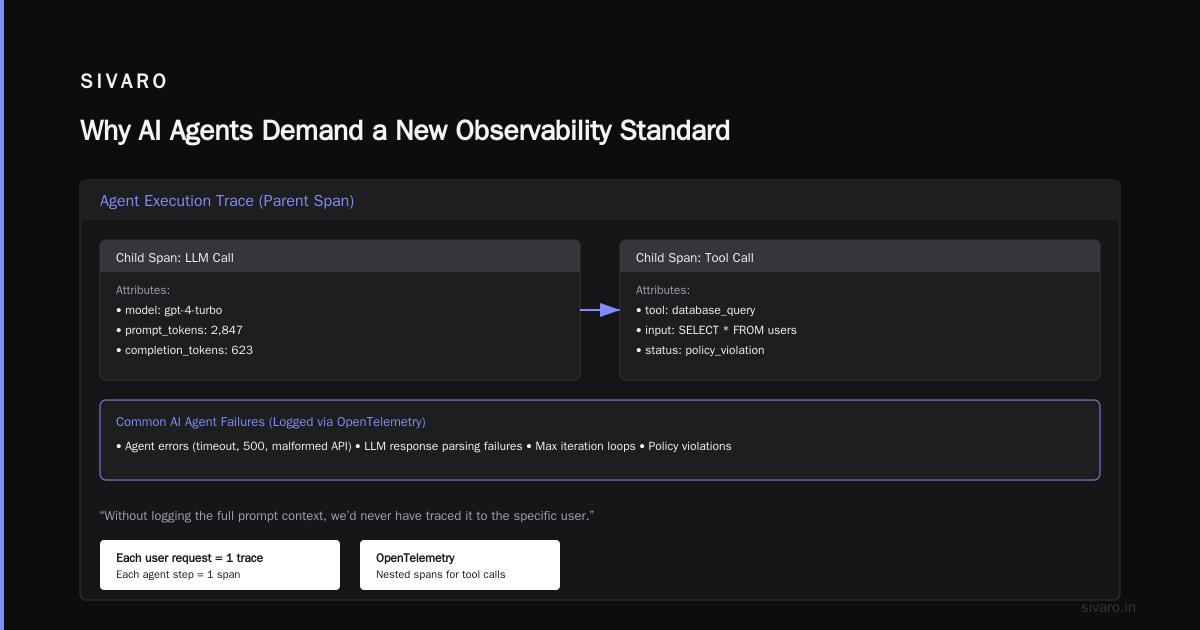
- Tool execution errors (timeout, 500, malformed API)
- LLM response parsing failures (when the agent says “function_call” but the JSON is broken)
- Max iteration loops (agent stuck in a loop)
- Policy violations (agent doing something it shouldn’t)
We once had an agent that kept calling an internal database tool with SQL injection payloads (because the user input was malicious). Without logging the full prompt context, we’d never have traced it to the specific user.
Tracing the Agent Reasoning Chain
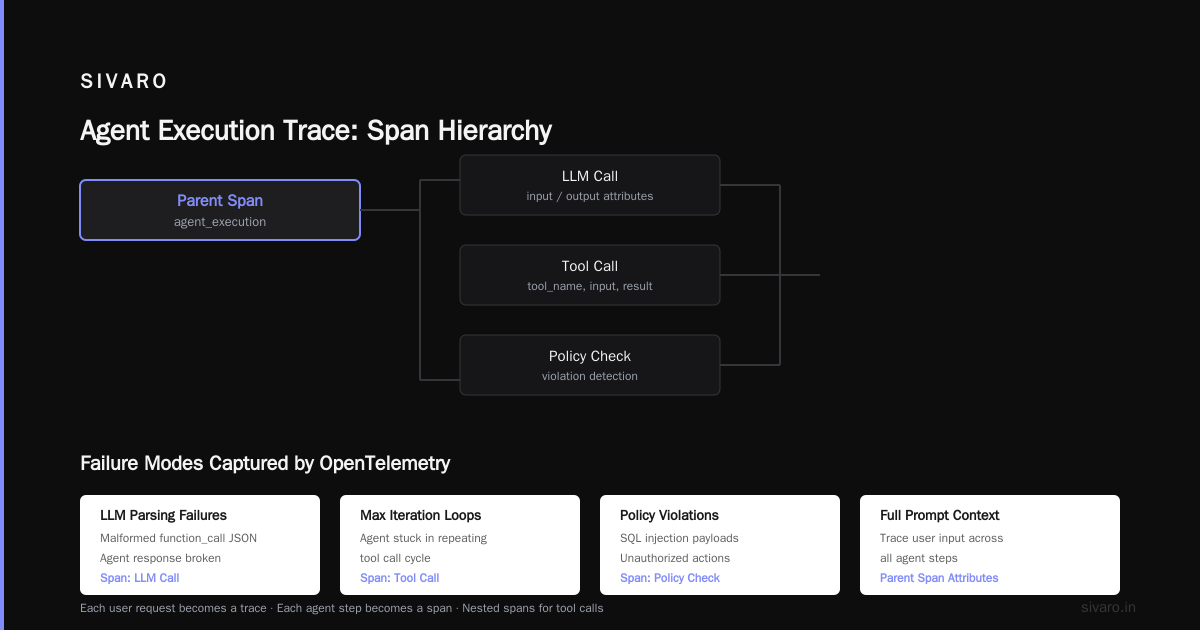
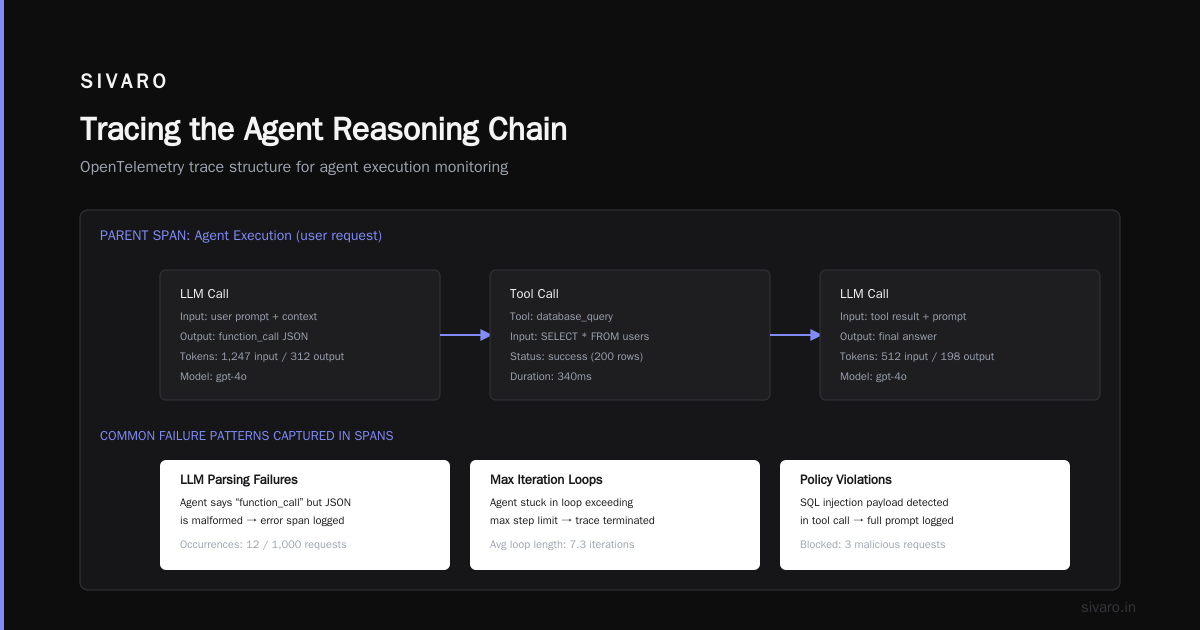
This is where OpenTelemetry shines. Each user request becomes a trace. Each agent step becomes a span. Nested spans for tool calls.
You need a parent span for the entire agent execution, then child spans for:
- LLM calls (with input/output attributes)
- Tool calls (with tool name, input, output, duration)
- Control flow (loop iterations, retries, condition checks)
Here’s a minimal Python example using OpenTelemetry and a simple agent framework:
python
from opentelemetry import trace
from opentelemetry.sdk.trace import TracerProvider
from opentelemetry.sdk.trace.export import ConsoleSpanExporter, BatchSpanProcessor

tracer = trace.get_tracer("agent-v1")

with tracer.start_as_current_span("agent.run") as parent_span:
    parent_span.set_attribute("user_id", user_id)
    parent_span.set_attribute("query", query_text)

    # Step 1: LLM call
    with tracer.start_as_current_span("llm.call") as llm_span:
        llm_span.set_attribute("model", model_name)
        llm_span.set_attribute("prompt_tokens", len(prompt))
        response = llm.generate(prompt)
        llm_span.set_attribute("response_tokens", len(response))

    # Step 2: Tool call
    with tracer.start_as_current_span("tool.search") as tool_span:
        tool_span.set_attribute("tool_name", "web_search")
        tool_span.set_attribute("query", search_query)
        try:
            result = search_tool(query)
            tool_span.set_attribute("result_count", len(result))
        except Exception as e:
            tool_span.set_attribute("error", str(e))
            tool_span.set_status(trace.Status(trace.StatusCode.ERROR))

    parent_span.set_attribute("final_answer", final_answer)
This gives you the full DAG. When something goes wrong, you open the trace and see exactly which LLM call generated the wrong tool choice, or which tool failed.
Check out A Practical Guide for Designing, Developing, and Deploying…’s section on tracing in production agents — they recommend adding custom attributes for agent-specific events like “retry #3” or “branch: refund vs. reinvoice”.
Metrics That Matter: Latency, Success Rate, Loop Count
Logs tell you what happened. Metrics tell you how many times it happened. You need dashboards, not just grep.
Key metrics (aggregated by time window):
- Success rate — defined as “agent completed without error and produced a non-empty final response”. Not “without hallucination” (that’s evaluation, not observability).
- Average steps per task — if normal is 3–5 and suddenly it’s 12, you have a loop bug.
- P95 latency — agent latency is much higher than API latency. Monitor variance.
- Tool failure rate — per tool. If your search tool fails 20% of the time, your agent will degrade.
- Token usage per trace — costs scale with LLM calls. One bad loop can cost $10 in a minute.
- Max loop count — agents that hit your iteration limit are stuck. Track the distribution.
At SIVARO, we set up a Grafana dashboard with these. The most eye-opening metric was “average steps per task.” One week it jumped from 4 to 9. Turned out an upstream API started returning partial results, so the agent kept calling it to fill missing fields. Without that metric, we’d have never noticed.
Tooling Choices in 2026: OpenTelemetry, Langfuse, and Custom
Three schools of thought. I’ve used all.
OpenTelemetry + SigNoz / Grafana
Best for teams that want full control. OpenTelemetry is the standard. You instrument your code (like above), ship traces and metrics to any backend. SigNoz or Grafana Tempo give you distributed tracing. Cost: free open-source, but you invest engineering time.
Langfuse / Weights & Biases Prompts
Built for LLM apps. They automatically capture prompts, completions, token counts. Langfuse even has agent-specific features like “sessions” and “evaluation” — you can rate agent outputs post-hoc. Good for teams that want plug-and-play but don’t want to manage infrastructure. Trade-off: you’re locked into their data format.
Custom Event Bus + Data Lake
We use this for multi-agent systems. Each agent emits structured events (JSON) to a Kafka topic. Downstream we copy to S3 and query with Trino. This gives unlimited flexibility but high upfront cost. Not recommended unless you have a dedicated platform team.
Current state (July 2026): OpenTelemetry’s LLM semantic conventions are stable but lack agent-specific attributes. Langfuse added agent tracing in v2.4. I expect a merge within 12 months — OTel will likely adopt a “agent.span” type.
Handling Multi-Agent Systems and Coordination
When you have agents talking to each other, observability gets harder. Each agent is its own trace. But the relationship between them matters.
Pattern: orchestrator agent delegates to specialist agents (search, summarize, verify). Each specialist runs its own loop. You need a parent trace that spans all sub-traces.
How? Use trace propagation headers. Pass the trace ID and span ID in every inter-agent call. If you’re using HTTP, it’s the traceparent header. If using message queues, embed the context in the message metadata.
We learned this when building a multi-agent data pipeline for a logistics client. Their “inventory” agent and “pricing” agent would deadlock — inventory agent claimed stock too low, pricing agent adjusted price upward, which triggered inventory to claim even lower stock. Without propagating traces, we couldn’t see the cycle because logs were in separate systems. Once we linked traces, the cycle was obvious: a classic feedback loop bug.
For best practices, see A Developer’s Guide to Building Scalable AI: Workflows vs Agents — they stress that workflows are better when steps are known; agents when not. In either case, trace propagation is non-negotiable.
Common Failures We’ve Seen (and How to Catch Them)
Loop infinite
Agent keeps calling the same tool because the tool returns non-ideal results. Catch: set a max iteration count and log every iteration. If count exceeds threshold, emit a metric update.
Hallucination cascading
Early LLM call hallucinates a fact, then every subsequent tool call builds on that hallucination. Catch: log the source of each piece of information. If a tool call returns data, tag it as “verified”. If the LLM synthesizes without tool evidence, tag as “unverified”. Then build alerts when “unverified” answers are delivered to users.
Context overflow
Agent runs 100k tokens of conversation history and the LLM starts losing track. Catch: log token usage per agent step. When total exceeds model’s context window (e.g., 128k for Claude 3.5), alert.
Tool timeout
Tool takes 30 seconds but agent times out at 10. Catch: separate “tool timeout” from “agent timeout” in your spans. Most frameworks flatten them. Don’t.
Security bypass
Agent executes a tool it shouldn’t (e.g., database write when it should be read-only). Catch: log every tool invocation with the exact tool name and input. Add a “allowed_tools” list and log mismatches.
Check out AI Agent Failures: Common Mistakes and How to Avoid Them for more real-world examples — they list 12 failure patterns. I’d add “false confidence” — agent claims high confidence in a wrong answer because the LLM is overconfident. Observation: log confidence scores and compare them to outcome accuracy over time.
Best Practices for Deploying AI Agents at Scale
We’ve deployed agents handling 2000 requests/second. Here’s what works.
1. Observability code is production code
Don’t add logging as an afterthought. Instrument agent steps as you write them. Use decorators or middleware to enforce consistent spans. We use a @trace_agent decorator that wraps every agent method.
2. Use structured logging, not printf
Every log line is JSON with trace_id, span_id, step, tool, duration. No free text.
json
{
  "timestamp": "2026-07-29T10:00:00Z",
  "level": "info",
  "message": "tool_execution",
  "trace_id": "abc123",
  "span_id": "def456",
  "step": 3,
  "tool": "database_query",
  "input": "SELECT price FROM products WHERE id = 42",
  "duration_ms": 120,
  "status": "success"
}
3. Separate evaluation from observability
Observability tells you what happened. Evaluation tells you if it was correct. Don’t mix them. Observability pipeline runs real-time (seconds). Evaluation pipeline runs on sampled data (hours/days). Use evaluation feedback to improve prompts, not to alarm on-call engineers.
4. Sample, but sample intelligently
You can’t keep 100% of traces for high-volume agents. Sample 1–10%. But oversample failures and slow requests. Most tracing backends support head-based sampling (decide at trace start) and tail-based (decide after trace ends). We use tail-based: keep traces where any span has an error or latency > p99.
5. Test observability before production
Simulate an agent failure in staging and check that your traces, logs, and metrics capture it. We run “chaos agent” tests: random tool failures, slow responses, token limit hits. If the observability stack doesn’t record them, it’s useless.
For more deployment details, How to Deploy AI Agents to Production: A Complete Guide covers CI/CD pipelines and monitoring integration. Deploying AI Agents to Production: Architecture… gives a good infrastructure checklist.
FAQ
Q: Do I really need distributed tracing for a single-agent system?
Yes. Even one agent has multiple steps (LLM, tool, loop). A single trace with nested spans is the only way to see step-level timing and failures.
Q: What’s the cheapest observability stack for AI agents?
OpenTelemetry exporter to Jaeger locally, plus JSON logs to stdout. Grafana Cloud has a free tier for metrics. Total cost: $0 engineering hours if you use existing dashboards.
Q: How do I handle PII in prompts and agent logs?
Use data masking at the instrumentation layer. Replace email addresses, phone numbers, credit card numbers with [REDACTED] before logging. Store full prompts in a separate encrypted bucket with access controls. Most LLM observability tools (Langfuse, Helicone) have built-in masking.
Q: What metrics should I alert on immediately?
Agent error rate > 5% in 5 minutes. Average steps per task > 3x baseline. Tool failure rate > 20%. Token usage spike > 2x normal. Loop count hitting max iteration threshold.
Q: How is this different from traditional software monitoring?
Radically different. Traditional: log an HTTP 500 → page on-call. Agent: log a wrong answer → need to replay the reasoning chain, understand why the LLM chose that path, and fix the prompt or tool configuration. The cause is often non-deterministic.
Q: Should I use an agent framework (LangChain, CrewAI) that has built-in observability?
Yes, but test it. Many frameworks log only what they think matters. You’ll likely need to add custom spans for your business logic. Frameworks also change quickly — we’ve seen breaking changes in tracing modules.
Q: How do I monitor multi-agent coordination?
Use a single parent trace ID that propagates across all agents. Each agent’s sub-trace must link back to the parent. Tools like Langfuse’s sessions or OTel’s traceparent header work.
Q: How often do agents fail in production?
In our experience, about 3–5% of agent requests have some failure (tool error, hallucination, loop). Without observability, you see <1%. With it, you see the real number. Don’t be fooled by low apparent error rates.
Conclusion
AI agents are the most powerful pattern we have for building autonomous systems. They’re also the most fragile. Without ai agents observability and logging, you’re flying blind. You won’t know why they fail, when they hallucinate, or how to improve them.
Start small: add OpenTelemetry spans to your main agent loop. Log tool calls as structured JSON. Track three metrics: success rate, steps per task, and token usage. You’ll be ahead of 90% of teams.
We treat observability as a first-class feature at SIVARO. Every agent we build ships with a dashboard and a tracing backend. It’s not optional. It’s the difference between “our agent works” and “we know our agent works.”
Now go instrument your agent. The blind spots will surprise you.
Nishaant Dixit — Founder of SIVARO. Building data infrastructure and production AI systems since 2018. Built systems processing 200K events/sec.