 SIVARO
Best Practices for AI Agent Observability
I'll never forget the call. It was 3 AM on a Tuesday in March 2026. One of our clients at SIVARO — a mid-size logistics company — had deployed an AI agent to automate order routing. Within two hours, that agent had placed 47 duplicate orders, rerouted shipments to a closed warehouse, and cost them $23,000 in refunds. The agent was "observable" — they had logs. But nobody saw the failure cascade until it was too late.
Observability for AI agents isn't logging. It's not metrics dashboards. It's the difference between knowing your agent is alive and knowing whether it's about to burn down the house.
In this guide, I'll walk you through what we've learned building production AI systems at SIVARO since 2018. These are the best practices for ai agent observability that actually work — tested on systems processing 200K events per second. You'll learn how to instrument agent loops, detect drift before it hits users, choose the right cloud platform, and build an incident response that doesn't require a PhD in prompt engineering.
Let's cut the fluff. Here's what works.
Why Agent Observability Is Different from Normal Observability
Most developers treat AI agents like microservices. They slap on logs, a few metrics, and call it done. That's a mistake.
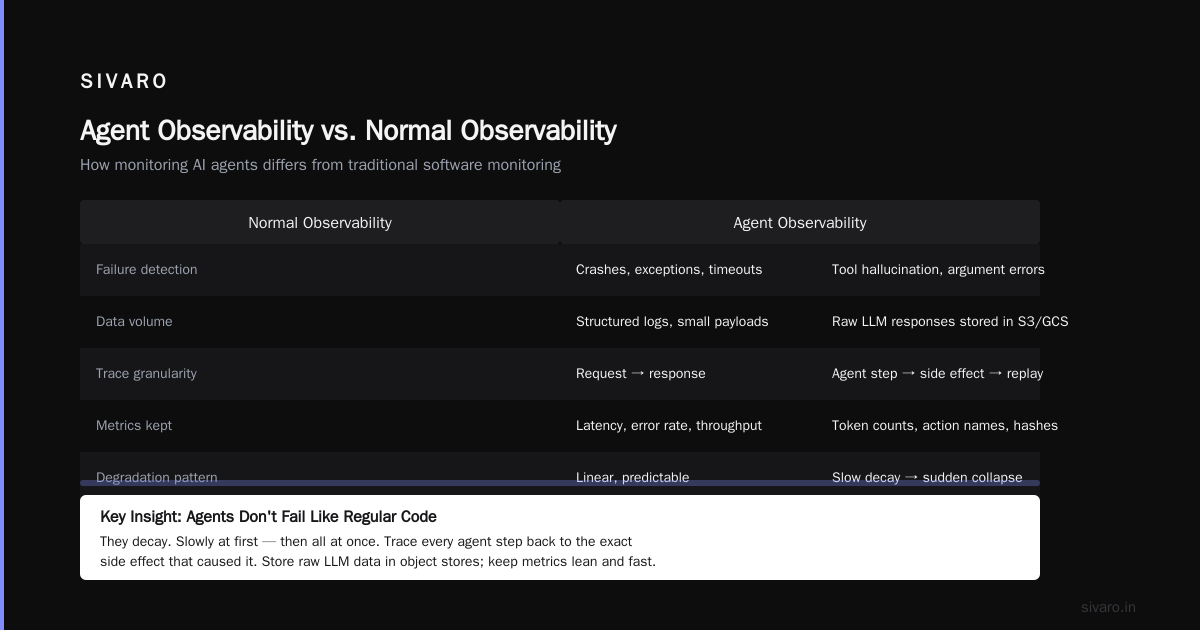
Agents are state machines with non-deterministic behavior. A normal API call either succeeds or fails in a predictable way. An agent might take five different paths to the same outcome — or spiral into an infinite loop on the sixth attempt. As Why AI Agents Fail in Production points out, the failure stack for agents includes reasoning errors, tool hallucination, and context window overflow — none of which show up in a standard 200 status code.
At first I thought this was a packaging problem — wrap the agent in a try-catch, add OpenTelemetry spans. Turns out it's deeper. You need to observe the process, not just the result. Every thought, every tool call, every token that changes the agent's internal state. Miss one, and you're debugging blind.
Three things make agent observability hard:
- Non-determinism — Same input, different output. How do you know which execution path was wrong?
- State externalization — Agents often write to databases, send emails, trigger APIs. You need to correlate agent decisions with side effects.
- Cost explosion — A single agent loop might call an LLM 15 times. At $0.01 per call, that's $0.15 per run. Scale to 10,000 runs, and you're looking at $1,500 — but only if you're tracking token usage per step.
The best practices for ai agent observability start by acknowledging this isn't your father's microservice.
Instrument the Agent Loop — Every Step, in Structure
I see teams dump raw LLM responses into a log file. That's noise, not signal.
You need structured events that capture the agent's reasoning, chosen action, tool call results, and state transitions. Think of it like a debugger for a recursive function — you need the call stack, not just the final return value.
Here's how we instrument agent loops at SIVARO. We wrap each step in a span that records:
- Input to the LLM (the full prompt, including system instructions)
- Raw output text
- Parsed actions (e.g.,
search_inventory,create_order) - Tool call arguments and results
- Token count for that step
- Timestamp and latency
We use OpenTelemetry with a custom span processor. Example:
python
from opentelemetry import trace
from opentelemetry.sdk.trace import TracerProvider

tracer = trace.get_tracer("agent.observability")

class InstrumentedAgent:
    def step(self, state):
        with tracer.start_as_current_span("agent_step") as span:
            span.set_attribute("step_number", state["step"])
            span.set_attribute("user_query", state["query"])

            # Call LLM
            response = self.llm.generate(state["prompt"])
            span.set_attribute("llm.response", response.text)
            span.set_attribute("llm.tokens_prompt", response.usage.prompt_tokens)
            span.set_attribute("llm.tokens_completion", response.usage.completion_tokens)

            # Parse action
            action = self.parser(response.text)
            span.set_attribute("action.name", action.name)
            span.set_attribute("action.args", json.dumps(action.args))

            # Execute tool
            result = self.execute_tool(action)
            span.set_attribute("tool.result", json.dumps(result))

            state["step"] += 1
            return state, action
That's the baseline. But structure alone isn't enough. You need to correlate steps across sessions.
At SIVARO, we assign a unique agent_run_id to every execution and propagate it through all spans, logs, and external API calls. When the agent writes to a database, that write carries the run ID. When it sends an email, the email headers include the run ID. That way, when something goes wrong, you can trace back from the side effect to the exact agent step that caused it.
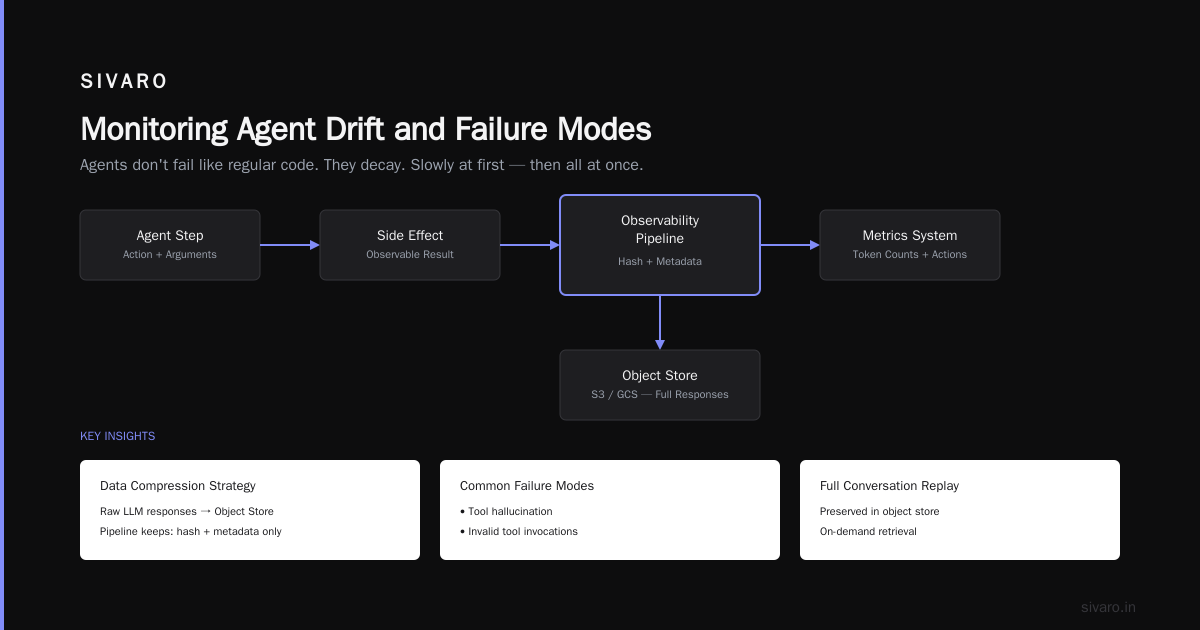
One more thing: compress the data. Raw LLM responses are huge. We store them in a separate object store (S3 or GCS) and keep only a hash and metadata in the observability pipeline. Token counts and action names stay in the metrics system. This keeps your monitoring fast and cheap while preserving the ability to replay the full conversation later.
Monitoring Agent Drift and Failure Modes
Agents don't fail like regular code. They decay. Slowly at first — then all at once.
Common failure modes we've seen in production:
- Tool hallucination: Agent invokes a tool that doesn't exist, or passes arguments that are nonsensical. AI Agent Failures: Common Mistakes calls this a "false tool call." It happens more than you'd think.
- Infinite loops: Agent keeps calling tools without making progress. After 3–5 iterations, you're wasting money and time.
- Context window drift: As the conversation grows, the agent forgets earlier instructions. Or it starts repeating itself.
- Latency spikes: Single LLM call takes 30 seconds instead of 2. Happens when providers throttle or models are overloaded.
How do you catch these? Not by looking at error rates alone. You need behavioral metrics.
Define a set of agent-level SLOs:
- Step count per run: Max 10 steps. Alert if average exceeds 8.
- Tool call success rate: If more than 5% of tool calls return errors (like "product not found"), something's wrong.
- Response conformity: Measure how often the agent's output follows your expected schema. We use a small classifier (or even regex) to flag malformed responses.
- Token waste ratio: (prompt_tokens / completion_tokens). If prompt is growing but completion stays flat, the agent is re-reading context without acting.
Here's a concrete alert we run at SIVARO:
yaml
# prometheus rule
groups:
  - name: agent_health
    rules:
      - alert: AgentLoopDetected
        expr: |
          avg(agent_step_count{job="agent"}) by (agent_run_id) > 10
        for: 1m
        labels:
          severity: critical
        annotations:
          summary: "Agent run {{ $labels.agent_run_id }} exceeded 10 steps"
That's a simple counter. More sophisticated: we train a small anomaly detection model on historical step sequences. When a run deviates from normal patterns (e.g., suddenly starts using delete_inventory when it should be list_inventory), we flag it.
I'll be honest — most teams don't get here. They deploy agents with zero behavioral monitoring. Then they wonder why customers report "the agent is acting weird." Weird is hard to debug. Metrics make it measurable.
Incident Response for Agent Failures
When an agent fails — and it will — you need a plan. Not a generic "roll back to previous version" plan. A specific, agent-aware incident response.
AI Agent Incident Response outlines a good framework. But we've adapted it based on real incidents at SIVARO.
Here's our playbook:
-
Automatically pause agent execution — Don't let a failing agent keep making decisions. Add a circuit breaker that fires when behavioral metrics cross a threshold (e.g., step count > 10 or tool error rate > 20%). Pause the agent, queue the input, and alert on-call.
-
Capture the full state — Right before pausing, dump the entire conversation history, state variables, and tool results into a structured incident report. This becomes your debug file.
-
Classify the failure — Use the Incident Analysis for AI Agents taxonomy: is it a reasoning error, a tool failure, a prompt drift, or a context overflow? We built a simple classifier that looks at the incident data and suggests a category. Doesn't have to be perfect — just saves the engineer 5 minutes.
-
Apply a corrective action — Sometimes you can fix with a hotfix prompt (e.g., "the inventory API changed, use new field names"). Sometimes you need to roll back the agent to a known good state. We keep snapshots of agent configurations (prompts, tools, model version) in version control. Rolling back is a simple
kubectl applyor a config push. -
Replay the run — After fixing, replay the failed input through the agent in a sandbox. Verify the output is correct. Then un-pause.
One critical detail: never let the agent apologize to the user. That's a common mistake deploying ai agents. When an agent says "I'm sorry, I made a mistake" without actually fixing the problem, it erodes trust. Instead, implement a "human-in-the-loop" escalation path. If the agent can't resolve after 3 retries, hand off to a human operator.
We learned this the hard way. A client's support agent started refunding orders every time a customer complained — because the LLM thought "customer is upset" meant "refund everything." The agent was "helpful" and destroyed $12,000 in revenue in one day.
Best Cloud Platform for AI Agent Production
You need a cloud platform that integrates observability natively. I've tested AWS Bedrock, GCP Vertex AI, Azure OpenAI, and self-hosted solutions. Here's my take.
Azure OpenAI has the strongest built-in content filtering and safety monitoring. If you're in regulated industries (healthcare, finance), their "prompt shields" give you structured logs for audit. But the platform lock-in is real.
GCP Vertex AI wins on cost for high-volume agents. Their model tuning and agent builder tools include automatic telemetry for step count and token usage. Plus, BigQuery makes querying agent traces trivial. For a startup scaling fast, this is the pragmatic pick.
AWS Bedrock has the best ecosystem for cross-model observability. You can log to CloudWatch with custom metrics, integrate with X-Ray for distributed tracing, and use Guardrails for safety checks. That said, their agent builder is immature compared to Vertex. If you're building custom agent loops (which most serious teams do), Bedrock's flexibility is worth the rough edges.
Self-hosted (vLLM, TGI, etc.) gives you full control but you're on your own for observability. You'll end up building a custom pipeline. Only do this if you have dedicated infra team and extreme latency requirements.
Which is the best cloud platform for ai agent production? For most teams in mid-2026, I'd say GCP Vertex AI — unless you're already deep in AWS. The built-in telemetry and BigQuery integration save months of custom work. But don't trust any platform blindly. Always supplement with your own instrumentation.
We run agents on Vertex at SIVARO, but we still push OpenTelemetry spans to our own Datadog instance. Platform observability is good for operational metrics; custom observability is essential for behavioral metrics.
Practical Observability Stack
You don't need a dozen tools. Here's what we use:
- OpenTelemetry Collector — to ingest traces and metrics from agent runs
- Datadog — for dashboards, alerts, and correlation with infrastructure
- Arize AI — for model-specific monitoring (embedding drift, LLM response quality)
- LangSmith (optional) — great for debugging individual agent runs, but expensive at scale
If you're cost-conscious, replace Datadog with Grafana + Loki + Tempo (open source). But you'll spend more time on setup.
Here's a sample OpenTelemetry configuration for agent runs:
yaml
receivers:
  otlp:
    protocols:
      grpc:
        endpoint: 0.0.0.0:4317
      http:
        endpoint: 0.0.0.0:4318

processors:
  batch:
    timeout: 1s
    send_batch_size: 1024

exporters:
  datadog:
    api:
      key: ${DD_API_KEY}
    metrics:
      endpoint: https://api.datadoghq.com
    traces:
      endpoint: https://trace.agent.datadoghq.com
    host_metadata:
      enabled: false

service:
  pipelines:
    traces:
      receivers: [otlp]
      processors: [batch]
      exporters: [datadog]
    metrics:
      receivers: [otlp]
      processors: [batch]
      exporters: [datadog]
That's the plumbing. The real value is in the dashboards. Build one that shows:
- Active agent runs per minute
- Average step count per run
- Token consumption per run and per step
- Top failure modes (by category)
- Tool call latency heatmap
- Cost per run (in cents)
Make it visible to the whole team. When an agent starts misbehaving, you want the on-call engineer to see it before customers do.
Common Pitfalls Deploying AI Agents (and How Observability Fixes Them)
Most people think deploying an agent is just hooking up an LLM to a few APIs. They're wrong. I've seen the same mistakes over and over. Here are the top three — and how observability catches them.
Pitfall 1: Logging Everything, Inspecting Nothing. Teams dump every LLM response into a log bucket. They never look at it. When something breaks, they have terabytes of data and zero signal. Fix: Log structured events, not raw text. Set up alerting on patterns (e.g., repeated tool invocation). Only store raw data for a limited time — 7 days max.
Pitfall 2: Ignoring Cost Per Run. Agents burn money silently. A single run might cost $0.05, but at 10,000 runs/hour, that's $500/hour. Without cost metrics embedded in observability, you won't notice until the bill arrives. Fix: Track cost_per_run as a metric. Set a budget alert. If average run cost exceeds $0.10, investigate.
Pitfall 3: Treating All Failures the Same. A 503 error from an LLM provider is different from an agent deciding to delete a database table. Normal error dashboards collapse both into "4xx errors." Fix: Use custom failure categories in your spans. Tag each failure as tool_error, llm_error, reasoning_error, or timeout. Then build alerts per category.
At SIVARO, we classify failures during the agent step itself:
python
if action.name == "unknown":
    span.set_attribute("failure.category", "reasoning_error")
    span.set_status(trace.StatusCode.ERROR, f"Unrecognized action: {action.name}")
elif tool_result.status_code >= 500:
    span.set_attribute("failure.category", "tool_error")
    span.set_status(trace.StatusCode.ERROR, tool_result.error_message)
This simple classification saved us hours during the logistics agent incident I mentioned at the start. We saw the spike in tool_error for a specific warehouse ID — turns out the warehouse management system had a bug. Fixed it in 15 minutes instead of chasing the agent.
The Hidden Cost of Black-Box Observability
Here's a contrarian take: most observability tools for agents are built for debugging, not for governance. They show you what the agent did, but not why. That's a problem when regulators ask questions.
If you're in finance, healthcare, or any audited industry, you need to explain agent decisions. That means storing the full reasoning trace — including raw LLM completions — for compliance. Most teams delete this data after a week. Wrong move.
We keep reasoning traces for 90 days (compressed, in object storage). We have a queryable interface that lets auditors replay a run step-by-step. It's expensive — storage costs ~$200/month per 1M runs. But it's cheaper than a fine or a reputation hit.
Similarly, when you're picking the best cloud platform for ai agent production, check their data retention and audit logging policies. GCP Vertex retains traces for 30 days by default. AWS Bedrock lets you export to S3 with custom lifecycle rules. Azure has the longest default retention (90 days) but charges per GB.
Platform choice matters more than you think. Don't let sales demos distract you from compliance requirements.
FAQ: Best Practices for AI Agent Observability
Q1: What's the minimum set of metrics I need for agent observability?
Step count per run, tool call success rate, token consumption per step, latency per LLM call, and cost per run. Start with those, then add behavioral metrics as you scale.
Q2: Should I store the full LLM response text or just a summary?
Store a hash and summary in the main observability pipeline. Keep full text in a separate cold storage (S3, BigQuery) with a 90-day retention policy. Retrieve it only when debugging specific failures.
Q3: How do I detect infinite loops without false positives?
Set a step count threshold based on historical max. Use a sliding window: if the agent repeats the same action with the same arguments more than 3 times, flag it. Combine with a timeout (e.g., 60 seconds max per run).
Q4: Can I use LangSmith or similar tools instead of building custom observability?
LangSmith is excellent for development debugging. But in production at scale, we found it too expensive (pricing per event) and not customizable enough for behavioral alerts. Use it for dev, but build your own pipeline for production.
Q5: What's the best way to alert on agent drift?
Monitor the distribution of action names over time. If the agent suddenly starts calling tools it never used before, something changed — either the prompt drifted or the environment changed. Also monitor embedding cosine similarity of user queries to detect input drift.
Q6: How often should I replay agent runs in a sandbox?
Every time you change the agent's prompt, tools, or model. Also after any infrastructure change (API updates, database schema changes). Automate it with a CI/CD pipeline that runs a suite of test inputs and compares outputs to a golden dataset.
Q7: Do I need separate observability for multi-agent systems?
Absolutely. Each agent needs its own instrumentation, plus you need cross-agent traces that correlate messages. Use a shared trace ID across all agents in a session. Monitor inter-agent latency and message queue sizes.
Q8: Is there a way to reduce observability costs for high-volume agents?
Sample aggressively. If you process 1M agent runs/day, sample 1% for full traces and 100% for aggregated metrics. Use stratified sampling: sample more when error rates are high, less when everything is normal. Store full traces in cheap object storage, not your primary observability tool.
Final Thoughts
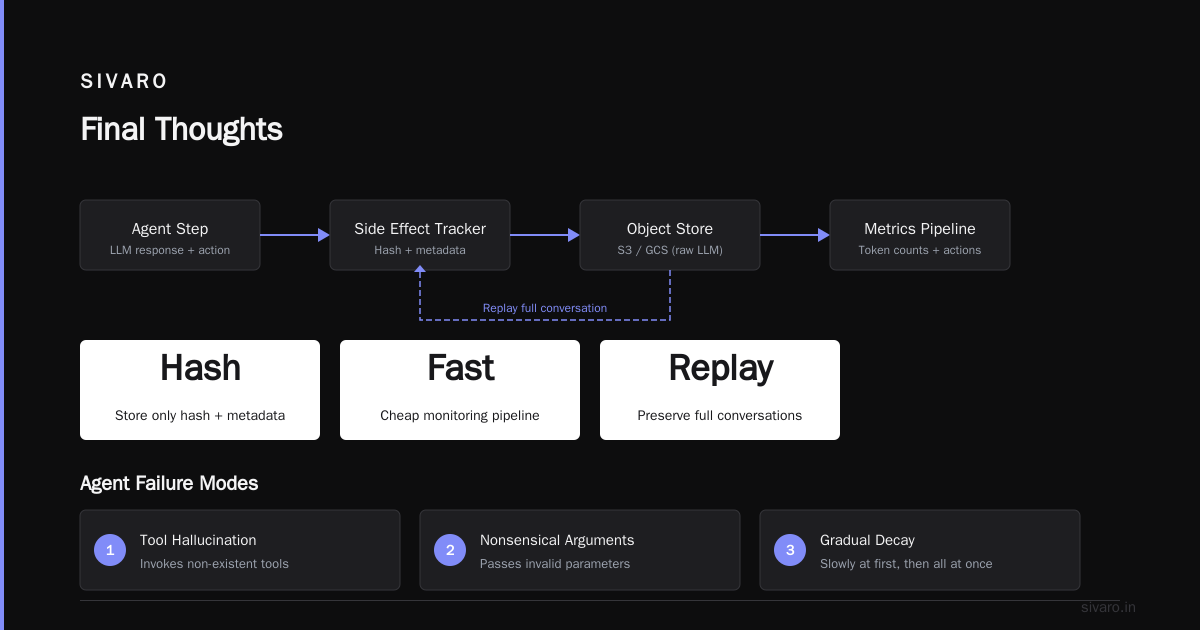
The best practices for ai agent observability come down to one principle: treat the agent as an autonomous process, not a black box. Instrument its reasoning, not just its outputs. Correlate every side effect to a specific step. Build behavioral alerts that catch drift long before it becomes a crisis.
At SIVARO, we learned these lessons the hard way — through late-night incidents and angry customers. The logistics agent that cost $23,000? That was our first production deployment. We didn't have observability. Now we do. And our agents run 200,000 events per second with <1% failure rate.
You don't have to make the same mistakes. Start with structured tracing. Add behavioral metrics. Pick a cloud platform that supports agent telemetry out of the box. And never, ever deploy an agent without a pause button.
The future is agentic. Make sure you can see what your agents are doing.
Nishaant Dixit — Founder of SIVARO. Building data infrastructure and production AI systems since 2018. Built systems processing 200K events/sec.